





Athletes frequently pursue body composition (BC) manipulation, more commonly weight loss, driven by various performance-related factors pertinent to their sport. Reducing fat mass (FM) can confer competitive advantages in certain sports, enhancing metrics such as power:weight ratio, movement efficiency and diminished energy expenditure(Reference Murphy, Hector and Phillips1). Additionally, aesthetic considerations frequently serve as a motivating factor(Reference Ackland, Lohman and Sundgot-Borgen2). While BC assessment is a standard practice in sports(Reference Meyer, Sundgot-Borgen and Lohman3), the method should be able to accurately track changes over time for evaluating responses to dietary and/or exercise programmes.
Multicompartment models, such as the four-compartment (4C) model, generally regarded as the reference method for FM(Reference Heymsfield, Wang and Baumgartner4), can account for variations in fat-free mass (FFM) characteristics (e.g. hydration), thus reducing the error in BC assessment compared with simpler two-compartment models, which rely on fixed constants(Reference Withers, Laforgia and Heymsfield5). Indeed, not only do some populations (e.g. athletes) often deviate from these assumed constants(Reference Ackland, Lohman and Sundgot-Borgen2), but the relative proportions of FFM components can also vary with weight fluctuations, with potential consequences for the accuracy of the simpler BC methods(Reference Heymsfield, Ludwig and Wong6).
Despite their accuracy, multicompartment models are costly, time-consuming and impractical for routine use(Reference Heymsfield, Smith and Wong7). To overcome these limitations, a rapid 4C model was developed(Reference Nickerson, Esco and Bishop8,Reference Ng, Liu and Wang9) incorporating bioelectrical impedance spectroscopy (BIS) for total body water (TBW) estimation and dual-energy X-ray absorptiometry (DXA) for body volume (BV) determination(Reference Wilson, Fan and Shepherd10,Reference Smith-Ryan, Mock and Ryan11) . While the validity of rapid 4C models has been evaluated in diverse populations, including athletes(Reference Silva, Poinhos and Sardinha12), these studies were cross-sectional, and no study to date has evaluated the accuracy of this method to detect changes in BC over time.
Therefore, the present study aims to evaluate whether a rapid 4C model combining DXA-derived BV and BIS-derived TBW can accurately track longitudinal FM changes in athletes.
Methods
Participants
The present study analysed data from a previously published project(Reference Silva, Matias and Santos13), involving athletes competing at national and international levels in basketball, handball, volleyball, triathlon and swimming. An observational study design was employed, with a follow-up period ranging from 5 to 10 months, depending on the competitive calendar for each sport. The initial assessment (M1) occurred at the beginning of the season, while the second assessment (M2) was conducted immediately before the main competition phase. A participant flow chart is displayed in online Supplementary Figure 1.
For this analysis, participants whose FFM hydration (TBW/FFM) values were outside the reported range (0·686–0·808) in nine adult human cadavers(14) were excluded (n 5 in the eligible longitudinal data).
The study was approved by the Ethics Committee of the Faculty of Human Kinetics, University of Lisbon, and was conducted according to the Declaration of Helsinki for Human Studies from the World Medical Association(14).
Body composition measurements
All BC assessments were conducted in the morning after a 12-h overnight fast, with participants abstaining from caffeine and alcohol for the previous 24 h and avoiding vigorous exercise for at least 15 h prior to each measurement period (M1 and M2). The methodologies are summarised below.
Anthropometric measurements
Body weight (BW) was measured to the nearest 0·01 kg on an electronic scale connected to the plethysmograph computer (BOD POD©, COSMED), with participants wearing a bathing suit without shoes, and stature was measured to the closest 0·1 cm with a stadiometer (Seca). The CV for BW, based on test–retest using ten participants, was 0·072 %.
Dual-energy X-ray absorptiometry
Whole-body DXA scans (Hologic Explorer-W) were performed to estimate whole-body total mass (kg), FM (kg), FFM (kg) and bone mineral content (BMC, kg), as described elsewhere(Reference Silva, Nunes and Matias15). DXA measurement allows partitioning FFM into two components: lean soft tissue (LST) and BMC. Because BMC represents ashed bone, BMC was multiplied by 1·0436 to convert it into total bone mineral (Mo)(Reference Heymsfield, Wang and Lichtman16). Scan positioning, acquisition and analysis were standardised and followed the manufacturer’s guidelines. For participants taller than the scan area, BC was assessed using the sum of two scans (head and trunk plus limbs)(Reference Santos, Gobbo and Matias17). The CV in our laboratory for body mass FM, LST and BMC were 1·7 %, 0·8 % and 1·3 %, respectively(Reference Santos, Gobbo and Matias17).
Dual-energy X-ray absorptiometry-derived total body volume
DXA-derived BV (DXA-BV) was determined with the following equation from Silva et al. (Reference Silva, Jesus and Poinhos18): ${\rm{DXA \hbox{-} B}}{{\rm{V}}_{{\rm{Silva}}}}\left( \rm{L} \right){\mkern 1mu} = {\mkern 1mu} \left( {\rm{{{{FM}}} \over {0\cdot89}}} \right) + \left( {{\rm{{{LST}}} \over {1\cdot05}}} \right) + \left( {{{{\rm{BMC}}} \over {7\cdot81}}} \right) - 0\cdot126$
where FM is fat mass (kg), LST is lean soft tissue (kg) and BMC is bone mineral content (kg). The CV for DXA-BVSilva, based on test–retest using ten participants, is 0·42 %.
DXA-BV was also estimated following a theory-based approach(Reference Heymsfield, Smith and Wong7), using the value for the density of LST proposed by Heymsfield and colleagues(Reference Heymsfield, Smith and Wong7) (1·064 kg/l) and confirmed by our laboratory in a sample of 201 athletes (36 % females)(Reference Silva, Jesus and Poinhos18): ${\rm{DXA \hbox{-} B}}{{\rm{V}}_{{{\rm Heymsfield}}}}\left(\rm L \right) = \left( {{{{{\rm FM}}} \over {0 \cdot9007}}} \right) + \left( {{{{{\rm LST}}} \over {1\cdot 064}}} \right) + \left( {{{{{\rm Mo}}} \over {2\cdot982}}} \right)$
where FM is fat mass (kg), LST is lean soft tissue (kg) and Mo is bone mineral (kg). The CV for DXA-BVHeymsfield, based on test–retest using ten participants, is 0·47 %.
Air displacement plethysmography
BV was determined using an air displacement plethysmograph (BOD POD® model 2007A version 5.4.3, software BOD POD Body Composition System, COSMED). Wearing a swimsuit and a swimming cap, thoracic gas volume was measured for all participants, and BV was computed by adjusting the initial BV for thoracic gas volume. Subsequently, body density was calculated as the ratio of BW to BV. The CV in our laboratory for measuring BV is 0·36 %(Reference Silva, Santos and Matias19).
Total body water
TBW was measured through 2H dilution, analysed by a stable gas isotope ratio mass spectrometer (Hydra 20–20, PDZ, software SerCon Control Callisto v40.0.11, Europa Scientific). After a 12-h fast, an initial urine sample was collected, and a dose of deuterium oxide solution (2H2O) corresponding to 0·1 g/kg of BW was administered. Following a 4-h equilibration period, a second urine sample was obtained. Participants remained under continuous laboratory supervision for the 4-h equilibration period. During this interval, subjects refrained from food or fluid intake and performed only non-strenuous assessments (e.g. DXA and air displacement plethysmography (ADP)). Our laboratory’s CV for measuring TBW is 0·28 %(Reference Silva, Santos and Matias19).
Bioimpedance analysis
Hydration status was verified by analysing urine specific gravity using a digital refractometer. Participants remained fasted and refrained from fluid intake throughout the assessment. BIS (model 4200 Xitron Technologies) was used as an alternative to 2H dilution to determine TBW. Assessment was performed with participants in a supine position for 10 min prior to measurement to ensure fluid stabilisation, according to manufacturer specifications. BIS-derived TBW was calculated using the inherent BIS calculation based on Cole modelling(Reference Cole20) and mixture theories(Reference Hanai and Sherman21) rather than regression equations. A test–retest analysis of ten healthy participants showed a CV of 0·25 % for BIS-derived TBW.
Criterion four-compartment body composition model
A criterion 4C model was used to assess FM, based on the equation described by Wang et al. (Reference Wang, Pi-Sunyer and Kotler22): $\eqalign{\rm{FM (kg)} & = 2\cdot 748 \times {\rm BV} -\!0\cdot 699 \times {\rm TBW} + 1\cdot 129 \cr& \times {\rm Mo} - \!2\cdot 051 \times {\rm BW}}$
where BV is body volume (L), TBW is total body water (kg), Mo is bone mineral (kg) and BW is body mass (kg).
Rapid four-compartment body composition model
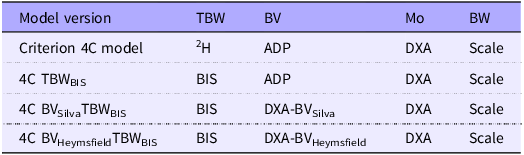
Rapid 4C models were calculated using a DXA-derived value of BV as previously described (equations 1 and 2) and BIS-derived TBW. Table 1 summarises the rapid 4C models evaluated.
Variations tested in rapid 4C body composition models

4C, four compartment; TBW, total body water; BV, body volume; Mo, mineral content; BW, body weight; ADP, air displacement plethysmography; BIS, bioelectrical impedance spectroscopy; DXA, dual-energy X-ray absorptiometry.
Fat-free mass characteristics
Using the above-mentioned methodologies, the proportions of TBW, Mo, soft tissue minerals (Ms) and protein (Prot) in FFM were estimated.
Ms was estimated as(Reference Heymsfield, Ebbeling and Zheng23): ${\rm{Ms\;}}\left( {{\rm{kg}}} \right) = 0\cdot0129 \times {\rm{TBW}}$
where TBW is total body water (L).
Prot was estimated as(Reference Heymsfield, Ebbeling and Zheng23): ${\rm{Prot\;}}\left( {{\rm{kg}}} \right) = {\rm{BW}} - {\rm{FM}} - {\rm{\;TBW}} - {\rm{Mo}} - {\rm{Ms}}$
where BW is body weight (kg), FM is fat mass (kg), TBW is total body water (L), Mo is bone mineral (kg) and Ms is soft tissue minerals (kg).
TBW/FFM, Mo/FFM, Ms/FFM and Prot/FFM were calculated using the reference TBW estimated from 2H dilution and the reference FFM estimated from 4C (FFM = BW – 4C FM).
The density of FFM (DFFM) was estimated as(Reference Heymsfield, Smith and Wong7): ${{\rm{D}}_{{\rm{FFM}}}}\;\left( {{\rm{kg}}/{\rm{l}}} \right) = {{{\rm{FFM}}\;} \over {{{{\rm{TBW}}} \over {0\cdot99371}}{\mkern 1mu} + {\mkern 1mu} {{{\rm{Prot}}} \over {1\cdot34}}{\mkern 1mu} + {\mkern 1mu} {{{\rm{Mo}}} \over {2\cdot982}}{\mkern 1mu} + {\mkern 1mu} {{{\rm{Ms}}} \over {3\cdot317}}}}$
where FFM refers to fat-free mass (kg), TBW is total body water (L), Prot is protein (kg), Mo is bone mineral (kg) and Ms is soft tissue minerals (kg).
Propagation of measurement error
In this study, the error associated with measuring FM from the criterion 4C model can be estimated by assuming an average BC of the whole sample (BV, TBW, Mo and BW) and measurement precision of each method, as stated throughout this section: $\begin{align}{FM}\;{\upsilon ^2} = &{\left( {2\cdot748 \times 70\cdot0 \times 0\cdot0036} \right)^2} + {\left( {0\cdot699 \times 45\cdot7 \times 0\cdot0028} \right)^2} \\&+ {\left( {1\cdot129 \times 2\cdot99 \times 0\cdot013} \right)^2} \\&+ {\left( {2\cdot051 \times 74\cdot38 \times 0\cdot00072} \right)^2}\\& = 0\cdot50\;\;\left( {\upsilon \simeq 0\cdot71\;{\rm{kg}}} \right)\end{align}$
The precision of the criterion 4C model to determine FM was ≃ 0·71 kg.
Applying the same calculations for the rapid 4C models using CV% of BIS-derived TBW: $\begin{align}{4C}\;{\rm{TB}}{{\rm{W}}_{{\rm{BIS:}}}}\;{\rm{FM}}\;{\upsilon ^2} =& {\left( {2 \cdot 748 \times 70 \cdot 0 \times 0 \cdot 0036} \right)^2} \\&+ {\left( {0 \cdot 699 \times 45 \cdot 3 \times 0 \cdot 0025} \right)^2} \\&+ {\left( {1 \cdot 129 \times 2 \cdot 99 \times 0 \cdot 013} \right)^2} \\&+ {\left( {2 \cdot 051 \times 74 \cdot 38 \times 0 \cdot 00072} \right)^2} \\&= 0 \cdot 50\;\;\left( {\upsilon \simeq \;0 \cdot 71\;{\rm{kg}}} \right)\end{align}$
This error propagation technique assumes that variables are independent. However, applying this method directly to the rapid 4C equations using DXA-derived BV would violate this assumption due to the interdependence between BV and Mo. DXA-derived BV is estimated using DXA outputs, including BMC, while Mo is simultaneously derived from the same BMC (Mo = 1·0436 × BMC). To resolve this multicollinearity and more accurately weight the error contribution of BMC measurement, we performed an algebraic substitution of the volume prediction equation directly into the criterion equation. This reduction consolidated the BMC terms from both the BV estimate and the Mo into a single independent term. Consequently, the measurement error was calculated by applying the previous formula to the primary independent variables (FMDXA, LSTDXA, BMCDXA, TBW and BW) using the algebraically derived coefficients: $\begin{align}4{\rm{C\;BVSilvaTB}}{{\rm{W}}_{{\rm{BIS}}}}&:{\rm{\;FM\;}}{\upsilon ^2}\, \\&= \,{\left( {3\cdot088 \times 12\cdot96 \times 0\cdot017} \right)^2} \\&+ {\rm{\;}}{\left( {2\cdot617 \times 58\cdot04 \times 0\cdot0077} \right)^2} \\&+ {\left( {1\cdot530 \times 2\cdot86 \times 0\cdot013} \right)^2} \\&+ {\rm{\;}}{\left( {0\cdot699 \times 45\cdot31 \times 0\cdot0025} \right)^2} \\&+ {\left( {2\cdot051 \times 74\cdot38 \times 0\cdot00072} \right)^2} \\&= 1\cdot85{\rm{\;}}\left( {\upsilon \simeq 1\cdot36{\rm{\;kg}}} \right)\end{align}$ $\begin{align}&{4C B}{{\rm{V}}_{{\rm{Heymsfield}}}}{\rm{TB}}{{\rm{W}}_{{\rm{BIS}}}}{\rm{:FM}} \\&{\upsilon ^2}\ = {\left( {3\cdot051 \times {\rm{\;}}12\cdot96 \times 0\cdot017} \right)^2} + {\rm{\;}}{\left( {2\cdot583 \times 58\cdot04 \times 0\cdot0077} \right)^2} \\&+ {\left( {2\cdot051 \times 2\cdot99 \times 0\cdot013} \right)^2} + {\rm{\;}}{\left( {0\cdot699 \times 45\cdot31 \times 0\cdot0025} \right)^2}\\& + {\left( {2\cdot051 \times 74\cdot38 \times 0\cdot00072} \right)^2}\\& = 1\cdot81{\rm{\;}}\left( {\nu \simeq {\rm{\;}}1\cdot35{\rm{\;kg}}} \right){\rm{\;}}\end{align}$
Body composition changes analysis
Analyses of longitudinal changes were performed in participants whose FM changes exceeded the measurement error threshold for criterion 4C (≃1 %) (n 60).
Given the limited research on least significant change (LSC), especially in multicompartment model studies, we performed a subgroup analysis in which LSC was defined as a value exceeding 95 % prediction interval of the precision error. In accordance with the International Society for Clinical Densitometry (ISCD) protocol(Reference Hangartner, Warner and Braillon24), LSC was calculated by multiplying the precision error by 2·77, yielding a minimal detectable change in FM of 1·97 kg at a 95 % confidence level. This subgroup consisted of twenty-five athletes whose FM alterations exceeded the LSC threshold.
Statistical analysis
IBM SPSS Statistics® (IBM) version 29.0 for Windows® was used for data analysis. Statistical significance was set at P < 0·05 (two-sided). We evaluated the data distribution’s normality by analysing skewness and kurtosis, both falling within acceptable ranges of |skewness| < 3 and |kurtosis| < 8(Reference Kline25).
Paired samples t tests were performed to evaluate the differences between the criterion 4C and alternative FM estimations longitudinally (Δ = M2–M1). The effect size (ES) of the differences was determined using Cohen’s d. The magnitude of the ES was determined by Hopkin’s scale(Reference Cohen26) as follows: [0; 0·2] = trivial, [0·2; 0·6] = small, [0·6; 1·2] = moderate, [1·2; 2·0] = large and ≥ 2·0 = very large. Pearson’s correlation coefficients (r) and mean differences (MD), obtained by subtracting the value obtained by alternative estimations from the value obtained by the criterion 4C, were also calculated. Positive differences indicate underestimation, while negative differences indicate overestimation. Analytical acceptance margins for group-level validity were predefined as a MD < 1·0 kg. This threshold was selected because it represents a conservative limit based on the criterion 4C model’s calculated measurement error (0·71 kg). Since the interaction between sex and alternative FM estimations was not statistically significant (P > 0·05), all analyses were conducted on the whole sample.
All ΔFM estimations were converted to absolute values to compare errors between alternative FM estimations, regardless of direction.
Furthermore, we evaluated the agreement between criterion 4C and the rapid 4C estimations using the Bland–Altman method(Reference Bland and Altman27), including the calculation of the 95 % limits of agreement (LOA). The correlations between the mean values and the differences were also determined to detect potential proportional bias. These calculations were performed using GraphPad Prisma® software version 10.0.3.
Results
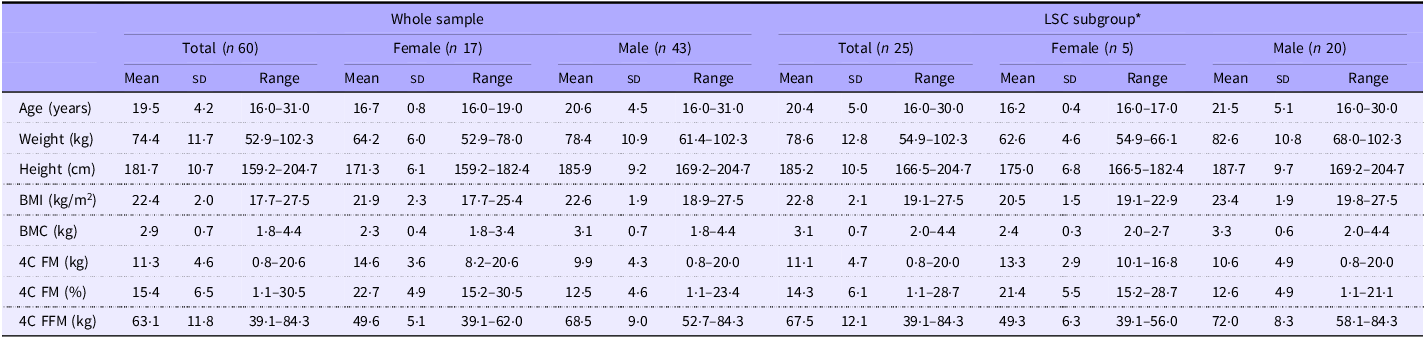
Table 2 presents the participants’ characteristics and BC at baseline (M1).
Participants’ characteristics and body composition at baseline

Data are presented as mean and standard deviations.
LSC, least significant change; BMC, bone mineral content; 4C, four compartment; FM, fat mass; FFM, fat-free mass.
*LSC was defined by a value that exceeded the 95 % prediction interval of the precision error (calculated by multiplying the precision error by 2·77), which corresponds to 1·97 kg.
Longitudinal analysis of rapid four-compartment model estimates
Mean DXA total body mass changes were similar to those from the electronic scale connected to the plethysmograph computer (FM loss: P = 0·782; FM gain: P = 0·919). A total of thirty-three athletes lost FM, losing an average of –2·17 kg (sd = 1·28 kg). Regarding athletes who gained FM (n 27), they gained an average of 2·18 kg (sd = 1·36 kg). The FFM components, TBW/FFM, Prot/FFM and Ms/FFM, significantly changed between moments (P = 0·016; P = 0·016 and P < 0·001, respectively), with no differences found for Mo/FFM and the DFFM (P = 0·378 and P = 0·161).
There were no differences in the errors of the alternative estimations (error = ΔCriterion 4C – ΔAlternative estimation) in ΔFM (kg) between the groups that lost or gained FM (P = 0·165 to P = 0·939). Also, the same was found between the sexes (P = 0·183 to P = 0·987).
Pearson’s correlation for changes in FM (kg) between the two visits measured by criterion and alternative estimates were 0·82, 0·56, 0·56 and 0·39 (P < 0·001, n 60), for 4C TBWBIS, 4C BVSilvaTBWBIS, 4C BVHeymsfieldTBWBIS and DXA, respectively.
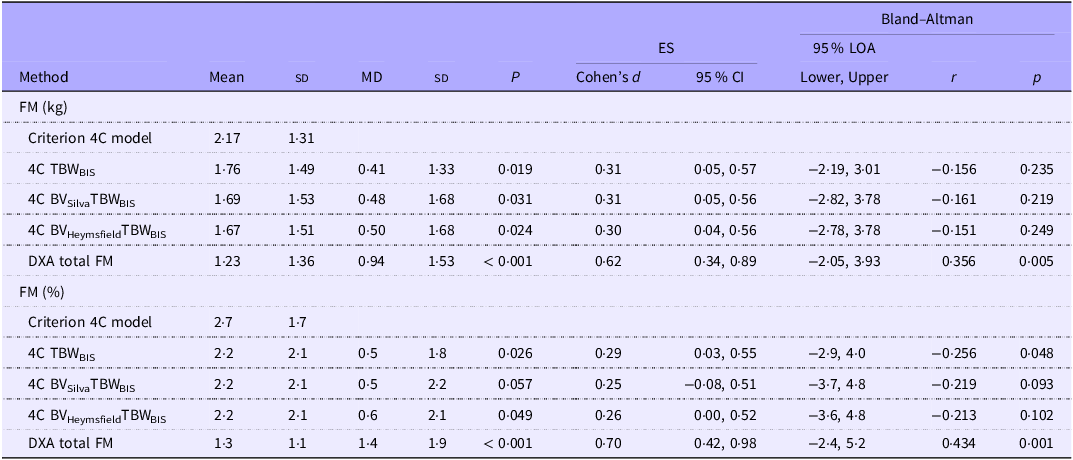
Table 3 presents the absolute differences in ΔFM (kg and %) for each method compared with the criterion. Compared with the criterion 4C model, alternative estimates consistently underestimated changes, with 4C TBWBIS providing the smaller and DXA the higher MD. The Bland–Altman analysis revealed a considerable variation in agreement between all methods. Even the alternative with the smaller 95 % LOA, 4C TBWBIS, had a wide LOA (−2·9 %, 4·0 %).
Comparison of absolute longitudinal changes of FM (kg and %) between the criterion 4C model and alternative estimates (n 60)

Table 3. Long description
The table compares absolute longitudinal changes of fat mass (FM) in kilograms and percentage between the criterion 4C model and alternative estimates. It has 12 rows and 11 columns. The columns are labeled as Method, Mean, SD, MD, SD, P, Cohen’s d, 95% CI, 95% LOA Lower, 95% LOA Upper, r, and p. The rows are labeled with different methods: Criterion 4C model, 4C TBWBIS, 4C BVSilvaTBWBIS, 4C BVHeymsfieldTBWBIS, and DXA total FM. Each row provides values for the respective columns. The table shows the mean, standard deviation (SD), mean difference (MD), P-value, Cohen’s d, 95% confidence interval (CI), and Bland-Altman analysis results including the 95% limits of agreement (LOA), correlation coefficient (r), and p-value for each method compared with the criterion 4C model.
FM, fat mass; 4C, four compartment; ES, effect size; LOA, limits of agreement; MD, mean difference; TBW, total body water; BIS, bioelectrical impedance spectroscopy; BV, body volume; DXA, dual-energy X-ray absorptiometry.
MD (the subtraction of the value obtained by the alternative estimates from the value estimated by criterion). 95 % LOA (MD ± 1·96 × sd of differences). Δ longitudinal changes (obtained by subtracting values at the second assessment (M2) from the initial assessment (M1), Δ = M2 – M1). A comparison of means between methods was performed using the paired sample t test. Pearson’s correlation (r) was performed to assess the correlation between methods and between the mean and the difference of the methods (Bland–Altman plot). All ΔFM (kg and %) estimations were converted to absolute values to compare errors between alternative FM estimations, regardless of direction.
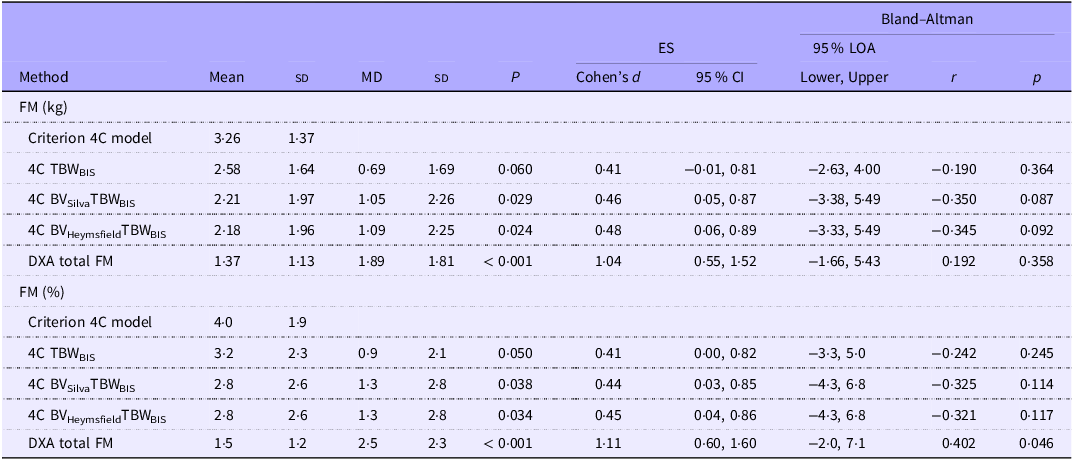
The comparison of absolute longitudinal changes of FM (kg and %) between the criterion 4C model and alternative estimates greater than the LSC can be found in Table 4. As seen in the main analysis, alternative estimates consistently underestimated the changes from 0·9 % from 4C TBWBIS to 2·5 % from DXA. Also, the 95 % LOA remained wide in this subgroup (n 25).
Comparison of absolute longitudinal changes of FM (kg and %), between the criterion 4C model and alternative estimates, greater than the least significant change (n 25)

FM, fat mass; 4C, four compartment; ES, effect size; LOA, limits of agreement; MD, mean difference; TBW, total body water; BIS, bioelectrical impedance spectroscopy; BV, body volume; DXA, dual-energy X-ray absorptiometry.
MD (subtraction of the value obtained by the alternative estimates from the value estimated by criterion). 95 % LOA (MD ± 1·96 × sd of differences). Δ longitudinal changes (obtained by subtracting values at the second assessment (M2) from the initial assessment (M1), Δ = M2 – M1). A comparison of means between methods was performed using the paired sample t test. Pearson’s correlation (r) was performed to assess the correlation between methods and between the mean and the difference of the methods (Bland–Altman plot). All ΔFM (kg and %) estimations were converted to absolute values to compare errors between alternative FM estimations, regardless of direction. Least significant change was defined by a value that exceeded the 95 % prediction interval of the precision error (calculated by multiplying the precision error by 2·77), which corresponds to 1·97 kg.
For transparency and to assess potential directional bias, signed longitudinal change analyses were also performed and are provided in online Supplementary Tables 1 and 2.
Discussion
This study provides the first longitudinal evaluation of the validity of rapid 4C models for tracking BC changes in athletes compared with a criterion 4C model using ADP and 2H dilution. While rapid 4C models showed acceptable group-level agreement, meeting our predefined MD threshold of < 1·0 kg (MD ≈ 0·5 %, corresponding to ≈ 20 % error), their wide 95 % LOA (± 150 %) and systematic underestimation of changes raise concerns for individual-level monitoring. These findings contrast with cross-sectional validations reporting narrower LOA (± 20 %) in athletic cohorts(Reference Silva, Poinhos and Sardinha12), highlighting the unique challenges of longitudinal tracking of FM. The MD for the rapid 4C models tested was ≈ 0·5 % FM, representing a mean error of approximately 20 %. DXA had the highest absolute underestimation of changes (1·4 % FM, approximately 50 %). Although these rapid 4C models presented good results at the group level, interpretation should be careful at the individual level, as the wide LOA may limit the ability to detect biologically meaningful changes in an individual. Although previous studies(Reference Silva, Poinhos and Sardinha12) have shown good cross-sectional agreement with the reference model, the high variability observed in these longitudinal analyses raises concerns about the practical utility of these rapid 4C methods for detecting real changes in FM. In scenarios that require high accuracy in monitoring variations, especially when small changes are expected, caution is advised when adopting these techniques, and, whenever possible, the criterion model should be used.
BC research is driven by the demand for practical and cost-effective methods(Reference Ward28). Ensuring the accuracy of existing and emerging technologies is essential for guiding clinical decisions and enhancing athletic outcomes(Reference Bennett and Lim29). Moreover, Artificial Intelligence has become a prominent topic, and its potential extends to assessing BC(Reference Santhanam, Nath and Peng30,Reference Graybeal, Brandner and Tinsley31) . Consequently, investigating the validity of methods that can serve as alternatives when the resource-intensive criterion 4C model is unavailable is important.
Despite comparable precision of TBW estimation by 2H and BIS in our laboratory (CV = 0·3 %), and ΔTBWBIS and ΔTBWdeuterium not differing significantly (n 20; MD = 0·48 kg; sd = 2·79 kg; ES (95 % CI) = 0·17 (−0·27, 0·61)), BIS exhibited large 95 % LOA (−4·99, 3·67 kg) for ΔTBW. Indeed, the differences in TBW changes between methods (ΔTBWdeuterium minus ΔTBWBIS) explained 81 % of the error found for 4C BVSilvaTBWBIS and, perceptibly, 100 % in the case of 4C TBWBIS.
While BW is typically measured with high accuracy using simple calibrated scales, determining BV requires specialised methodologies, each with inherent limitations. Underwater weighing requires subjects to be completely submerged underwater while fully exhaling their breath(Reference Fosbøl and Zerahn32). ADP has emerged as a superior alternative due to its increased reliability and reduced invasiveness(Reference Dempster and Aitkens33). Notwithstanding, ADP volume assessments can be influenced by body temperature, moisture, facial hair (e.g. the presence of facial hair can lead to an underestimation of BV due to the isothermal air trapped in the facial hair)(Reference Higgins, Fields and Hunter34) and clothing worn during testing(Reference Higgins, Fields and Hunter34,Reference Fields, Higgins and Hunter35) . Also, both methods impose determining or predicting residual lung and thoracic gas volumes(Reference Ackland, Lohman and Sundgot-Borgen2). The intestinal and stomach gas volume, not accounted for or roughly estimated, is another methodological constraint in these techniques that can lead to an error in BV estimation(Reference Fields, Goran and McCrory36). In contrast, DXA-derived estimates of BV are unaffected by intestinal gas since the X-ray beams do not capture them(Reference Heymsfield, Smith and Wong7) and are also independent of the above-mentioned limitations. Even though alternative solutions for TBW and BV have been suggested(Reference Ng, Liu and Wang9,Reference Smith-Ryan, Mock and Ryan11) , there is no accurate alternative for bone quantification, with DXA being essential for 4C models. Nevertheless, DXA also has recognised limitations such as participants’ exposure to radiation (even if in low amounts), differences in BC assessment across various manufacturers and software versions and the underestimation of FM in lean subjects(Reference Fosbøl and Zerahn32).
While measuring more components enhances validity, there is a concern about the propagation of errors in determining BV, TBW and Mo(Reference Withers, Laforgia and Heymsfield5). Nevertheless, the improved accuracy of FM estimations is not compromised(Reference Withers, Laforgia and Heymsfield5). In this investigation, the calculated propagation of error for the criterion 4C model was 0·71 kg (1 %). Applying the same calculations for the rapid 4C models – using CV% of DXA-derived BV and BIS-derived TBW – would yield a value of 0·77 kg (1·0 %), 0·82 kg (1·1 %) and 0·90 kg (1·2 %) for 4C TBWBIS, 4C BVSilvaTBWBIS and 4C BVHeymsfieldTBWBIS, respectively. However, for models using DXA-derived BV (4C BVSilvaTBWBIS and 4C BVHeymsfieldTBWBIS), this approach violates the assumption of variable independence due to the interdependence between BV and Mo. By applying an algebraic correction, as explained in the methods section, a more rigorous estimate increased the estimated error to 1·4 kg (1·8 %). While this represents a robust and conservative upper bound of uncertainty, it suggests that models incorporating DXA-derived BV have lower precision than the criterion. Nevertheless, we consider this an acceptable trade-off for the model’s enhanced efficiency, which reduces the protocol to only two devices. Crucially, this practical alternative enables FM assessment without requiring athletes to move between measurements, as individuals attain stable body fluid levels after undergoing the DXA scan, permitting an immediate assessment in the same position using BIS. Also, the precision of these rapid 4C models remains superior (4C TBWBIS) or equivalent (4C BVSilvaTBWBIS and 4C BVHeymsfieldTBWBIS) to the CV in our laboratory for DXA FM (1·7 %).
Notwithstanding, the impact of this propagation of error when tracking BC changes remains unexplored. A worst-case scenario can be assumed, considering independent and additive errors between the two moments. In this scenario, the impact of the propagation error for the present study subjects would be 1·42 kg for criterion 4C, indicating that all athletes in the LSC subgroup exhibited FM changes exceeding this worst-case scenario.
Given the limited research employing the true criterion 4C model to evaluate changes in BC, particularly in athletes, some methodological caveats should be discussed. While the 4C model is a reference method that improves FM estimation by accounting for bone mineral and TBW(Reference Withers, Laforgia and Heymsfield5,Reference Heymsfield, Ebbeling and Zheng23) , it relies on theoretical assumptions regarding minor components. Notably, this model does not consider minor components (e.g. essential lipids) and does not account for glycogen, a carbohydrate storage that can fluctuate rapidly, particularly in athletes(Reference Heymsfield, Ebbeling and Zheng23). Different methods generally provide comparable FM estimates due to their reliance on closely related models and assumptions(Reference Heymsfield, Ebbeling and Zheng23,Reference Wang, Shen, Withers, Heymsfield, Lohman, Wang and Going37) . However, despite their accuracy, these models are subject to uncertainties. Heymsfield et al. (Reference Heymsfield, Ebbeling and Zheng23) previously assessed how variations in model assumptions affected FM estimates in the ‘Reference Man’; however, no research to date has considered the implications of these errors within athletic populations.
Manipulation of carbohydrate intake, including loading strategies, is a significant part of some sports and is crucial for optimising performance(Reference Thomas, Erdman and Burke38). In athletes, glycogen is not only a rapidly changing body reserve but can also exceed the common ‘Reference Man’ value(Reference Murray and Rosenbloom39). For each gram of glycogen, a minimum of 3 g of water is stored with it(Reference Murray and Rosenbloom39), so glycogen supercompensation leads to a significant increase in TBW. This can be detected and quantified by dilution techniques and is likely attributed to a rise in intracellular water(Reference Shiose, Yamada and Motonaga40,Reference Olsson and Saltin41) . Furthermore, pertinent to our rapid 4C model, Shiose et al. (Reference Fields, Goran and McCrory36) presented the first evidence that BIS has adequate sensitivity to detect increases in TBW following carbohydrate loading, particularly under rigorously standardised and controlled measurement conditions. If the water bound to glycogen is accounted for in the TBW, omitting glycogen introduces error only in the dry mass component. In our criterion model, the unaccounted dry portion of glycogen is misattributed to protein, which assumes a density of 1·34 g/cm3, while glycogen’s density is 1·52 g/cm3 (Reference Heymsfield, Ebbeling and Zheng23), hence introducing a bias. Heymsfield et al. (Reference Heymsfield, Ebbeling and Zheng23) reported that adding glycogen to Wang’s 5C model reduced FM% by 0·6 %. In the present sample, this theoretical 6C modelling (which assumes that glycogen accounts for 4·4 % of protein)(Reference Heymsfield, Ebbeling and Zheng23) would give a 0·7 % lower FM%. However, this fixed glycogen:protein ratio is based on fasting-state organ-weighted calculations by Kehayias et al. (Reference Thomas, Erdman and Burke38). Muscle glycogen in athletes, however, widely fluctuates with diet and training(Reference Fields, Higgins and Hunter35), making this constant unreliable in athletic populations.
Furthermore, an explicit term for essential lipids is also missing in current multicompartment models(Reference Heymsfield, Ebbeling and Zheng23). Solvent extraction separates total body lipids into non-essential lipids (TAG, commonly referred to as ‘fat’) and essential lipids (e.g. in the nervous system and the plasma membranes of cells)(Reference Withers, Laforgia and Heymsfield5,Reference Comizio, Pietrobelli and Tan42) . The commonly accepted assumption is that non-TAG lipids contribute only a small fraction of total body lipids and are included with the FFM compartment(Reference Heymsfield, Brown and Ramirez43). In rat carcasses, Comizio et al. reported that essential lipids accounted for 2·8% of BW(Reference Comizio, Pietrobelli and Tan42). The authors are unaware of any available data on human cadavers, but for the ‘Reference Man’, the total FM (13·5 kg) is shown as including 1·5 kg of essential fat (≃ 2·1% BW)(44). If one assumes that the men in this study (n 43; BW = 78·4 kg; FM = 9·9 kg) have a similar quantity of essential fat (1·5 kg), this will represent a substantial proportion of total FM (≃ 15·2 % BW), thereby introducing a large error. Currently, there is no in vivo method for quantifying this compartment. However, this exclusion may lead to misinterpretation of changes, particularly if the proportion of essential lipids changes relative to other components. The only available data in rats(Reference Thomas, Erdman and Burke38) demonstrated that non-TAG lipids accounted for 3·3% of FFM at baseline, falling to 2·9% after 9 weeks of energy restriction alone (non-significant) and to 2·3% when exercise was included (P = 0·01). Further research is needed to determine how dietary and exercise interventions influence this lipid fraction.
Although the novelty of this investigation and the contribution to scientific advances, some limitations should be considered. First, on average, our sample did not lose/gain much FM, with only twenty-five athletes in the LSC group (mostly men, with only five being women). Second, using an older BIS device constitutes an additional limitation, and future research should study the impact of incorporating newer BIS devices in rapid 4C models. More recent BIS devices (e.g. Impedimed SFB7) have shown higher precision in the estimation of TBW than older devices like the Xitron used in the present study(Reference Moon, Tobkin and Roberts45). Future studies using these newer devices may thus minimise errors at the individual level and reduce the error of BIS-derived TBW in rapid 4C models. Third, a theoretical limitation of the error propagation analysis in the rapid 4C using DXA-derived BV concerns the assumption of independence among DXA outputs (FM, LST and BMC). At the pixel level, DXA technology relies on two-component attenuation models, meaning that algorithmic misclassification of tissue creates an intrinsic negative covariance between compartments (as the incorrect classification of a pixel inevitably results in a simultaneous overestimation of one compartment and underestimation of the other). However, manufacturer-specific covariance matrices are proprietary and unavailable. Consequently, we treated the DXA outputs as independent variables in calculating the propagation error. This approach is methodologically defensible for two reasons: (i) the precision estimates (CV) derived from test–retest inherently capture the aggregate variability caused by algorithmic misclassification; and (ii) ignoring this potential negative covariance results in a slightly larger estimated error, thereby providing a conservative upper bound for the precision of the rapid 4C model. Also, regarding the criterion TBW method, while equilibration times can theoretically vary, our 4-h protocol aligns with the predominant practice in athletic research, where 50 of 77 studies use a 3–6-h window(Reference Jesus, Costello and Kondo46). Whether extended equilibration periods enhance the longitudinal validity of rapid 4C models warrants further investigation. Finally, although the sample was small and sex-unbalanced (28 % females), it comprised athletes from tiers 3 (highly trained/national) and 4 (elite/international)(Reference McKay, Stellingwerff and Smith47). It is challenging to recruit this group, especially for studies involving many assessments, for example, a criterion 4C data collection requires many hours for completion. The main strength of this study was the comparison against a true criterion 4C model, using ADP for BV and 2H dilution for TBW, which offered important insights into the accuracy and applicability of these models.
In conclusion, this investigation demonstrates that these rapid 4C models exhibit precision superior or equivalent to DXA alone while offering reduced assessment times and broader accessibility than the criterion 4C. Regarding accuracy for evaluating changes over time, despite acceptable results at the group level, interpretation should be careful at the individual level.
Supplementary material
For supplementary material/s referred to in this article, please visit https://doi.org/10.1017/S0007114526107648
Acknowledgements
The authors express their gratitude to all the participants involved in this study.
This work was supported by the Portuguese Foundation for Science and Technology (grant no. PTDC/DES/69494/2006 and PTDC/DES/098963/2008).
T. R. S.: Conceptualisation, Methodology, Formal Analysis and Writing – Original draft preparation; R. P.: Formal analysis and Writing – Review and Editing; B. M. P. M. O.: Formal analysis and Writing – Review and Editing; D. A. S.: Conceptualisation, Methodology, Recruitment, data collection and analysis, and Writing – Review and Editing; C. N. M.: Conceptualisation, Methodology, Recruitment, data collection and analysis, and Writing – Review and Editing; L. B. S.: Writing – Review and Editing, Supervision and Funding acquisition; V. H. T.: Writing – Review and Editing; S. B. H.: Writing – Review and Editing; A. M. S.: Conceptualisation, Methodology, Writing – Review and Editing, Supervision and Funding Acquisition.
The authors declare that they have no conflict of interest.
Data described in the manuscript will be made available upon reasonable request pending application and approval to analiza@fmh.ulisboa.pt.


 Open access

