





Introduction
Sea ice plays a major role in the Earth System: It greatly increases the albedo of the ice-free open ocean (e.g. Perovich, Reference Perovich1996), it is an important driver of global oceanic circulation through bottom water formation (e.g.Williams and others, Reference Williams, Bindoff, Marsland and Rintoul2008; Oshima and others, Reference Oshima2013), and it acts as a dynamic biogeochemical reactor at the interface between the ocean and the atmosphere (e.g. Tison and others, Reference Tison, Delille, Papadimitriou and Thomas2017a). Sea ice hosts microbial communities throughout the year and actively or passively controls gas, energy and matter exchanges between the ocean and the atmosphere (e.g. Arrigo and Thomas, Reference Arrigo and Thomas2004; Arrigo and others, Reference Arrigo, Mock, Lizotte, Thomas and Dieckmann2010; Dieckmann and Hellmer, Reference Dieckmann, Hellmer, Thomas and Dieckmann2010; Rysgaard and others, Reference Rysgaard2011; Zhou and others, Reference Zhou2013, Reference Zhou2014; Delille and others, Reference Delille2014). It also plays a major ecological role in the polar ocean systems (e.g. Bluhm and others, Reference Bluhm, Gradinger, Schnack-Schiel, Thomas and Dieckmann2010; Leu and others, Reference Leu, Søreide, Hessen, Falk-Petersen and Berge2011; Flores and others, Reference Flores2012).
Major changes are clearly occurring in the Arctic sea-ice system, with an indisputable trend of reduced ice cover, both at minimum and maximum extent (IPCC and others, Reference IPCC2013; IPCC, Reference Po¨rtner, Roberts, Masson-Delmotte, Zhai, Tignor, Poloczanska, Mintenbeck, Alegri´a, Nicolai, Okem, Petzold, Rama and Weyer2019). Antarctica, on the contrary, and in contradiction with global climate model outputs, showed a slight increase in circumpolar averaged extent for most of the last four decades (since satellite observations consistently began in the late 1970s). This circumpolar increase masks large regional contrasts however, with longer sea-ice seasons in the Weddell and Ross Seas and shorter sea-ice seasons in the Bellingshausen-Amundsen Seas and in the Amery Ice Shelf sector (Stammerjohn and others, Reference Stammerjohn, Martinson, Smith, Yuan and Rind2008). There has been however a marked change toward record low circumpolar sea ice since late 2016 (Parkinson, Reference Parkinson2019).
Global biogeochemical models have been developed only relatively recently, and are still in need of fully incorporating the processes at work in sea ice. This is particularly true for winter processes, given the relative scarcity of observations during that period, especially in the Antarctic. A better knowledge of winter sea-ice behavior is however also crucial to yearly budgeting exchange processes between the ocean and the atmosphere in polar regions, and in understanding their trends in a changing climate.
In a recent publication, Tison and others (Reference Tison2017b) presented the physical and biological properties of winter pack ice in the Weddell Sea during the AWECS (Antarctic Winter Climate Ecosystem Study) 2013 cruise. This was the most recent of only three winter sea-ice studies in the Central Weddell Sea (1986, 1992 and 2013). The winter 2013 showed a relatively warm sea-ice cover, due to the combined effect of a deep snow cover and warm cyclone events progressing southward from the open Southern Ocean. This resulted in high ice permeability and frequent formation of ‘brine tubes’ from cyclic events of brine movements within the sea-ice cover and the consequent development of an internal microbial community, evidenced by relatively high Chl-a concentrations. The authors also showed that large-scale sea-ice model simulations suggest a trend of deeper snow, warmer ice and larger brine volume fractions across the three observational years.
In this paper, we present results from the Polynyas, Ice Production and seasonal Evolution in the Ross Sea (PIPERS) cruise, devoted to the space/time evolution of air–ice–ocean interactions during autumn and early winter 2017 in the Ross Sea. The cruise documented a full set of physical and biogeochemical properties of the whole atmosphere–sea-ice–ocean system, with a specific focus on the Terra Nova Bay and Ross Sea Polynyas (TNBP and RSP). Here we will focus on the basic physical and biological properties of the sea-ice cover in the context of a delayed autumn sea-ice advance, in line with the recent decrease in Antarctic sea-ice extent that started late 2016 (Turner and others, Reference Turner2017; Parkinson, Reference Parkinson2019), and see how it might have affected the sea-ice biogeochemistry. Physical data are presented in order to document the specific environmental constrains for the biological components of the ecosystem.
Field work and analytical methods
The PIPERS cruise
The PIPERS cruise sampled the Ross Sea pack ice between 19 April 2017 (Julian Day 109) and 4 June 2017 (Julian Day 155) (Fig. 1, see Ackley and others (Reference Ackley2020) in this volume for an overview of the cruise). A total of 27 biogeochemistry sites were occupied. The aim was to gather a suite of physical and biogeochemical parameters in order to decipher winter sea-ice biogeochemical dynamics and the control it potentially exerts on exchanges across the atmosphere–ice–ocean interfaces. Although the initial goal was to sample both the TNBP and the RSP as well as the main pack, unfortunately biogeochemical stations could not be conducted in the RSP for logistical reasons. It was however possible to document the sea-ice cover of the Western Ross Sea on its southbound leg to Terra Nova Bay (TNB, ice stations 1–5) and the sea-ice cover of the Central Ross Sea (CRS) on its northbound leg from the Ross Sea Polynya (ice stations 18–24). Six main groups of stations will therefore be discussed: the marginal ice zone on the way in (MIZ-in, stations 1–3), the transit to TNBP (Transit TNBP, stations 4 and 5), the TNBP (stations 6–16), the transit to the RSP (Transit RSP, station 17), the CRS (stations 18–25) and the marginal ice zone on the way out (MIZ-out, stations 26–27). Sea-ice sampling was also performed at additional stations for physical properties only. These will only be used briefly here to assess the representativeness of the biogeochemical stations and discussed in detail elsewhere.
Location of the 27 PIPERS biogeochemical stations, and mean ice (black) and snow (grey) thicknesses for the major groups of stations. The global area of investigations is shown as a red rectangle on the Antarctic map of the lower-right insert. The Terra Nova Bay area is enlarged at the black arrow.

Field work
At each of the biogeochemical stations (BGC, stations 1–27), we attempted to collect the full set of physical and biogeochemical parameters. For safety reasons however, especially in the TNBP, with its dynamic ice cover of thin ice pancakes, sampling could only be done from man-basket or zodiac, reducing the sampling time to less than an hour. At those stations, only a limited number of sea-ice samples could be collected, reducing the breadth of variables measured. Otherwise, the sampling procedure was similar to the one applied during the 2013 AWECS cruise in the Weddell Sea (Tison and others, Reference Tison2017b). It is briefly summarized here below.
Once the ice floe had been selected and the ship anchored to it, a trace metal clean biogeochemical 10 × 10 m sampling site was chosen and flagged. Access was only permitted to operators wearing clean suits to prevent contamination (Lannuzel and others, Reference Lannuzel2006). Snow samples were first collected in the central part of the restricted area. Then, a first core was drilled and its vertical temperature profile was measured. The core was then immediately placed into a plastic bag and stored with −30°C cooling bags within a core storage box, to prevent brine drainage and limit microbial activity. The core was later cut into 0.05 m thick sections for bulk ice salinity measurements onboard the ship. A set of 12 supplementary ice cores were collected at a maximum spatial spacing of ~0.20 m to limit the effects of spatial differences. These cores were dedicated to a whole suite of biogeochemical measurements (nutrients, POC, DOC, PON, DON, gases, texture, fabrics, etc.) either on-board the ship or later in the laboratory. Cores were stored and transported below −25°C and in the dark at all times. Most of the cores were retrieved using 0.10 or 0.14 m electropolished stainless steel core barrels. For thin ice stations (below 15–20 cm), cutting of sea-ice blocks was preferred, using a non-contaminating curved hand-saw.
The drill hole of the temperature/salinity core was used to sample sea water at various depths, and brine ‘sackholes’ (incomplete ice core holes reaching a specific depth into sea ice) were drilled to collect the brine. Finally, gas fluxes (CO2, N2O) were measured at the surface of the ice and at the surface of the snow using the ‘chamber’ technique (Tison and others, Reference Tison, Delille, Papadimitriou and Thomas2017a).
Only the basic physical (texture, temperature, bulk ice salinity, brine salinity, brine volume, Rayleigh numbers, brine upward velocities) and biological (Chl-a, Phaeopigments) properties will be discussed in this paper.
Direct measurements
Ice temperature measurements were performed using a calibrated probe (Testo 720). The probe was inserted into holes matching the diameter of the probe, drilled perpendicular to the ice core axis or to the ice block surface, with a depth resolution of 0.02–0.05 m. Precision of the probe was ±0.1°C. As recommended by Pringle and Ingham (Reference Pringle, Ingham and Eicken2009), temperature measurements were completed within 5 min after ice core extraction.
Bulk ice salinity was measured at a depth resolution of 0.02–0.05 cm, on melted ice samples at room temperature, using a portable electrical conductivity meter (Orion Star Series meter WP-84TP, calibrated before and after the cruise). Cores were cut horizontally such that samples were centered on the depths of the discrete temperature measurements. To improve the accuracy of the measurements (<±0.1), the same samples were re-measured in Europe on a Guildline Autosal Salinometer 8400, B calibrated with IAPSO standard sea water (precision better than 0.002 psu). A calibration curve was then established to correct the conductimeter salinities according to salinometer salinities. The latter are used here.
Ice thin sections (~600 μm thick) were produced following the standard procedure of Langway (Reference Langway1958), using a microtome (Leica SM2400). The sections were examined and photographed between crossed polarizers on a universal stage system.
Chl-a and Phaeopigments were measured on a dedicated ice core or ice block, cut at a 0.05–0.10 m vertical resolution. Samples were melted in 0.2 μm filtered sea water (1:4 volume ratio) to avoid osmotic stress, in the dark. Melted samples were size fractionated by filtering on 10 then 0.8 μm polycarbonate filters. This allows differentiation of larger microalgae species from the smaller ones. Filters were analyzed by fluorometry, according to standard protocols (Arar and Collins, Reference Arar and Collins1997).
Species cell counting for ice algae community assemblages was performed at specific stations, at a 10–20 cm resolution, on Lugol-preserved samples. Identification of ice algae was determined following Thomas (Reference Thomas1997) and Scott and Marchant (Reference Scott and Marchant2005). The sample was concentrated using a sedimentation tube. Cell counting was performed using a microscope (Olympus, IMT-2, Tokyo, Japan) with 10× oculars and 40× objective. For each sample, three countings were done, and, for each counting, 100 μL of the sample was placed on a counting plate (50 μm slits). Results are given as average ±1 std dev. (n = 3).
Data processing
Based on ice temperature (T) and bulk ice salinity (S) measurements, a series of descriptors of phase composition and of fluid transport through sea ice were derived.
The phase composition properties, namely brine salinity (S br) and brine mass fraction (Φ), as well as the sea-water freezing point were derived from the T − S data, using the FREZCHEM phase diagram equations (Vancoppenolle and others, Reference Vancoppenolle, Madec, Thomas and McDougall2018), based on the resolution of the Gibbs–Pitzer equations for standard sea water (Marion and others, Reference Marion, Mironenko and Roberts2010). As demonstrated in Vancoppenolle and others (Reference Vancoppenolle, Madec, Thomas and McDougall2018), brine mass fraction and brine volume fraction are quasi-linearly related and differ by a very small amount (<1% absolute difference and <10% of relative difference, in our natural sea-ice range). For coherence with previous studies, we are using the latter. Brine volume fraction controls permeability and therefore the mobility of biogeochemical compounds within sea ice and across its interfaces with the atmosphere and the ocean. For brine in columnar sea ice, it has been shown (Golden and others, Reference Golden, Ackley and Lytle1998; Freitag, Reference Freitag1999; Eicken and others, Reference Eicken, Grenfell, Perovich, Richter-Menge and Frey2004) that permeability increases by at least 1 order of magnitude above a relative brine volume of 5% (Golden and others, Reference Golden, Ackley and Lytle1998). This threshold might be higher for gases in sea ice (7%, Zhou and others, Reference Zhou2013) or for brine in fine grained granular ice (10%, personal communication from Golden, 2016).
The fluid transport properties were calculated on a vertical grid composed of the midpoint of the core sections, and an extra point at the bottom of the ice core, required to have well-posed Rayleigh number and upwelling convective velocity calculations. The calculation nodes are labelled from top to bottom (i = 1, …, N + 1). Observed temperatures were taken from the exact same core when possible (in the majority of the cases), or from the nearest core (typically <10 m distance) taken on the same day and at the sampling station. At the core bottom, S and T were not measured. There, S is assumed to be of 34 g kg−1, representative of surface waters in the area, assuming continuity at the ice–ocean interface (Notz and Worster, Reference Notz and Worster2009). Temperature at the base was considered to be at the freezing point T fr, calculated with a salinity of 34 g kg−1.
The porous-medium Rayleigh number (Ra, Notz and Worster, Reference Notz and Worster2008), is here defined following Rees Jones and Worster (Reference Rees Jones and Worster2014) and Thomas and others (Reference Thomas2020):

where z is the depth counted from the upper sea-ice surface and is positive downward, and h is the sea-ice thickness. S w is the ocean salinity (34 g kg−1, see above) and β = 7.5 × 10⁻⁴ kg g−1 is the saline density coefficient. $\bar{{\rm \Pi }}$ is the effective permeability, taken as the harmonic mean of permeability from between depths z and h. Permeability is computed from the formulation of Freitag (Reference Freitag1999). The formulation of Freitag (Reference Freitag1999) for ice permeability was developed for young sea ice (<30 cm), and a more appropriate formula would be the one of Eicken and others (Reference Eicken, Grenfell, Perovich, Richter-Menge and Frey2004) derived from first-year ice at Barrow. However, we chose to compute permeability using the formulation of Freitag (Reference Freitag1999) for consistency with the calculations of Thomas and others (Reference Thomas2020). g is the acceleration due to gravity, whereas c = 4 × 10⁶ J m−3 K−1, k = 0.523 W m−1 K−1, and ν = 1.8 × 10⁻⁶ m2s−1 are reference values for the volumetric heat capacity, thermal conductivity and kinematic viscosity of brine, respectively.
Ra is often used as a proxy for gravity drainage (i.e. brine convection), which would initiate once Ra surpasses a critical threshold value (Notz and Worster, Reference Notz and Worster2008). This threshold however is still not very well constrained (Notz and Worster, Reference Notz and Worster2009; Hunke and others, Reference Hunke, Notz, Turner and Vancoppenolle2011; Carnat and others, Reference Carnat2013), with values ranging from 2 to 10 and depending on many assumptions in the calculations. The interpretation can therefore still only be qualitative today, especially in the context of discrete measurements in time and space.
Upwelling convective velocity profiles were computed following methods elaborated in Thomas and others (Reference Thomas2020) based on the concepts developed by Wells and others (Reference Wells, Wettlaufer and Orszag2011), Griewank and Notz (Reference Griewank and Notz2013) and Rees Jones and Worster (Reference Rees Jones and Worster2014). The convective upwelling velocity, as introduced by Rees Jones and Worster (Reference Rees Jones and Worster2014), informs on the theoretical intensity of the net salt loss (and of all other solutes). In this calculation, it is implicitly assumed that a convective circulation holds, made of a downwelling flow within infinitely narrow brine channels and an upwelling flow within the rest of porous ice.
The calculated convective upwelling velocity is from a recast version of the parameterization of Griewank and Notz (Reference Griewank and Notz2013):
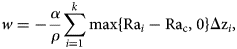
where $\alpha = 6.67\;\times 10^{{-}3}\;\,{\rm kg\ }{\rm m}^{{-}3} {\rm s}^{{-}1}$ is the convection strength parameter, $\varrho _{{\rm br}} = 1020\;\,{\rm kg\ }{\rm m}^{{-}3}$
 is a reference brine density, Rai is the porous-medium Rayleigh number in the i th layer, Rac = 2.4 is a critical Rayleigh number, and Δzi is the thickness of the i th core section. Both α and Rac are parameters, tuned by Thomas and others (Reference Thomas2020) within the exact same calculation framework, as to minimize the difference between simulated and observed salinity and rhodamine in artificially grown sea-ice experiments.
Crystal sizes have been estimated from detailed high-resolution thin-section photographs for the TNBP stations 6–16. At each station, a set of six lines were randomly chosen across the thin section, and individual crystals counted along each line. The length of the line is then divided by the number of crystals counted to give an estimate of individual crystal diameters. This method, referred as the ‘Linear intercept method’, is of course semi-quantitative, due to the irregular shape of the crystals and the fact that they are rarely cross-cut along their mean dimension. Another indicator is also calculated, the ‘equivalent disc area’, which is the area of a circular disk of equivalent diameter.
To describe the peculiar evolution of the sea-ice cover on that year and understand stations locations in this context, Ice margin tracking was reconstructed from high-resolution AMSR2 imagery, using the approach of Beitsch and others (Reference Beitsch, Kaleschke and Kern2014). Daily sea-ice concentration maps were retrieved from the open access server at the Universität Bremen (2018) from January to June 2017. These images were georeferenced and introduced into the Quantarctica GIS (Matsuoka and others, Reference Matsuoka, Skoglund and von Deschwanden2013). Comiso and others (Reference Comiso, Cavalieri and Markus2003) proposed the threshold of 10% sea-ice concentration as the limit between sea ice and open ocean. For readability reasons, we have kept the 10–20% interval to track the temporal evolution of the ice margin within Quantarctica.
Ice margin tracking integrates both dynamic (ice drift) and thermo-dynamic (ice growth) sea-ice processes, and does not allow reconstruction of specific growth history at a given station. To address this, we used backward motion trajectories to retrace the location of each sampled ice floe during PIPERS. Trajectories were calculated using a dataset of AMSR2 maximum cross correlation-derived sea-ice motion vectors (Kimura, Reference Kimura2004). We use the station location of each sampled floe as an end point for the backward trajectory calculation, which is advected with the nearest-neighbor velocity and run for up to 200 d. On occasion, to produce longer trajectories in the case of missing data, we substitute the mean velocity field of up to eight nearest neighbors. Back trajectories were truncated when they came within 60 km of the coastal mask due to coastal contamination of the underlying velocity dataset. Time series of sea-ice divergence/convergence at each station's location was also calculated from the sea-ice motion dataset. The discrete partial derivative of x and y velocities were added together to calculate the divergence, using the four nearest neighbors.
A suite of drifting sea-ice buoys was deployed at ice stations at the outflow of the TNBP and in the CRS on the transit out of the ice. Here, we show tracks for five GPS buoys that were deployed at, or very near to several of the biogeochemistry ice stations and survived for several months. Theses buoys were comprised of a NAL Research Corporation 9602-LP low-power Iridium satellite tracker with built-in GPS that reported position every 30 min. These were enclosed in a waterproof enclosure and fixed to the floe.
Results and discussion
Ice and snow thicknesses, freeboard, ice types and ice growth history
The mean ice thickness at the biogeochemical stations was 0.35 m. It was however biased toward low thicknesses due to the denser sampling in the TNBP (Fig. 1). Maximum ice thicknesses were encountered both in the northern CRS (up to 0.71 m at station 25) and on the Western Ross Sea continental shelf area (transit to TNB, 1.02 and 0.69 m at stations 4 and 5, respectively). Quite low snow thicknesses were observed overall at the biogeochemical stations, with a mean value of 0.04 m (Figs 1 and 2). The highest snow thicknesses (up to 0.15 m) were found on the thicker, older ice of the northern CRS.
Textural properties (ice types) at the 27 PIPERS biogeochemical stations, shown as vertical thin sections visualized under crossed polarizers. Surface properties of ‘dragon skin’, mainly seen at stations 5 and 6, are illustrated. Grey and red numbers on top of each core section are mean snow thickness (ten measurements) and freeboard in centimeters, respectively. Ice core numbering corresponds to the station numbering.

Freeboards (red numbers in Fig. 2) were positive at all stations, with very rare evidence for previous flooding events, although some flooding was observed around ridged areas, not sampled for biogeochemistry. This observation is consistent with the very small amounts of snow ice observed during the cruise, as discussed in more details in a companion paper.
Figure 2 shows a clear textural contrast between the marginal ice zone (MIZ) and the TNBP on the one hand, and the CRS and the continental shelf stations of the Western Ross Sea (transit to TNB) on the other hand. TNBP and the MIZ share a dominant granular ice texture (frazil), while the CRS is predominantly of columnar texture. A distinction can be made in the latter between the stations 18–22, showing decreasing granular ice contribution northwards, and a surprisingly constant thickness over nearly 4 degrees of latitude (70–74°S), and the thicker northerly stations 23–25, showing either a contribution from snow ice (23, 24) or increasing granular ice (25) at the top.
These characteristics of the CRS pack ice agree well with the peculiar sea-ice growth conditions of the autumn 2017. Indeed, Figure 3a shows the sea-ice margin at various dates in March/April 2017 (just before our access to the ice), from high-resolution AMSR2 satellite imagery (see methods). Figure 3b shows sea-ice motion vectors for April–March 1995, from a study of Arrigo and others (Reference Arrigo, Robinson, Dunbar, Leventer and Lizotte2003). Clearly, while the whole of the Ross Sea was already covered with sea ice on 6 April 1995, there is still open water present in the CRS on 8 April 2017 (black line). The area lies just north of Pennel Bank, a shelf break promontory, that protrudes northward of the mean east-west trending shelf break. Reports of very high ocean to ice heat fluxes, up to 35 Wm2, in this area during the cruise (personal communication from T. Maksym), suggest that these might result from obstructions of the westward flowing slope current near the shelf break that may have caused local upwelling of warm Circumpolar Deep Water.
(a) Reconstructed sea-ice margin at various dates in 2017 (red: 8 March; orange: 11 March; green: 20 March; blue: 29 March; black: 8 April and grey: 19 April), from high-resolution AMSR2 satellite imagery (Beitsch and others, Reference Beitsch, Kaleschke and Kern2014; Bremen, 2018); (b) arrows show fields of sea-ice movement for April–March 1995 from Arrigo and others (Reference Arrigo, Robinson, Dunbar, Leventer and Lizotte2003).

The Central Ross Sea
Figure 4, a plot of backward trajectories with divergence/convergence history at each station, together with selected observed (forward) buoy trajectories, on top of the same sea-ice margin evolution as in Figure 3, allows further interpretation of the history of the ice at each station. In the CRS, for stations 18–21, sea ice originates along the outflow of the RSP, at a similar distance from the ice-shelf front. The steadily decreasing lifetime from station 18 to 21 explains why these stations show an initial contribution of frazil accumulation from the RSP of decreasing proportion going north (Fig. 2). Advection of that ice over an area of very high ocean–ice heat fluxes would have retarded further basal growth and maintained a relatively constant ice thickness (~0.4 m).
Calculated back trajectories (blue) and observed buoy trajectories (‘Forward’, green) for some of the 27 PIPERS stations (red dots). Back trajectories are shown with convergent (light blue) and divergent (dark blue) status. Each blue or green dot corresponds to a daily position, allowing semi-quantitative visual reconstruction of the velocity. Red crosses indicate the origin of the ice sampled at a given station (station number recalled in white in Central Ross Sea). Black dots indicate days where there was not enough data to calculate an 11 d-centered moving average for divergence/convergence due to low ice concentrations – ‘*’ in the left table indicate stations for which back trajectories could not be fully reconstructed due to the proximity of the coast at early stages of growth (coastal contamination of the sea-ice velocity dataset). Light and dark green are used to decipher overlapping buoys trajectories. Some of the buoys were laid on the sea-ice cover at the biogeochemistry stations, others at locations nearby. Ice shelves are overlaid on the coastline in cyan (Rignot and others, Reference Rignot, Jacobs, Mouginot and Scheuchl2013; Greene and others, Reference Greene, Gwyther and Blankenship2017; Mouginot and others, Reference Mouginot, Scheuchl and Rignot2017). Periodic sea-ice extents are indicated by filled greyscale contours (Spreen and others, Reference Spreen, Kaleschke and Heygster2008).
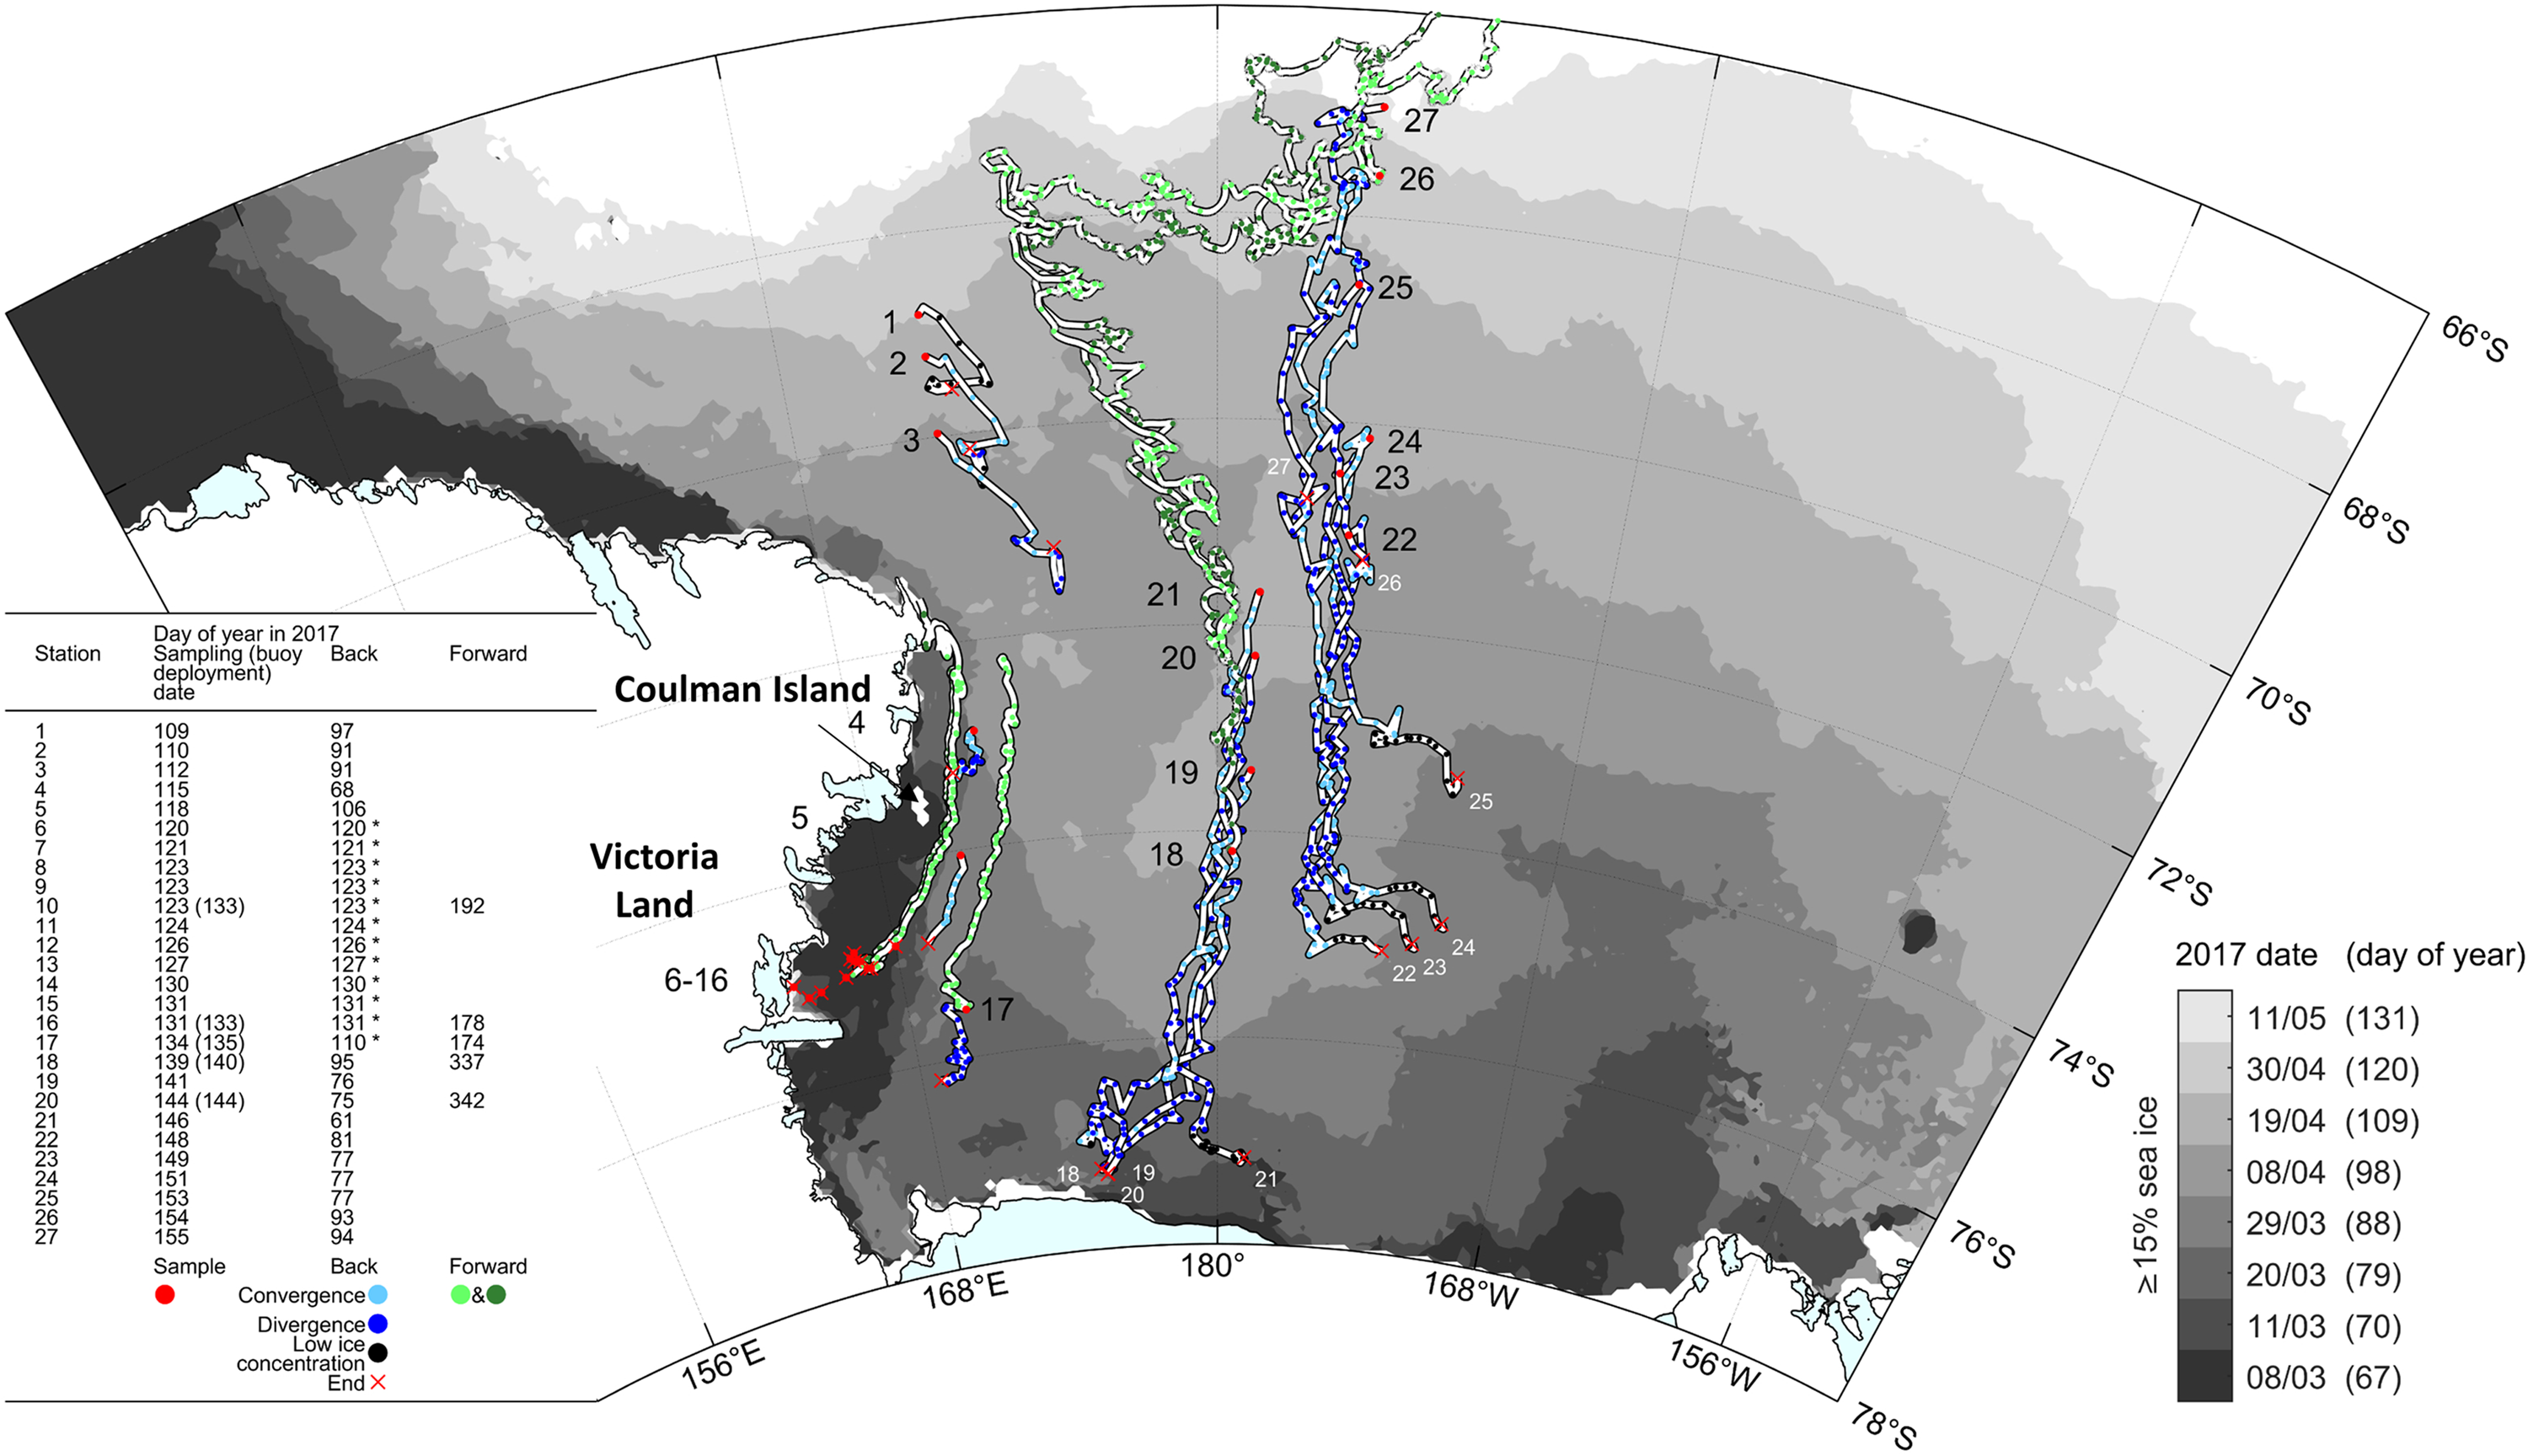
Over that part of the cruise track, the sea-ice cover was very uniform, with few indications of dynamical thickening. This is consistent with the predominance of divergent flow conditions (i.e. unfavorable conditions for ridging or rafting, dark blue dots, Fig. 4). The same holds for the ice cover at station 17, situated in the outflow of the McMurdo Sound polynya. The ice cover at stations 22–24 originated further to the north and shows a lower (and relatively constant) frazil/granular ice layer at the top. Their trajectory is also located East of the remnant open water area (that was initially observed in the CRS; cf. Figs 3 and 4), suggesting that the ice cover might have been somewhat more removed from the high oceanic heat flux (that was assumed to have been present in the remnant open water area), and therefore show a larger ice thickness for a similar initial growth date. It is indeed interesting to note that stations 23–25 all initiated growth within a very short time window (around year day 77), illustrating the very fast growth that eventually occurred in the remnant open water area. Sea ice at station 25 formed in a period of fast marginal expansion, fully outside the Ross Sea embayment, which might explain the larger proportion of frazil/granular ice in the upper section of the cores (Fig. 2).
Overall, the forward buoys trajectories shown in Figure 4 clearly indicate that, around mid-August 2017 (about day 225, when buoys launched at stations 18 and 20 take a sharp turn East), a general pattern of eastward circulation was initiated, as the sea-ice cover was caught up into the ACC (Antarctic Circumpolar Current). This is similar to what has been previously described for the outer Ross Sea, although it was then happening much earlier on in the year (mid-May) (e.g. Arrigo and others (Reference Arrigo, Robinson, Dunbar, Leventer and Lizotte2003), their Figure 4).
The Terra Nova Bay Polynya
Details of the textural properties of the TNBP stations are shown in Figure 5. A clear grain size contrast exists between stations 6, B1 to B3, 16 and 13 showing larger grain sizes (1.7–2.97 mm2) and stations 8–11 with smaller grain sizes (0.50–0.92 mm2). Stations 7, 14 and 15 show intermediary values (1.19–1.38 mm2). The spatial arrangement of these grain size contrasts is not random as these differences roughly correspond with backscatter banding in satellite synthetic aperture radar (SAR) imagery (Fig. 5). We suggest that smaller grain sizes correspond to very fast ice growth during strong katabatic wind episodes (three of these occurred between sampling of stations 7 and 8, 11 and 12 and 13 and 14), while larger grains denote quieter times, allowing further crystal growth in the surface water, before aggregation as pancakes. Thin pancakes (a few centimeters) formed during the quieter phases of sampling indeed show larger grain sizes, often with elongated disk-like shapes (not shown, but similar to those seen at stations 26–27 in Fig. 2). Figure 6 proposes a schematic of the process of this ‘banding’ buildup, following successive episodes of katabatic winds. This is supported by the SAR imagery, with brighter bands, indicative of rougher ice formed from the original outflow of an ice plume during a katabatic event, having typically finer grained ice, while the coarser grained ice formed in the darker, more quiescent bands that subsequently formed behind the lighter bands. Dragon skin ice (see above, and Worby and others (Reference Worby, Massom, Allison, Lytle, Heil and Jeffries1998) for full description) has mainly been observed at the outer margin of the polynya, where it accumulates and meets drifting coastal sea ice from the South, but it has also occasionally been seen within the polynya itself.
Close up of textural properties of PIPERS Terra Nova Bay polynya biogeochemical stations 6–16. All pictures are illustrative vertical thin sections viewed under crossed polarizers, at the same scale. Numbers in the top left corner of each picture are respectively ‘mean grain diameter’ (top) and ‘equivalent disk area’. The ‘mean grain diameter’ is obtained by the ‘linear intercept method’ and the ‘equivalent disk surface’ is the surface of a circular grain of equivalent diameter (see methods). Red stars are locations of biogeochemical stations and green stars are locations of complementary physics stations. No data are available for station 12. Satellite image is Terra SAR-X from DLR (German Aerospace Centre).

Schematic showing the proposed mechanism generating crystal size and textural banding in the Terra Nova Bay polynya, as a result of the alternation of periods of high katabatic winds and quieter conditions.

Apparently, as shown by the forward buoys trajectories in Figure 4, the ice from the TNBP (buoys from stations 10 and 16) appears to join the pack ice originating from further south (i.e. the McMurdo Sound area – buoy from station 17) and to be pushed further northward along the Victoria Land Coast past Coulman island, at least until midwinter (end of tracks on Julian Day 177–192, i.e. 26 June–11 July). Nonetheless, the TNB sea ice does not seem to contribute significantly to the pack ice in the CRS, given that its trajectory remains close to the Victoria Land Coast. This might also explain the difficulties the N.B. Palmer had during its southbound leg into TNB, it was basically traversing this coastal convergent flow.
The Western Ross Sea
The western shelf sea-ice stations 4 and 5 both show peculiar textures (Fig. 2), but of potentially different origin. Station 4 remained in nearly the same position for a month and a half (Fig. 4), and shows clear signs of rafting processes (Fig. 2, also confirmed with the bulk ice salinity profiles, see below), with recurrent alternation between granular and columnar ice, oblique crystal elongations and ice type boundaries. These dynamical features could be expected in a more coastal area where locally formed land-fast sea ice meets granular pack ice drifting northwards. Station 5 is fully granular, but with large crystal size changes, oblique layering in the granular ice (only apparent in the bottom 0.70–0.90 m in Fig. 2, but present nearly everywhere) and oblique growth of bottom columnar ice. This also suggests an important dynamical component to ice thickening, confirmed by the large-scale ‘dragon skin’ characteristic of the sea-ice surface in that area (both at stations 5 and 6, see picture insert in lower left part of Fig. 2). We propose that these specific dynamical features result from the convergence of pancake ice pushed out from TNB by katabatic-driven winds, joined with coastal pancake ice drifting northwards from the southern McMurdo Sound area. Clearly, the history of stations 4 and 5 is one of convergent flow (light blue dots in Fig. 4).
Ice thermohaline properties
Profiles of ice temperature, bulk ice salinity, brine volume fraction, Rayleigh numbers and brine upwards velocities are presented in Figures 7–11, respectively. All profiles are shown for each group, and the profiles specific to the group enhanced with color dots.
Temperature profiles at the 27 PIPERS biogeochemical stations. Profiles for all cores are shown in each panel as thin black lines. Profiles for the cores within each indicated group are shown as color dots.

Bulk ice salinity profiles at the 27 PIPERS biogeochemical stations. Profiles for all cores are shown in each panel as thin black lines. Profiles for the cores within each indicated group are shown as color dots.

Brine volume fraction profiles at the 27 PIPERS biogeochemical stations. Profiles for all cores are shown in each panel as thin black lines. Profiles for the cores within each indicated group are shown as color dots.
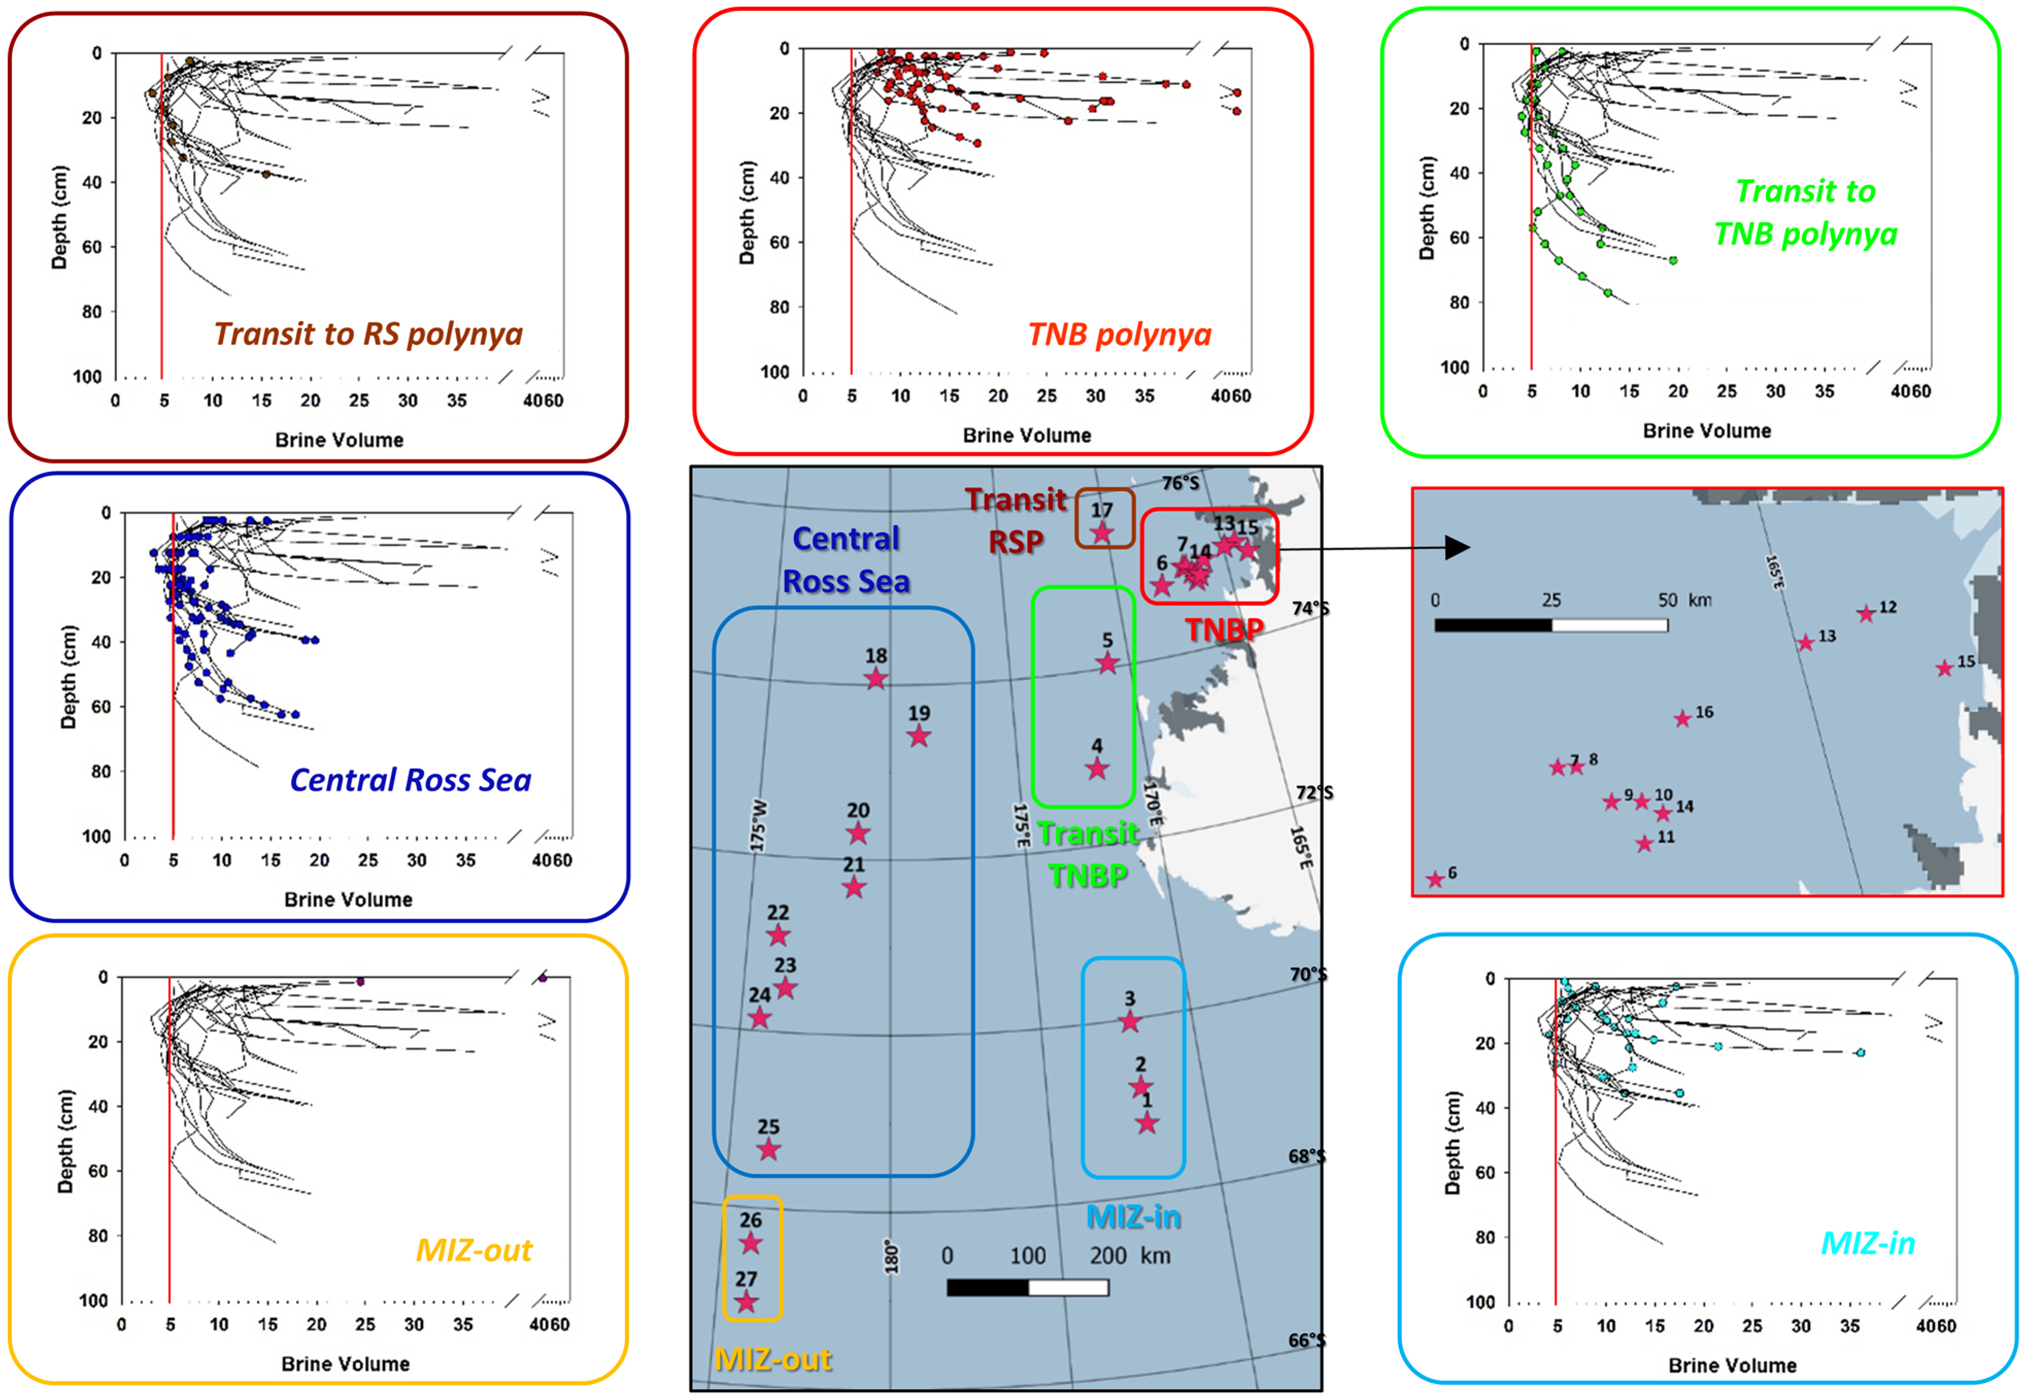
Rayleigh number profiles at the 27 PIPERS biogeochemical stations. Profiles for all cores are shown in each panel as thin black lines. Profiles for the cores within each indicated group are shown as color dots. Red line shows conservative Ra threshold=10.

Brine upward velocity profiles at the 27 PIPERS biogeochemical stations. Profiles for all cores are shown in each panel as thin black lines. Profiles for the cores within each indicated group are shown as color dots.

All temperatures display near-equilibrium profiles, monotonically increasing downwards (Fig. 7), to the exception of surface samples, adjusting to air temperatures at the time of sampling. The southernmost station (17, −17°C) shows the coldest profile, and some of the TNB stations show colder surface temperatures (−12 to −13°C).
The remaining of the stations show a surface temperature hovering between −8 and −10°C. Warmer surface temperatures occur in the MIZ.
Salinity profiles (Fig. 8) generally show a ‘classical’ C-shape (growing ice), with the exception of some MIZ and TNBP stations (a few) and the western shelf stations, in Transit TNBP. The MIZ stations show a clear transition from isohaline (station 1) to C-shaped profiles (stations 2 and 3), as thickness increases. Both stations 4 and 5 show a vertically ‘jagged’ profile, consistent with their dynamic origin (rafting and dragon skin process, see above). The mean salinity profile is higher in the MIZ and the TNBP than in the CRS and Transit TNBP and RSP (less mature brine drainage processes in these young ice stations).
All brine volume fractions (Fig. 9) are above the permeability threshold of 5% in the TNBP and in the MIZ, with the exception of the more southerly station 3 that already shows impermeable layers at mid-depth. Impermeable layers at mid-depth are a common feature at both the CRS stations and the transit stations. Station 25 is however slightly above the permeability threshold at all depths, probably due to its slightly younger age.
Rayleigh numbers are shown in Figure 10. They generally reflect the age and maturity of the sea-ice cover. The younger ice, such as the one in the TNBP and at the MIZ, shows record values (maximum close to 200, a record for sea ice in the existing literature), mostly at or far way above the conservative critical value of 10, above which convection is expected to occur. In the more mature ice of the CRS or the Transit RSP, only the very bottom value, the few centimeters where the ice might still be actively growing, is above 10. Note the contrast for the transit stations to the TNBP, where station 5 is fully convective, while station 4 is entirely below the threshold.
An illustrative way to show the potential impact of brine overturning that avoids the uncertainty in the value of the critical Rayleigh number above which convection occurs is to examine the theoretical upwards brine velocities derived from the mushy layer theory (Thomas and others (Reference Thomas2020), see methods). These are plotted in Figure 11 for the PIPERS stations. They clearly provide a more gradual view of the efficiency of the overturning in the brine system, with low values overall (approximately below maximum 2.10−5 m s−1, i.e. ~7 cm h−1) in the CRS vs values up to more than five times higher in the TNBP. A good illustration of the interest of plotting vertical brine velocities is the enhanced contrast between the profiles of the CRS and those of the western transit stations to the TNBP (stations 4 and 5), where the slightly higher Rayleigh numbers correspond to considerably higher brine upwards velocities. These contrasts between the two approaches have a clear significance for sea-ice biogeochemistry, nutrient transport and spatial variability.
Figure 12c illustrates the relationship between the vertically averaged Rayleigh numbers (Ra, Eqn (1)) and the vertically averaged upwards brine velocities (w, Eqn (2)). A strict relationship exists up to about Ra = 5, after which considerably higher brine velocities occur for a slightly higher Ra value, suggesting that Ra = 10 maybe a rather ‘conservative’ threshold for Rac. Figures 12a and b show the general direct/indirect relationships of w to mean bulk ice salinity (S)/mean ice temperature (T), respectively.
Upwards brine velocities (w) vs (a) bulk ice salinity (S), (b) bulk ice temperature (T) and (c) bulk ice Rayleigh number (Ra) for all 27 PIPERS stations. Each data point is a mean vertical value for the considered variables for a given ice core, at a given location.

Algal standing stocks (Chl-a), size distribution, species and health state
Figure 13 shows Chl-a concentration in green (μg L−1), which can be used as a proxy of algal standing stocks. Sea-water values (indicated at the bottom of each graph) are very low at all stations (0.02–0.2 μg L−1), the maximum being observed at one of the polynya stations (station 9).
Chl-a and Phaeopigments profiles at the 27 PIPERS biogeochemical stations. Chl-a is shown in green, with light green for the small algae (0.8–10 μm) and dark green for the large algae (>10 μm). The Phaeopigments/Chl-a ratios are shown in red. Sea-water values (sw), when available, are also indicated at the bottom of each graph.

In the ice of the MIZ, Chl-a values become significant (above 1 μg L−1, commonly referred to as a ‘bloom’ threshold in the ocean water) and the community switches from internal communities (station 1) to bottom communities (stations 2 and 3) as the ice thickens and ages. The ice is also dominated by large organisms (dark green in the profiles), a common feature for a ‘well-established’ sea-ice community in unflooded sea ice (e.g. Carnat and others, Reference Carnat2014; Carnat and others, Reference Carnat2016; Tison and others, Reference Tison2017b). A similar evolution is seen for the ice in the TNBP. Starting from an internal community with low Chl-a concentrations (≤1 μg L−1), the ice cover then develops a bottom community with an increasing concentration toward the margin of the polynya (stations 6 and 7, showing continuity with older stations 4 and 5, to the north, showing the highest concentrations encountered during the cruise). This is also the typical signature of the southern CRS stations (18–22), as the ice sourced from the RSP quickly advects into the area of delayed freezing (Figs 3 and 4). The thicker northern CRS stations (23–25) similarly show a low Chl-a (1–2 μg L−1) internal community, with the exception of larger concentrations observed at station 23.
A major contrast, however, between the Central and the Western Ross Sea stations is in the algal size distribution. While the western shelf stations are dominated by large size algae (>10 μm), the CRS stations generally show a larger proportion of small size algae (0.8–10 μm), to the exception of a few bottom layers. In a recent study, De Jong and others (Reference DeJong2017) describe that Phaeocystis antarctica and diatoms are the two major phytoplankton groups in the Ross Sea sea water, with Phaeocystis blooms occurring in the CRS in the summer, followed by diatom blooms later in the season in the Western Ross Sea Sector. Arrigo and others (Reference Arrigo2000) and Arrigo and Van Dijken (Reference Arrigo and Van Dijken2004) also previously observed blooms of P. antarctica in the unstratified waters north of the Ross Ice Shelf in the Spring (October to mid-December), followed by diatom blooms later in the year (December–January), in association with the highly stratified surface waters of the western shelf, including TNB. Close to our study cruise track, Garrison and others (Reference Garrison2005) compare sympagic (sea ice) communities in the Ross Sea during the Nathaniel B. Palmer (US) autumn-winter cruise (‘NBP 98-3’, same season as PIPERS ‘NBP17-04’) and summer NBP99-01 cruise. Similar to our observations, during their autumn-winter cruise, most of the biomass was found within ice floes as interior and bottom layer communities. During summer, surface-layer slush communities occurred throughout the ice-covered regions. The authors state that, although the biomass was highly variable throughout the study region during both cruises, diatoms dominated the internal and bottom autotrophic biomass. This was also true in terms of mean cell abundance (Diatoms: 2.4 106 cells L−1 in autumn and 2.7 106 cells L−1 in summer; Phaeocystis: 2.6 105 cells L−1 in autumn and 2.3 105 cells L−1 in summer). The summer surface communities were however dominated by Phaeocystis, Pyramimonas and Gymnodium.
Given that diatoms and Phaeocystis can be considered as the two major phytoplankton groups in the Ross Sea, and given their large size difference, we can surmise, as a first approximation, that our large size class is dominated by diatoms, while Phaeocystis might significantly contribute to the small size class. Following that rationale, we see that our CRS stations in 2017 show a different picture from the year 1998, both sampled at nearly the same period (NBP 98-3 covered Julian days 129–162 while PIPERS covered Julian days 109–155). Instead of being dominated by large size algae (presumably diatoms), small sizes are the rule (presumably Phaeocystis). This specificity can be related to the peculiar sea-ice growth history in 2017, as discussed above. The delayed but then very fast ice cover progression between 29 March and 8 April (blue line to black line in Fig. 3) likely resulted in entrapment of small size algae from the sea water within the growing columnar ice (presumably Phaeocystis present in surface waters of the CRS), with not enough time available or no suitable conditions for the transition toward a larger size diatoms community before the permeability closes-off, to the exception of the more permeable bottom layers (e.g. below 0.40 m at stations 22–24, Fig. 13). It has indeed been shown recently, in an Arctic case of algal colonization of young Arctic sea ice in the Spring, that there is a progressive shift from a ciliate, flagellate and dinoflagellate ‘sea-water inherited’ community (biomass fluctuating between 3 and 42 mg C m−3) toward a pennate diatoms community (biomass steadily increasing from 0 to >500 mg C m−3) in ~2 or 3 weeks (Kauko and others, Reference Kauko2018, their Figure 5). This suggests that the delayed but fast sea-ice growth resulted in a shift of algal speciation in the CRS in 2017, as compared to 1998.
To test this hypothesis further, we have performed cell abundance counts at three contrasted PIPERS stations: station 3 for the MIZ (unfortunately, only the bottom ice was available), station 4 for the Western Ross Sea and station 23 for the CRS (Table 1, Fig. 14). Clearly, Phaeocystis is the more abundant in all layers, with the exception of the bottom of stations 3 and 23, supporting our interpretation. However, this dataset also underlines the limitations of our working hypothesis. Indeed, station 4 showing overwhelming large size fractions Chl-a (Fig. 13) is actually dominated by Phaeocystis cells. Conversion of cell abundance to Chl-a concentrations is not trivial. Indeed, Chl-a cell quotas for a given species largely depend on environmental factors (temperature, salinity, light conditions) and individual sizes. This is especially true for diatoms, less for Phaeocystis. However, using an upper bound value of the Chl-a cell quota of 1.68 pg Chl-a cell−1 for polar Phaeocystis in the literature (Baumann and others, Reference Baumann, Lancelot, Brandini, Sakshaug and John1994; Schoemann and others, Reference Schoemann, Becquevort, Stefels, Rousseau and Lancelot2005), conversion of cell number in the 0.2–0.4 m interval at station 23 gives 2.5 μg Chl-a L−1, a value reasonably close to the observed value of 2.41 μg Chl-a L−1, given the uncertainties. Therefore, using the same cell quota to convert our Phaeocystis cell counts at station 4 into Chl-a concentrations, we obtain estimates for 0.8–10 μm Chl-a concentrations on the average four times higher, and maximum ten times higher than observations. This suggests that some of the Phaeocystis cells could have been in the colonial form, and therefore be collected as part of the large size cells (>10 μm). Preservation in Lugol for several months before cell abundance counting might have deconstructed most of these colonies. Another potential explanation of the discrepancies at station 4 is that the size of the diatom cells was there on the high side, therefore boosting the Chl-a concentration of the large size cells. The rafted nature of station 4 could have easily brought large size diatoms, initially at the bottom, further up in the ice cover. On the contrary, diatoms in the internal layers of unrafted station 23, incorporated during fast columnar ice growth, might have remained on the low size side. A first semi-quantitative estimate partly supports this hypothesis, with diatoms sizes ranging 58–120 μm × 4–65 μm at station 4 and 20–25 μm × 4 μm at station 23.
Cell abundance (cells mL−1) for selected PIPERS stations

Profiles of cell abundance for selected PIPERS stations. Diatoms have been grouped for clarity. Full dataset is presented in Table 1. Only bottom sample was available at station 3.

As shown in Figure 15 and consistent with the associated single-cell biomass of the two phytoplankton groups, the late sea-ice growth in 2017 resulted in a generally lower Chl-a burden than in 1998 for the same period. Dejong and others (Reference DeJong2017, Reference DeJong, Dunbar and Lyons2018) have recently looked at late-summer frazil ice-associated algal blooms around Antarctica using daily MODIS visible spectral band satellite imagery. They produced a map of the percent of years between 2003 and 2017, where polynyas around Antarctica in March appear green from high photosynthetic productivity on the satellite images. TNB (greenest hot spot in the whole dataset) and the RSP were blooming between 61 and 100% of the time for the months and period considered. The authors suggest that the heavy frazil ice production in the polynyas enhances convective processes and deepens the mixed layer so that nutrients are efficiently delivered to the surface water, favoring surface photosynthesis, as long as light is available. De Jong and others (Reference DeJong2017) surmise that this sustained polynya production is quickly exported below 200 m depth in the Polynya itself. This planktonic material could nevertheless be the seeding source for the ice exported from the polynyas. We however could not find any significant Chl-a accumulation in the top granular ice of the cores from the TNBP or from the southernmost CRS stations (<1 μg L−1, Fig. 13) that would have been inherited from potentially sustained production in the source polynyas earlier in the year. Satellite imagery of the TNBP in 2017 indicated clear discoloration prior to our arrival on site (personal communication from Jan Lieser), but nothing could be detected from the ship's deck during our stay. The higher Chl-a levels observed at stations 4–7 could however be partly inherited from earlier production in TNB, given the specific sea-ice dynamics in the area, as described above.
Compared Chl-a burden (mg m−2) between the PIPERS 2017 cruise (red dots) and the NBP 98-3 cruise (green dots) as a function of position. The two cruises occurred at a similar period (April–June), but the PIPERS cruise spent more time in the Terra Nova Bay polynya, therefore under-sampling the Ross Sea Polynya.

Finally, as already shown for the winter sea ice from the Weddell Sea (Tison and others, Reference Tison2017b), sea-ice Phaeopigments/Chl-a ratios are very different from those in the sea water below (Fig. 13). While sea-water Phaeopigments concentrations are generally 2–3 times higher than Chl-a concentrations (with very low concentrations for both), in sea ice this ratio generally remains much lower. As discussed in Tison and others (Reference Tison2017b), the Phaeopigments/Chl-a ratio can be interpreted in terms of algal community health (proportion of living cells vs dead cells) and active growth. Several examples from the Arctic and the Antarctic (Mock and others, Reference Mock, Meiners and Giesenhagen1997; Mock and Gradinger, Reference Mock and Gradinger1999; Krembs and others, Reference Krembs, Eicken and Deming2011; Arrigo and others, Reference Arrigo, Brown and Mills2014; Zhou and others, Reference Zhou2014) show that Spring/early Summer sea ice, with active primary production, is characterized by low Phaeopigments/Chl-a ratios which then increases steadily as ice ages and decays. The same should be true for active autumnal sympagic communities, therefore implying that most of our PIPERS stations are ‘healthy’ and possibly actively growing. The main exception is the bottom ice of station 23 with ratios equal or higher than sea-water values.
Ross Sea vs Weddell Sea
In this section, we will place our PIPERS dataset in perspective, comparing it to recent winter pack ice observations in the Weddell Sea (The AWECS cruise (Tison and others, Reference Tison2017b)). The AWECS cruise took place in June–August 2013, or mid-late winter, while PIPERS took place a few months earlier during the autumn freeze-up. It is nevertheless worth the comparison, given the scarcity of data from these seasons.
Figure 16 compares physical and biological properties during the AWECS (blue) and PIPERS (red) winter cruises. To enlarge the statistical validity of our approach, we have also considered ice thickness, snow thickness and freeboard datasets that were, for both cruises, collected by dedicated ice physics teams. These are usually transects of 50–100 m sampled at a 1 m spatial resolution. Transects are chosen to be representative of the various ice types found at a given station, while the biogeochemical stations are usually biased toward thinner level ice.
Comparison of physical and biological properties during winter cruises AWECS (Weddell Sea, June–August 2013, blue symbols, A) and PIPERS (Ross Sea, April–June 2017, red symbols, P): ice thickness at physics transects (a) and BGC stations (b); snow thickness at physics transects (c) and BGC stations (d); freeboard at physics transects (e); temperature (f), salinity (g), relative brine volume (h) and Rayleigh number (i) at BGC stations; ice Chl-a (k) and Phaeopigments/Chl-a (l) at BGC stations; water Chl-a (m) and Phaeopigments/Chl-a (n) at BGC stations. Map of physics transects (green dots) and BGC locations (red stars) (o). Relationship between Chl-a burden and ice thickness at BGC stations (j). See text for details.
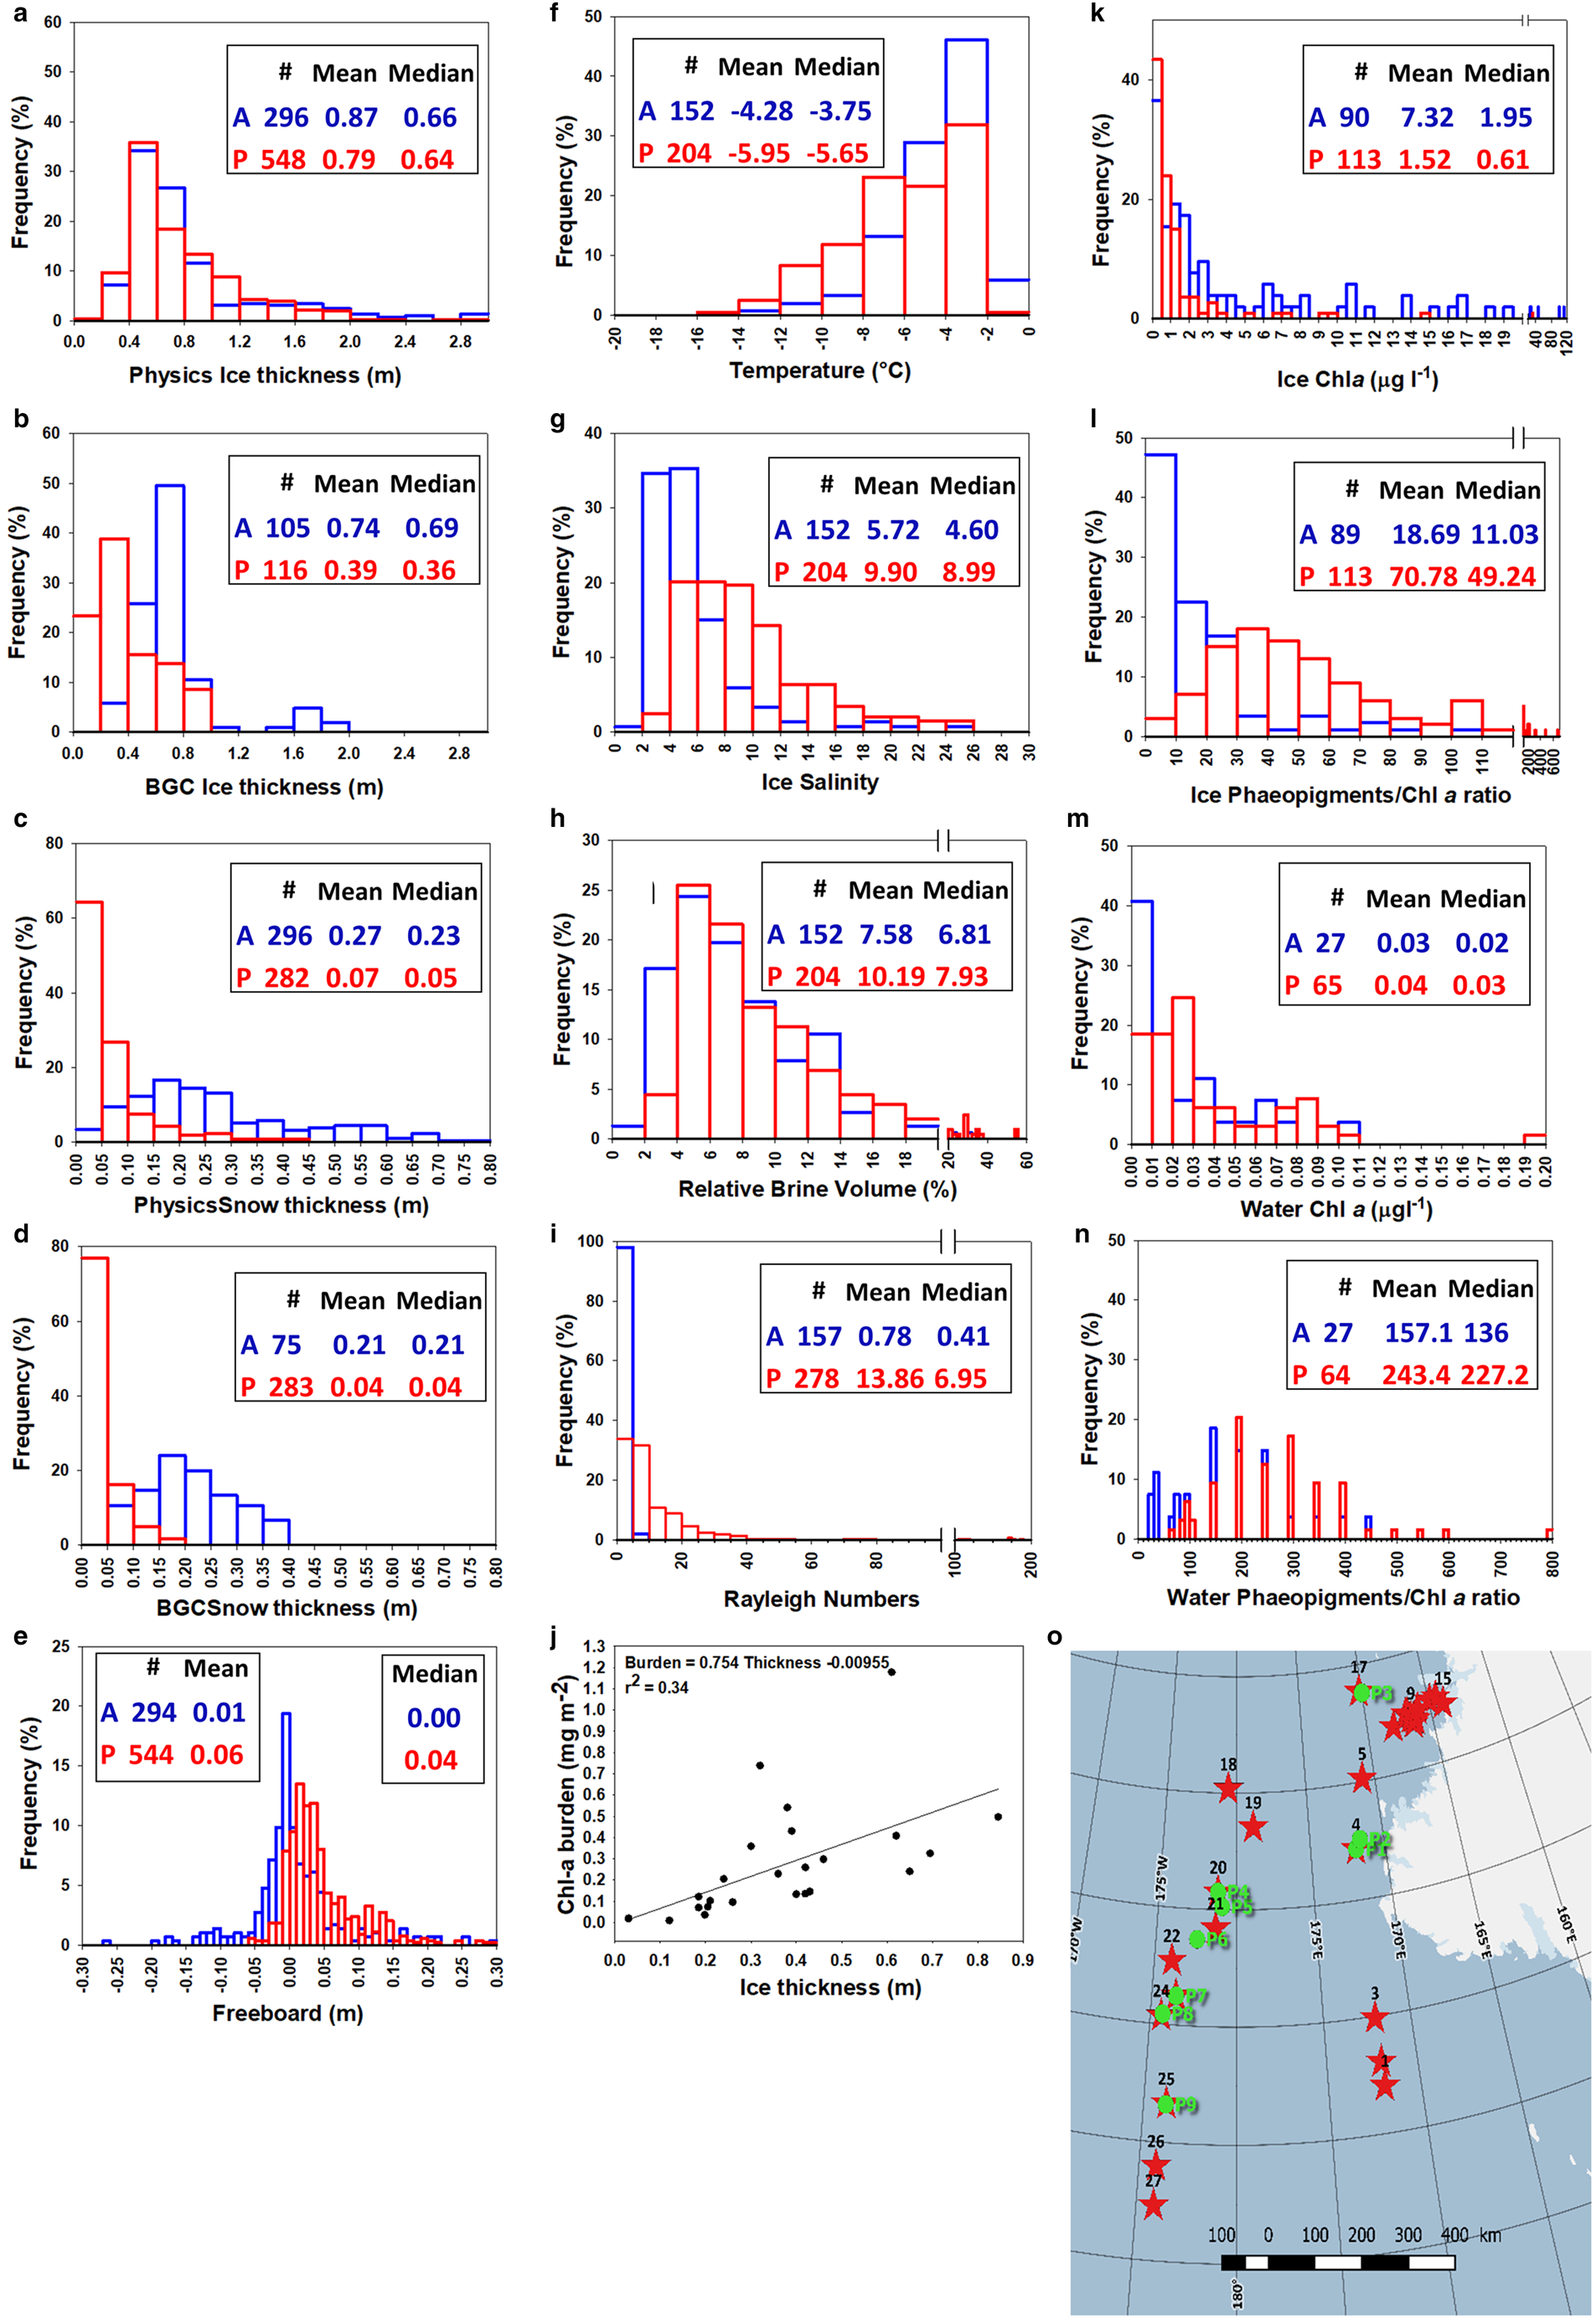
During the AWECS cruise, the distribution of the BGC ice thicknesses (Fig. 16b) was similar to that sampled along the physics transects (Fig. 16a, blue bars). This was clearly not the case for the PIPERS BGC stations where the ice was generally thinner and level compared to the physics transects which were designed to cross deformed ice (mean of 0.38 vs 0.79 m, respectively, Figs 16a and b, red bars). This is easily understood, when looking at the respective locations of the BGC and the physics transects sections (Fig. 16o). Only one out of nine physics transects locations was performed at the margin of the TNBP, while 11 out of 27 BGC stations were located within the thin ice of the polynya. Snow thicknesses at BGC stations were generally consistent with the physics transects during both cruises (Figs 16c and d). Although not apparent in the frequency distributions, the mean and median snow thicknesses at PIPERS however suggest a bias toward thinner snow at the BGC stations, due to the higher proportion of snow-depleted polynya stations.
No significant difference exists in overall ice thickness distribution between AWECS and PIPERS (Fig. 16a). There are however differences in terms of ice texture, ice types and their spatial distribution. Granular ice dominates the Weddell Sea ice samples, due to the combination of the pancake cycle in the region (frazil ice and rafting) with the greater occurrence of snow ice (present at nearly all stations, with thicknesses between a few and 0.40 m (Tison and others, Reference Tison2017b, their Fig. 5)). This is consistent with seasonal differences in snow ice formation (Jeffries and others, Reference Jeffries, Krouse, Hurst-Cushing and Maksym2001). Columnar ice was dominant at only one AWECS near-coastal station close to the Antarctic Peninsula. In the Ross Sea, during our 2017 cruise, granular frazil ice dominates the ice cover in the polynyas and downstream of it, and in the MIZ. The CRS, on the contrary, has columnar ice as the principal component. Snow ice was only present in some of the CRS samples and in the MIZ, with a thickness between 0.05 and 0.40 m (a more detailed study of the snow ice dynamics at PIPERS is beyond the scope of this paper and will be presented elsewhere).
Mean snow thickness is clearly lower at PIPERS stations (mean of 0.07 vs 0.27 m at AWECS, Fig. 16c), resulting in a freeboard distribution shifted toward positive values (Fig. 16e) and scarce observations of flooding. Brine tubes, thought to result from the combination of flooding and frequent alternation of warm and cold spells (Tison and others, Reference Tison2017b), were observed regularly during AWECS, while not seen at all during PIPERS. Despite a temperature distribution skewed toward lower values (Fig. 16f), higher bulk ice salinities (especially in the TNB and MIZ areas) resulted in higher mean and median relative brine volumes at PIPERS (Figs 16g and h). Note, however, that, for both cruises, a minority of brine volumes were below the 5% permeability threshold. PIPERS stations are clearly more convective than AWECS, as shown by the comparison of the Rayleigh numbers in Figure 16i, but it should however be remembered that the PIPERS distribution is somewhat biased toward thin, young ice in the TNBP.
With similar values observed in the water for the two cruises (Fig. 16m), mean/median Chl-a concentrations in the ice are 5–3 times lower at PIPERS, with a narrower distribution (Fig. 16k). Although in both cruises ice (Fig. 16l) appears much more biologically ‘healthier’ than water (Fig. 16n), PIPERS stations are shifted toward more ‘mature’ (larger proportion of dead cells vs living cells) ice and water Phaeopigments/Chl-a ratios (Figs 16l and n respectively).
The comparison above is clearly affected by important sampling spatio-temporal differences between the two studies: (a) PIPERS stations are spanning a more southerly latitudinal range (67–76°S vs 60–71°S at AWECS), potentially implying colder conditions and lesser influence from synoptic conditions (snow precipitations and warmer temperatures) and (b) PIPERS cruise occurred earlier in the winter. The lower Chl-a concentrations at PIPERS could result from the fact that the ice is younger and thinner because of (a) the bias from over-representation of polynya samples and/or (b) the earlier time of the year. Figure 16j shows a moderate correlation between ice thickness and Chl-a burden for our PIPERS stations. However, if we trust this correlation and move our mean BGC ice thickness (0.39 m) toward the physics stations mean ice thickness (0.79 m), to take our polynya bias into account, it would only increase the burden by 0.301 mg m−2, with a rather insignificant corresponding increase of Chl-a concentration of 0.012 μg l−1. Autumnal growth, as opposed to winter, should favor higher Chl-a at PIPERS (autumnal blooms) although this might be counterbalanced by the more southerly location of the PIPERS stations. Clearly, the polynya blooms detected in March 2017 (in satellite data) had disappeared by the time of our arrival in the TNBP (April–May 2017).
A significant factor influencing the spatio-temporal differences discussed above is the observation that the Ross Sea ice growth was delayed in 2017 (Parkinson, Reference Parkinson2019), resulting in thinner ice and lower Chl-a concentration compared to the NBP98-3 cruise, within the same time window. This is part of a recent trend in the Ross Sea pack ice cycle. For the last decades, both the Weddell and the Ross Sea were characterized by a longer ice season (earlier growth and later decay (Stammerjohn and others, Reference Stammerjohn, Martinson, Smith, Yuan and Rind2008)). As suggested by Tison and others (Reference Tison2017b), this longer ice season in the Weddell Sea would have resulted in thicker, more concentrated ice and sufficient increase in snow depth to warm the ice, increased flooding, brine tubes formation and boosting of an internal sympagic community. The delay in ice growth in the Ross Sea in 2017, on the contrary, has limited the potential for developing that community and establishing the typical diatom-dominated sympagic speciation. With later growth, in this colder more southerly (Ross Sea) region, the lack of light, thinner snow depths limiting flooding and the impermeable status of internal layers should not favor major biomass increases and species shifts later in the winter. In that respect, the higher Phaeopigments/Chl-a ratio in the Ross Sea vs the Weddell Sea might be an early sign of the decaying trend of the sympagic community in the Ross Sea.
Our PIPERS dataset suggests that, if the autumn ice advance continues to be delayed, as might be expected if we are now seeing the foreseen long-term decline of the Antarctic sea-ice cover, that trend in ice seasonality could have important implications for the sea-ice sympagic community in the Ross Sea.
Conclusions
Early winter sea ice is typically under-sampled in terms of both physical and biogeochemical properties. Links between polynya activity and pack ice seasonal growth are still often debated. The Ross and the Weddell Seas have both been characterized by a longer sea-ice season on the long term. However, recent anomalies in the observed trend of a generally increasing Antarctic sea-ice extent make it even more important to document Antarctic winter sea-ice behavior and changes, and its potential impact on ecosystems.
Here, we have documented the late development of the CRS sea-ice extent in 2017, and show how it has affected its physico-chemical and biological properties: thinner ice, with less early winter snow cover, seeded by granular ice from the RSP, but dominated by columnar ice growth, however slowed down by a larger than usual oceanic heat flux. This has resulted in a less ‘mature’, internal, sympagic community with a majority of small cells and a lower total biomass in the CRS.
Sea-ice growth and discharge from the TNBP is shown to mainly feed the coastal Western Ross Sea, in a very dynamic environment favoring rafting and dragon skin ice formation. The biological community there shows higher biomass, dominated by large celled communities and developing clearer bottom ice locations.
These properties are in clear contrasts with those recently observed in the Central Weddell Sea, demonstrating the crucial interest of enlarging our sea-ice biogeochemical database to winter times, a mandatory step to unbiased yearly budgets.
Acknowledgements
We are indebted to N.B. Palmer crew for their logistical support during the 2017 PIPERS cruise. S. Stammerjohn was supported by the PIPERS and LTER Programs of the U.S. National Science Foundation, ANT-1341606 (S. Stammerjohn and J. Cassano, U Colorado) and ANT-0823101 (H. Ducklow, LDEO/Columbia University), respectively. Steve Ackley (UTSA) was supported by the PIPERS program of the U.S. National Science Foundation ANT-1341717 and by NASA Grant 80NSSC19M0194 to the Center for Adv. Meas. in Extreme Environments at UTSA.Ted Maksym (WHOI) was supported by the PIPERS program of the U.S. National Science Foundation ANT-1341513. This research was supported by the Belgian F.R.S-FNRS (project ISOGGAP and IODIne, contract T.0268.16 and J.0262.17, respectively). Fanny Van der Linden, Sarah Wauthy, Gauthier Carnat, Célia Sapart and Bruno Delille are PhD students, postdoctoral researchers and research associate, respectively, of the Belgian F.R.S.-FNRS. This work was also supported by the Australian Government's Cooperative Research Centre program through the Antarctic Climate & Ecosystems Cooperative Research Centre, and by the Australian Research Council's Special Research Initiative for Antarctic Gateway Partnership (Project ID SR140300001). Daiki Nomura was supported by grants from the Japan Society for the Promotion of Science (#17H04715) and the National Institute for Polar Research through Project Research KP-303 (ROBOTICA) and #28-14. We thank Dr Jan Lieser for his constructive remarks and suggestions about primary production in Antarctic Polynya, in the early stages of this work.


 Open access

