

Inuit populations in the Arctic have gone through a nutritional transition from high consumption of traditional food, mostly consisting of marine mammals and fish, to a diet high in Western foods often with high contents of sugar and saturated fat( Reference Hansen, Deutch and Odland 1 ). At the same time, obesity has increased rapidly all over the Arctic followed by high prevalence of type 2 diabetes mellitus (T2DM) and impaired glucose tolerance (IGT)( Reference Jørgensen, Bjerregaard and Borch-Johnsen 2 ).
The relationship between glucose intolerance and traditional food has been studied before. Former research conducted in Greenland found that fasting blood glucose was positively associated with consumption of seal( Reference Bjerregaard, Pedersen and Mulvad 3 ). Another study found that daily consumption of seal and salmon was associated with a lower prevalence of IGT and T2DM among Alaskan Natives( Reference Adler, Boyko and Schraer 4 ). These results are contradictory, but indicate that dietary factors may influence T2DM among the Inuit. The traditional diet is high in n-3 fatty acids due to a high content of marine mammals and fish. It has been shown that the fatty acid profile of the diet influences insulin sensitivity and insulin resistance( Reference Riccardi, Giacco and Rivellese 5 ). Fish oil supplementation and consumption of fatty fish with high n-3 fatty acid content improved insulin sensitivity( Reference Ramel, Martinez and Kiely 6 , Reference Tsitouras, Gucciardo and Salbe 7 ). However, moderate fish oil supplementation showed no effect on insulin sensitivity or β-cell function in healthy individuals( Reference Giacco, Cuomo and Veesby 8 ). Furthermore, insulin sensitivity was not influenced by increasing the dietary n-3:n-6 ratio( Reference Griffin, Sanders and Davies 9 ). Other dietary factors influence the risk of T2DM as well. A dietary pattern characterized by red and processed meat, French fries, high-fat dairy products, refined grains and sweets resulted in a higher risk of T2DM( Reference van Dam, Rimm and Willet 10 ). A similar dietary pattern also with red and processed meat and refined grains was associated with an 18 % greater risk for T2DM( Reference Nettleton, Steffen and Ni 11 ). Adherence to a diet-and-lifestyle recommendation index showed lower insulin levels among elderly Puerto Ricans( Reference Bhupathiraju, Lichtenstein and Dawson-Hughes 12 ). Eilat-Adar et al. showed that a traditional dietary pattern among Alaskan Eskimos was associated with a more favourable cardiovascular profile( Reference Eilat-Adar, Mete and Nobmann 13 ). However, dietary patterns, specifically a traditional Inuit dietary pattern, have not yet been evaluated in relation to T2DM. The aim of the present study was to investigate the association between a priori derived dietary patterns (predefined) and various glucose metabolism outcomes, insulin resistance and β-cell function, with a focus on the association between a traditional dietary pattern and T2DM and pre-diabetic stages among Inuit.
Methods
Data for the present cross-sectional study were collected from 2005 to 2010. In total, nine towns and thirteen villages all over Greenland were included. The study was approved by the ethical review committee for Greenland. Participants were informed by letter prior to data collection and oral and written information was given by the beginning of data collection. All participants signed informed consent.
Participants
Participants were selected through a random sampling of adults (aged 18+ years) with residence in Greenland. Greenland was divided into twelve regions. From each region we chose a number of villages and towns to be included in the study. In towns a random sample of 11–22 % was drawn from the central personal register. In villages, all adult inhabitants were invited to participate. The total sample selected from the central personal register consisted of 5009 individuals, both Inuit and Danes. The final sample included in the analyses was only of Inuit ethnicity. With a participation rate for Inuit of 68 %, the total study sample consisted of 3108 Inuit included in the final data set. Clinical information was available for 99 % of Inuit participants. Questionnaires were translated from Danish into Greenlandic and translated back into Danish in order to validate the translation. Interviews were conducted in Greenlandic or Danish according to the wish of the participant. Ethnicity was determined at enrolment based on the primary language of the participant and self-identification. Only one ethnicity was allowed for each participant. We also recorded the ethnicity of parents and grandparents of the participant, based on questionnaire information.
Confounders
We defined potential confounders from former research and tested crude associations by general linear models before confounders were added to the final model. The final model included sex, age, total energy intake (kJ/d), alcohol consumption, smoking, physical activity and ethnicity. The participants who were enrolled in the study as Inuit based on language or self-identification were further classified as partly Inuit or full Inuit characterized from history of the grandparents’ ethnicity: if one to three of the four grandparents were of Inuit heritage, the participant was defined as partly Inuit; if all four grandparents were Inuit, the participant was defined as having full Inuit ethnicity.
We obtained information about smoking status, alcohol consumption and physical activity by interview and questionnaires. Participants were characterized as having never smoked, previous smokers or current smokers. Regarding alcohol consumption, participants were grouped into daily drinkers, weekly drinkers, monthly drinkers and abstainers. We measured physical activity by a modified version of the International Physical Activity Questionnaire (IPAQ)( 14 ). From this questionnaire we estimated the weekly number of minutes engaged in physical activity. Physical activity (min/week) was log-transformed to achieve normal distribution.
Dietary assessment
Dietary data were collected by an FFQ which included twenty-five traditional and forty-three imported energy-contributing food items. Frequency of consumption (the past month for traditional food and the past 12 months for imported food), estimated portion sizes and seasonal variation were reported. Portion sizes were estimated from four different serving sizes illustrated by photographs. For traditional foods we additionally recorded seasonal length (the availability) and took that into consideration when calculating the annual consumption. Missing information on portion size was substituted by gender-specific medians. Missing information on season length was substituted by community-specific medians. From published food tables we calculated intakes of energy and macronutrients( 15 – 17 ). Individuals who reported energy intake lower than 3350 kJ/d (men) and 2100 kJ/d (women) or higher than 17 000 kJ/d (men) and 15 000 kJ/d (women) were excluded from the analyses. We calculated the energy contribution from various food groups to the total energy intake (E%), which were used to define dietary patterns in the following. The full version of the questionnaire can be viewed elsewhere( Reference Bjerregaard 18 ).
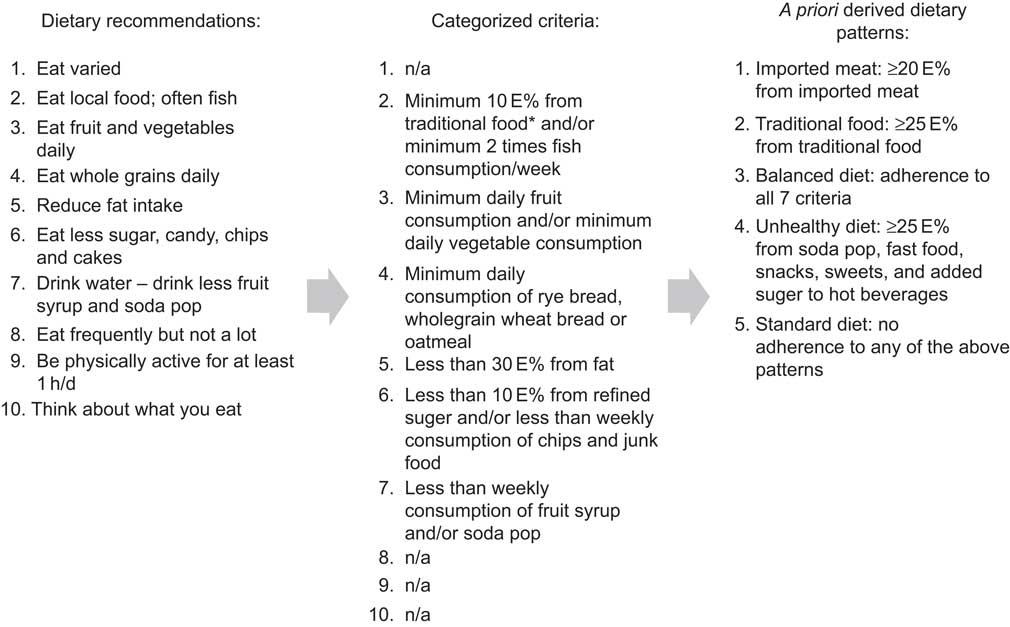
We identified five dietary patterns( Reference Bjerregaard and Jeppesen 19 ). The standard diet was characterized by <25 E% from traditional food items (marine mammals and fish, caribou, musk ox), <20 E% from imported red meat and <25 E% from ‘unhealthy food items’ (fast food, snacks, sweets and soda pops), but yet not living up to the recommendations of the Nutritional Board of Greenland for a balanced diet. The balanced diet complied with at least seven of the nine recommendations by the Nutritional Board of Greenland. The imported meat diet had ≥20 E% from imported red meat (but <25 E% from traditional food items and <25 E% from unhealthy food items); the traditional diet had ≥25 E% from traditional food items (but <25 E% from unhealthy food items); the unhealthy diet had ≥25 E% from unhealthy food items. The process from dietary recommendations to the a priori derived dietary patterns is shown in Fig. 1. In a previous publication we developed the a priori dietary patterns and compared them with a data-driven approach (factor analysis/cluster analysis). We found that the two approaches resulted in overlapping dietary patterns, although still different from each other, since the traditional dietary pattern from the data-driven approach was very high in sugar and in the a priori approach it was more strictly defined based on the content of traditional food( Reference Bjerregaard and Jeppesen 19 ). Our a priori derived dietary patterns were to a larger extent applicable to dietary interventions and to public health messages than the data-driven dietary patterns, and for this reason the present study uses the a priori dietary patterns.
The ten food-based dietary guidelines outlined by the Greenland Nutrition Board and the criteria upon which the a priori derived dietary patterns were based (*traditional food is defined as seal, whale, walrus, fish caught in open water, polar bear, musk ox, reindeer, wild fowls and berries; n/a, not applicable; E%, energy percentage)
Clinical measures
After minimum 8 h of fasting, the participants underwent a 2 h oral glucose tolerance test in which they received 246·5 ml (333·3 mg/ml) of glucose monohydrate equivalent to 75 g of glucose. Blood was drawn from the cubital vein at fasting state and 2 h after glucose intake. Plasma was separated, frozen at −20°C and transported to one central laboratory for measurement of plasma glucose using hexokinase/glucose-6-phosphate dehydrogenase determination on a Hitachi 912 Chemistry Analyser (Roche Diagnostics, Mannheim, Germany). Fasting insulin was measured using a two-site fluoroimmunometric assay for quantification of intact insulin in human serum (AutoDELFIA; Perkin Elmer, Waltham, MA, USA). Both glucose and insulin were analysed at Steno Diabetes Centre, Gentofte, Denmark. We defined impaired fasting glucose (IFG), IGT and T2DM according to the WHO criteria( 20 ): IFG was defined as fasting plasma glucose (FPG) >6·1 to 6·9 mmol/l; IGT as FPG <7·0 mmol/l and 2-h plasma glucose ≥7·8 to 11·1 mmol/l; finally T2DM was present when FPG ≥7·0 mmol/l or 2-h plasma glucose ≥11·1 mmol/l. The homeostatic model assessment–insulin resistance index (HOMA-IR) was used as a measure of insulin resistance and was calculated using the formula: HOMA-IR = [fasting insulin (pmol/l) × FPG (mmol/l)]/22·5. Higher values indicate insulin resistance. The homeostatic model assessment for β-cell function (HOMA-β) was used as a measure of β-cell function and was calculated using the formula: HOMA-β = [20 × fasting insulin (pmol/l)]/[FPG (mmol/l) − 3·5]. Higher values indicate good insulin secretion ability of the β cells. Waist circumference was measured on the standing participant midway between the rib and the iliac crest.
Statistical analyses
Data were analysed using the SPSS statistical software package version 19. Before analyses we excluded individuals with known T2DM, with missing data on physical activity, non-fasting individuals and individuals with unrealistic energy intake. A total of 784 participants were excluded and a further forty-seven participants were excluded in Table 3 due to missing values for 2-h plasma glucose measures. The baseline characteristics were tested by the χ 2 test (categorical variables) or general linear models (GLM for continuous variables). The association between dietary patterns and FPG, 2-h plasma glucose, fasting insulin, HOMA-IR and HOMA-β was tested by GLM with adjustment for sex, age, ethnicity (full or partial Inuit based on the ethnicity of the grandparents), waist circumference, total energy intake, physical activity and smoking status. Logistic regression analyses with forced entrance were used to analyse the association between dietary patterns and T2DM, IFG and IGT with the adjustments as above and furthermore we added the interaction between sex and dietary pattern. The association between T2DM and dietary patterns was limited to newly diagnosed cases. Energy intake (kJ/d) was log-transformed to achieve normal distribution. All clinical outcome variables were log-transformed to achieve normal distribution as well.
We checked the clinical variables for outliers and identified outliers using box plots. The HOMA-β variable was examined; we found negative values due to FPG ≤3·5 pmol/l, and these values were excluded as well. To include smoking in the model, we used dummy variables for the analyses in Table 3.
Results
A total of 3108 Inuit aged 18+ years (42 % men) participated (participation rate 68 %). The median age was 44 years (range 18–89 years). According to grandparents’ ethnicity, we characterized 13 % as having partly Inuit and 87 % as having full Inuit heritage. We excluded 352 participants due to unrealistic energy intake and more participants were excluded due to known T2DM (n 68) and not fasting (n 112) at the time of clinical examinations. Invalid physical activity data and outliers for HOMA-IR and HOMA-β values further reduced the study sample to a total of 2374 participants. In the initial analyses we found a significantly higher energy intake among men compared with women (mean 9890 (sd 3195) kJ/d v. 7987 (sd 2815) kJ/d, P < 0·0001) and men also had a higher intake of traditional food than women (22 E% v. 19 E%, P = 0·001). We found no significant difference in the intakes of imported meat and unhealthy sugar-dense foods, such as candy, cakes and soda pops (data not shown). However, we found that fruit and vegetables contributed more to the diet for women than for men (7 E% v. 4 E%, respectively, P < 0·0001; data not shown). The participation rate varied by sex and age; women participated in the data collection more often than men (data not shown).
Table 1 shows the baseline characteristics for men in each dietary pattern and Table 2 for women. The traditional dietary pattern was different from the other patterns with regard to ethnicity: the majority of the participants with a traditional pattern were Inuit with four Inuit grandparents. Smoking was very prevalent and all dietary patterns had a high percentage of active smokers. Alcohol consumption was not prevalent on a daily basis in any of the dietary patterns, although prevalent on a monthly basis. Due to the weak association between the dietary patterns and alcohol consumption, this confounder was not included in further analyses.
Behavioural and clinical characteristics of the five dietary patterns among Inuit men (n 987) aged 18+ years, Greenland, 2005–2010

E%, energy percentage; IFG, impaired fasting glucose; IGT, impaired glucose tolerance; T2DM, type 2 diabetes mellitus.
Behavioural and clinical characteristics of the five dietary patterns among Inuit women (n 1387) aged 18+ years, Greenland, 2005–2010
E%, energy percentage; IFG, impaired fasting glucose; IGT, impaired glucose tolerance; T2DM, type 2 diabetes mellitus.
Table 3 shows the mean values of clinical parameters according to dietary pattern. We found that FPG was significantly higher in the traditional pattern compared with the standard diet. Fasting insulin and HOMA-β were significantly lower in the traditional dietary pattern compared with the standard diet. Furthermore, insulin resistance was lower among participants with a traditional diet compared with a standard diet, although not significantly. Sex, age and waist circumference were associated with fasting glucose and insulin, 2-h plasma glucose, HOMA-IR and HOMA-β (data not shown). Physical activity and smoking were significantly associated with fasting insulin, 2-h plasma glucose, HOMA-IR and HOMA-β (data not shown). Energy intake was not significantly associated with any of the outcomes shown in Table 3. Ethnicity was significantly associated only with 2-h plasma glucose.
Mean values (and 95 % confidence intervals) of clinical parameters for the five dietary patterns among adult Inuit (n 2327, missing 47), Greenland, 2005–2010
FPG, fasting plasma glucose; HOMA-IR, homeostatic model assessment–insulin resistance index; HOMA-β, homeostatic model assessment of β-cell function.
Analyses are adjusted for age, sex, ethnicity, waist circumference, physical activity, smoking and total energy intake. P values indicate the difference between the respective dietary pattern and the standard diet.
Figure 2 shows the association of each dietary pattern with T2DM, IFG and IGT as a forest plot with odds ratios and 95 % confidence intervals (where the standard diet is the reference; OR = 1·0). A total of 1581 participants were characterized as having normal glucose tolerance. The traditional dietary pattern showed significantly higher odds for IFG and T2DM, whereas no significant association was found for IGT. The balanced diet and the unhealthy diet also showed higher odds for IFG and T2DM, but neither was significant.
Odds ratios (with 95 % confidence intervals represented by horizontal lines) for type 2 diabetes mellitus (T2DM), impaired glucose tolerance (IGT) and impaired fasting glucose (IFG), according to dietary pattern (⧫, imported meat; ▴, traditional food; ▪, balanced diet; ●, unhealthy diet), among 2374 Inuit aged 18+ years, Greenland, 2005–2010. The standard diet was set as reference (OR = 1·0); NGT, normal glucose tolerance. Analyses were adjusted for age, sex, waist circumference, ethnicity, physical activity, smoking and total energy intake. Number of participants included in each analysis: T2DM, n 1806; IGT, n 1703; IFG, n 1901; NGT, n 1581
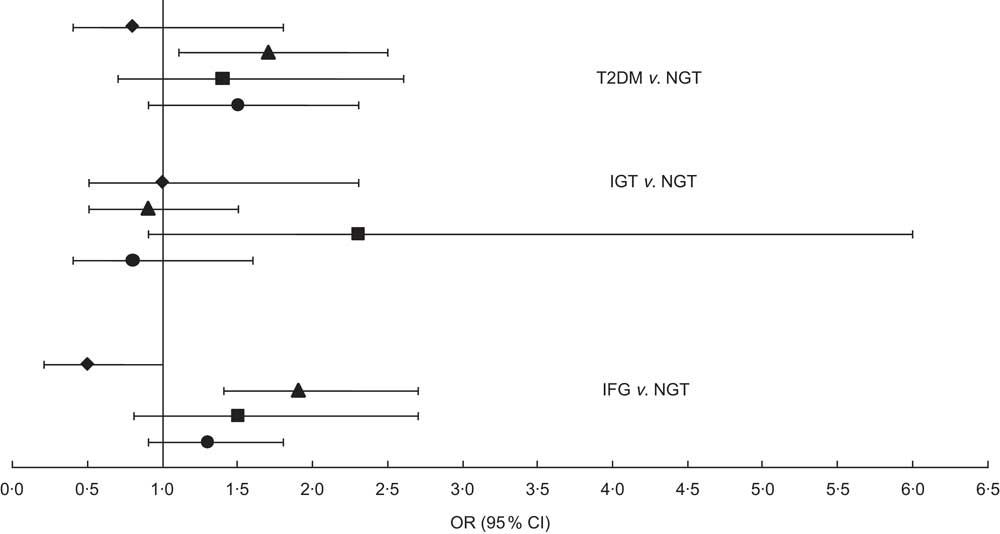
Like the clinical outcomes shown in Table 3, age and waist circumference were associated with all glycaemic outcomes. Sex was associated only with IFG and IGT. The interaction between sex and dietary pattern was not significant for the associations with IFG and T2DM, but was significant for IGT; although, when we stratified the analyses on sex, the association was not statistically significant because there were only eighteen male participants with a balanced dietary pattern. The small number of cases in the balanced dietary pattern is the reason for the wide confidence interval for IGT in Fig. 2. Being female gave decreased odds compared with male (OR = 0·7, 95 % CI 0·5, 0·9) for IFG. Ethnicity was associated with IGT: being fully Inuit gave increased odds for having IGT (OR = 2·9, 95 % CI 1·2, 6·9). Ethnicity was almost significant for T2DM as well (P = 0·06) and showed the same tendency as IGT: OR = 1·8 (95 % CI 0·97, 3·36) for fully Inuit compared with partly Inuit (OR = 1·0). Smoking was the only confounder associated with IFG and physical activity was associated only with T2DM. These results are not shown.
Discussion
In the present study of associations between dietary patterns and glycaemic outcomes among adult Inuit, we found that a traditional diet, defined as the consumption of at least 25 E% of traditional food, was significantly associated with T2DM, higher fasting glucose and lower β-cell function. An unhealthy diet, defined by a high intake of added sugar and fast food, gave significantly higher insulin resistance compared with the standard diet, but this was not found for the traditional diet. Among the men 33 % and among the women 34 % were grouped in the standard diet, meaning that they do not adhere to any of the dietary guidelines outlined by the Greenland Nutrition Board.
Previously, it was found that FPG increased with the consumption of marine food( Reference Bjerregaard, Pedersen and Mulvad 3 ). Raised FPG could reflect impaired insulin secretion( Reference Weyer, Bogardus and Mott 21 , Reference Faerch, Vaag and Holst 22 ). This corresponds well with our findings that the traditional dietary pattern was associated with significantly lower β-cell function. Furthermore, our study showed that in relation to T2DM or IFG, the traditional dietary pattern gave significantly higher odds for both disease outcomes. Previous research found that a dietary pattern high in sugar and processed meat increased the risk of T2DM( Reference Schulze, Hoffmann and Manson 23 ). The unhealthy diet with 26 E% and 27 E% from sugar (men and women, respectively) was significantly associated with higher FPG, higher 2-h plasma glucose and higher insulin resistance compared with the standard diet. High loads of sugar may increase the risk of insulin resistance irrespective of obesity level( Reference Schulze, Liu and Rimm 24 ).
In relation to our findings, it seems from Fig. 2 that the most advantageous dietary pattern is the imported meat diet, which indicated an almost significantly lower association with IFG, although not a significantly lower association with T2DM. Furthermore, we found that the unhealthy diet gave significantly lower odds for T2DM and IFG compared with the traditional diet. A follow-up study showed that an unhealthy dietary pattern high in junk food, sugar and red meat increased the risk of T2DM (OR = 1·56, 95 % CI 1·32, 1·93)( Reference van Dam, Rimm and Willet 10 ). Traditional food in Greenland is normally consumed by older generations and plays an important role especially in villages and smaller towns. In Greenland, populations living in small towns and villages live a more isolated life and some places have poor contact with health services and medical treatment. Co-morbidity in relation to poor glycaemic control is therefore a possible confounder that we do not have data for. Furthermore, we found women to have decreased odds for IFG, which is in accordance with previous research( Reference Williams, Zimmet and Shaw 25 , Reference Faerch, Vaag and Holst 26 ). Traditional food in Greenland consists mainly of marine animals and results in a diet high in n-3 fatty acids. Our results showed that among both men and women the n-3 fatty acids intake was the highest in the traditional dietary pattern compared with the other patterns. Both human and animal models have shown that n-3 fatty acids can decrease the insulin resistance in muscle tissue( Reference Taouis, Dagou and Ster 27 , Reference Stettler, Ith and Acheson 28 ). Our results did not support this. Additionally, n-3 fatty acids may prevent T2DM, although not reversing the disease when first present( Reference Taouis, Dagou and Ster 27 ). Our data did not support this either, since traditional food gave higher odds for T2DM as well and the prevalence of both IFG and T2DM was high for both men and women eating the traditional diet. It is noteworthy that the imported meat dietary pattern had the lowest prevalence of IFG for both sexes and T2DM for men. Unknown lifestyle factors could play a role. Although we adjusted our analyses for many lifestyle factors known to be related to both diet and glucose metabolism outcomes, there is always a risk that unknown factors play a role.
Another explanation could be other dietary components that outweigh the benefits of n-3 fatty acids. Contaminants such as mercury and persistent organic pollutants accumulate in the top predator animals that constitute a major part of traditional food. Decreased β-cell function and impaired insulin action are both important early stages in the development of T2DM( Reference Weyer, Bogardus and Mott 21 , Reference Weyer, Tataranni and Bogardus 29 ). Contaminants could explain the lower β-cell function in the traditional dietary pattern. Another study found a significant association between persistent organic pollutants and low insulin secretion, although no associations were found between persistent organic pollutants and T2DM, IGT or insulin resistance( Reference Jørgensen, Borch-Johnsen and Bjerregaard 30 ). However, the interpretation and conclusions drawn for HOMA indices should be cautious, since these indices have never been validated in Inuit populations.
Another factor is ethnicity. Inuit heritage was positively related to both the traditional pattern and T2DM. Although a significant residual remained for the association with T2DM, it cannot be excluded that genetic susceptibility to T2DM may confound the association. Regarding confounders, we chose to include factors that from former research were shown to be associated. We tested associations between our glycaemic outcomes and the predefined confounders. Increasing frequency of alcohol consumption has been shown to increase the risk of T2DM( Reference Jørgensen, Bjerregaard and Borch-Johnsen 2 ). The risk of T2DM seems to be inversely related to smoking since current smokers compared with non-smokers have a lower risk of both T2DM and IGT among Inuit( Reference Jørgensen, Bjerregaard and Borch-Johnsen 2 ), although that study was contrary to a large meta-analysis that found active smoking was associated with an increased risk of T2DM( Reference Willi, Bodenmann and Ghali 31 ). Anthropometric studies in Inuit populations have shown that BMI might be overestimating overweight and obesity( Reference Charbonneau-Roberts, Saudny-Unterberger and Kuhnlein 32 ). Abdominal fat is a strong risk factor for various metabolic complications including T2DM compared with total fat mass( Reference Han, Feskens and Lean 33 , Reference Vasquez, Durval and Jacobs 34 ). We chose to use waist circumference as a measurement of abdominal fatness, which has been shown to correlate with incidence of insulin resistance, diabetes and pre-diabetes( Reference Charbonneau-Roberts, Young and Egeland 35 – Reference Murphy, Schraer and Thiele 37 ).
A limitation in our study is regarding the FFQ, which was not validated. We excluded 352 participants as either under- or over-reporters based on their calculated energy intake. This proportion of misreporting could be related to the lack of validation of our FFQ, but to what extent this influences our results is unknown.
The energy percentage from sugar was similar in the traditional and the standard diets. High sugar intake cannot therefore explain the higher odds for IFG and T2DM in the association with traditional food. Further, the unhealthy diet was associated with higher FPG and gave higher odds for IFG and T2DM; however, this was not significant.
A priori derived dietary patterns show a realistic consumption of food instead of simple associations between single nutrients and disease outcomes. Foods are not consumed in isolation but as a mixed diet. Our approach to test dietary patterns takes the synergy between foods into consideration. One strength of our study is the large study sample, which gives statistical strength to the associations. In our study the response rate was 68 %, which is high for this kind of study and country. The study sample was randomly selected from the total population, which is a strength. However, in the final study sample younger men were under-represented and we tried to solve this bias by adjusting for both sex and age in all analyses. Another of the study's strengths is the fact that we conducted analyses only on newly identified cases of IFG, IGT and T2DM. In this way we avoided bias due to those participants already diagnosed with diabetes changing their lifestyle or diet as part of a treatment.
Conclusion
The present study does not argue for the consumption of traditional food for nutritional or health benefits. Due to increased problems of contamination, many Arctic areas have developed restrictions on the consumption of marine mammals( Reference Jeppesen, Bjerregaard and Young 38 ). On the contrary, it seems that imported meat is more advantageous in relation to IFG, T2DM, insulin secretion and fasting glucose. Nevertheless, to get the full understanding of T2DM in this population, we strongly recommend further research into the effects of ethnicity and the role of contaminants in relation to glucose intolerance.
Acknowledgements
Sources of funding: This study was funded by the Karen Elise Jensen Foundation; The Danish Agency for Science, Technology and Innovation (Danish Council for Independent Research); and the Commission for Scientific Research in Greenland. Conflicts of interest: C.J. has no conflict of interest. M.E.J. is employed by Steno Diabetes Centre A/S, a research hospital working in the Danish National Health Service and owned by Novo Nordisk A/S. M.E.J. and P.B. own shares in Novo Nordisk A/S. Author's contributions: C.J. analysed the data, performed the statistical analysis, wrote the paper and had primary responsibility for the final content. M.E.J. and P.B. designed and conducted the research, took part in data analysis and participated in writing the manuscript.


