


Introduction
A good numerical model of the physical characteristics of snow cover at The surface of polar ice sheets has applications in numerous fields of polar climate and environment research, including the study and understanding of atmosphere snow exchange of energy, momentum and matter (such as atmospheric composition and impurities, the interpretation of satellite data, and the quantification of the processes of transformation and sintering of snow LntO firn and then into ice.)
Grocus (Reference Brun, Martin, Simon, Gendre and ColéouBrun and others, 1989, Reference Brun, David, Sudul and Brunot1992) is a one-dimensional (1-D) model of snow-cover evolution. The main snow-cover characteristics simulated by Crocus and their evolution with time are strongly governed by surface meteorological conditions. Therefore. Crocus needs hourly meteorological input data.
Initially, Crocus was set up and adjusted for snow modeling under temperate Alpine meteorological conditions, and it is used operationally for avalanche forecasting. For polar applications, all the necessary meteorological data are or have been directly observed at a few sites and over limited time periods only. On The other hand, more than 15 years of analyses and short-term predictions are archived at the European Centre for Medium-Range Weather Forecasts (ECMWF) at Reading in the UK, and are available every six hours at a spatial resolution of up to 0.5° all over the globe. The analyses and short-term predictions are constrained by the synoptic observations provided by the World Meteorological Organisalion network. As these observations are rare in polar regions, the constraint at global scale is rather low. In addition, radiation and precipitation are not systematically observed, and are not used as constraints for meteorological analysis and prediction. The ECMWF archive is thus largely a climate-model product over the polar ice sheets. The data quality and the possible consequences of inaccuracies in Crocus have to be carefully checked.
Crocus has been validated for temperate Alpine snows. In polar conditions (cold temperature, low precipitation, polar radiative cycle), some of the current percipitation may well reach their limit of validity. An extreme test site has to be chosen to cheek this aspect. the Soulh Polepermanent station is probably the best possible site, for which comparatively good snow and meteorological observations are available,
Crocus
The Crocus model has been described in detail by (Reference Brun, Martin, Simon, Gendre and ColéouBrun and others 1989, Reference Brun, David, Sudul and Brunot1992), and so only a brief description of the model and the initial and boundary conditions is given here Crocus simulates the energy and mass evolution ofa 1-D snow cover which is considered as a stack of layers maximum = 50) that are parallel to the slope, and the energy exchanges are projected perpendicular to the slope. Each snow layer is characterized by its thickness, temperature, density, liquid water content, grain-size, grain sphericity and grain age. To run the model, an initial snow profile is needed. The evolution of the snow characteristics depends on meteorological parameters, which are needed at an hourly step. These parameters are: 2 in air temperature, surface wind, air humidity, precipitation (amount and phase). incident direct and scattered solar radiation, incident infrared radiation and cloudiness.
The principal processes taken into account in the model are:
-
(1) snow melamorphism,
-
(2) snow settlement.
-
(3) heat diffusion using an effective thermal conductivity depending on snow density.
-
(4) absorption of solar radiation at the Surface and in depth, the albedo and the absorption coefficients depend on the wavelength and on snow type,
-
(5) internal melting and refrezing,
-
(6) percolation of liquid water,
-
(7) surface exchanges: turbulent sensible and latent heat fluxes, longwave radiation, precipitation.
Extraction of Meteorological Data from ECMWF Archives and Antarctic Validation
The ECMWF analyses have been extracted over the entire surface of Antarctica, at a spatial resolution of 1,5 from 1 October 1991 to 30 September 1992. Automatic Weather Station ( AWS) observations ( Reference Keller, Weidner and StearnsKeller and others, 1993) have been retrieved for the same period to compare with the analyses. AWSs measure pressure, air temperature and wind (speed and direction) at 2 m every 10 minutes. Published observations of the South Pole radiation budget were compared with ECMWF data.
The hourly meteorological data necessary to force Caocus have been obtained by linear temporal interpolation of the 6 hourly ECMWF analyses. Precipitation and radiation are forecasted fluxes accumulated over one dav of simulation. Precipitation is linearly interpolated, but the diurnal cycle of radiation must be accounted for. Also, the ECMWF solar and infrared radiations are net budgets, but Caucus needs the incident direct and scattered components in the visible and incident infrared radiation. The reflected fraction of solar radiation is calculated from The surface albedo, and the total incident is deduced. The cloudiness from the ECMWF archive allows the scattered and the direct fraction of solar radiation to be estimated. After this decomposition, the diurnal radiative cycle is reconstructed to evaluate instantaneous hourly values from the accumulated data. The infrared radiation emitted at the surface is simply calculated from the archived surface temperature, and the incident infrared is deduced as the residual.
The different components of the radiative budget obtained from the ECMWF archive are shown in Figure 1 for The South Pole. These dala are compared to The observations reported by Reference CarrollCarroll (1982) for 1976 and 1977. The ECMWF annual mean net radiative budget exceeds by 15Wm−2 and underestimates by 10 Wm2 the observation in the solar and thermal domains respectively.The fact that the ECMEF visible albedo is about 80%, which is slightly under observed values, might explain an excess of absorbed solar energy. In The infrared, it is the incident fraction that is too low by about Wm−2.
Radiative budget at the South pole between 1 October 1991 and 30 September 1992. Numbers in parentheses are annual means. followed by observed annual means when available. The observations are from Reference CarrollCarroll (1982).

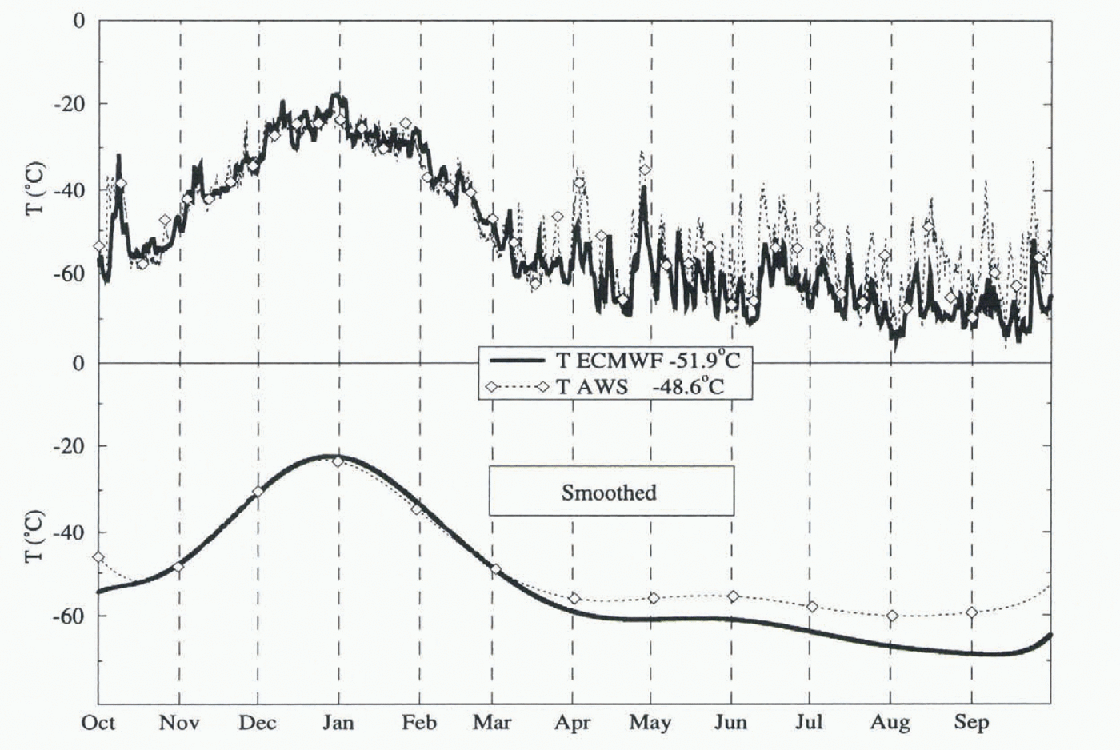
The 2m air temperature in Figure 2 shows that the analyses are too cold by 3.3°C based on the annual mean. The amplitude of large and rapid temperature oscillations during The cold season is poorly reproduced in the ECMWF analysics. and warmings are almost systematically underestimated. Errors can reach 20°C over time-scales of days, and accumulate to yield a marked cold winter bias., which is clearly shown in the smoothed curves.
Daily mean air temperature at the South Pole between 1 October 1991 and 30 September 1992., Numbers in parentheses are annual means.
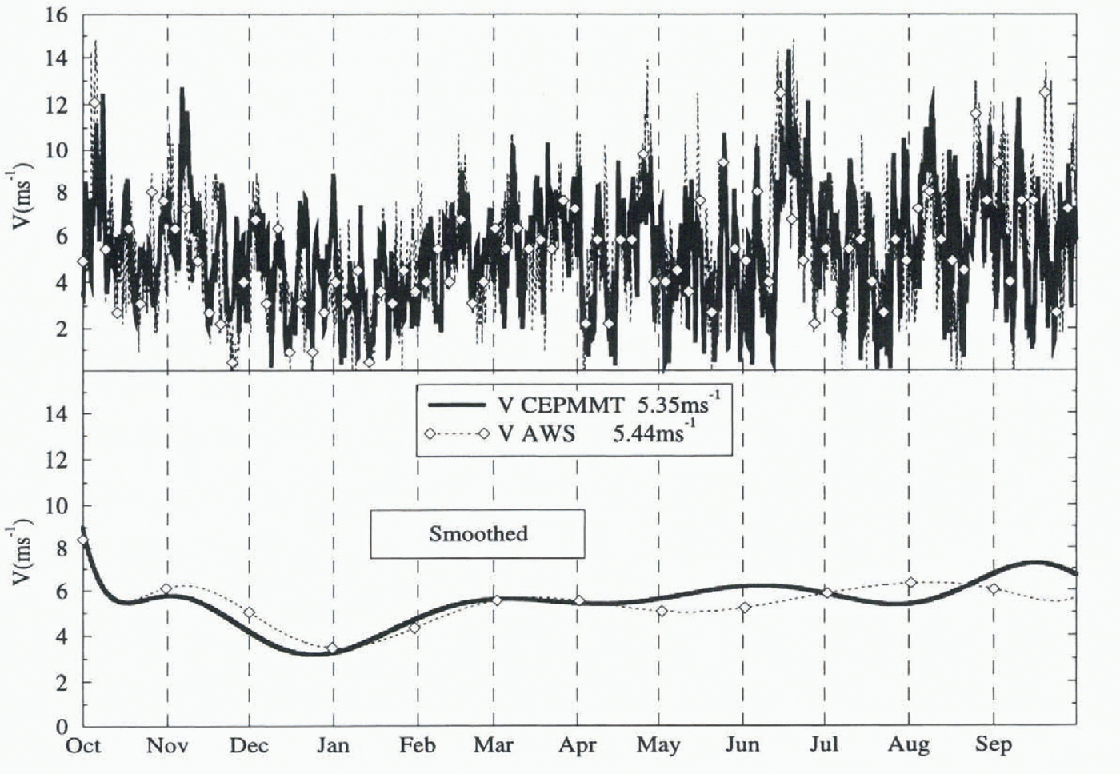
The analysed wind speed is more in agreement with observations (Fig. 3). The annual mean wind intensity is 5.35ms−1 and 5.44 ms−1 in the ECMWF and AWS archives respectively.
Daily mean wind speed at the South Pole between 1 October 1991 and 30 September 1992. .Numbers in parentheses are annual means.
The ECMWF archive is a well-known high-quality Sonn e of meteorological data, yet comparison with AWS and other observations shows some inaccuracy over Antarctica. The sensitivity of the snow model to meteorological input uncertainties must be evaluated in order to estimate the potential quality of future large-scale simulations of the snow cover in polar regions using ECMWF data.
Snow Simulations at the South Pole
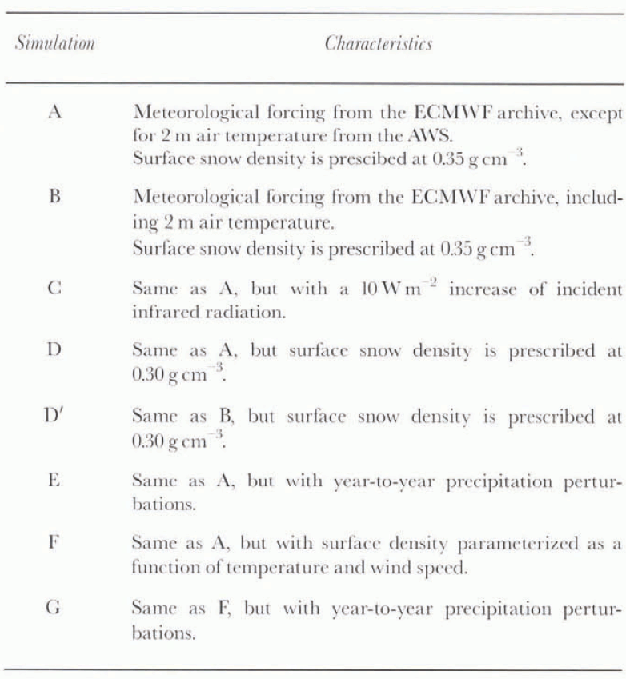
A set of 20 year snow simulations has been computed in order to characterise Crocus’s sensitivity to air temperature, incident infrared radiation, surface density of fresh snow and inter-annual variation in accumulation (Table 1). To cover 20 years, the ECMWF-derived one year meteorolog-ical dataset described above is used cyclically. As inter-annual accumulation variations must be accounted Ibr (see next), it will be introduced by perturbing the one year set.
Sensitivity Simulations Performed
Temperature in the snow cover
Figure 4 presents the mean monthly temperature profiles for six selected months inside the snow cover down to 2 m. Three simulations have been done, and are compared to observations reported by Reference Dalrymple and RubinDalryniple (1966) for 1957-58. In the first test (simulation A) the model is forced by ECMWF archived data for the South Pole, except for air temperature, which is retrieved from the AWS observation. In simulation B. the full ECMWT meteorology is used, including the cold-biased analysed surface temperature. Finally simulation C reproduces the conditions of simulation A, but with the infrared budget increased by 10 Wm−2.
Mean monthly temperature profiles inside the snow cover. The observations are from Reference Dalrymple and RubinDalrrmple (1966). Details of simulations A, B and C are given in the main text and Table 2.
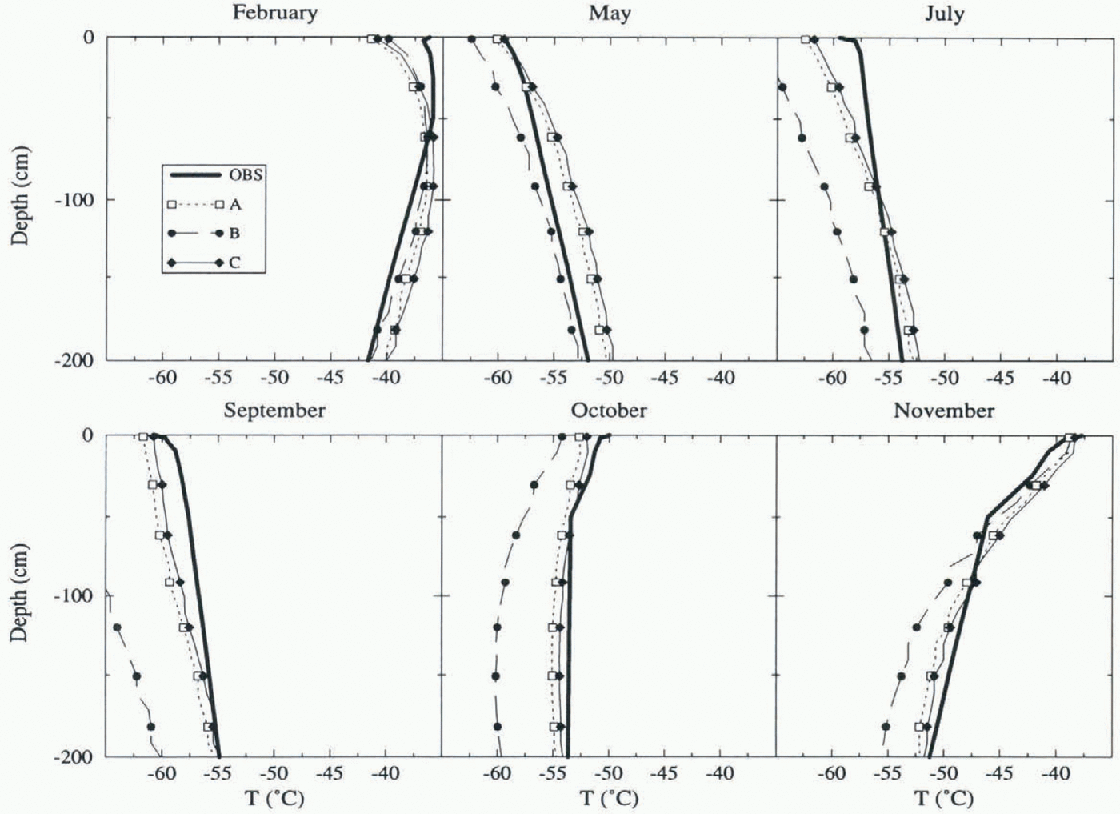
The impact of the somew hat low ECMWF air temperature can be seen during the winter months [July, September and October;. Forcing with the AWS temperature instead leads to a very clear improvement of the simulated thermal profiles for all months of the year. Therefore, Crocus does correctly simulate the transfer of heat through the snow cover, but model sensitivity to an expected error of atmospheric temperature forcing is significant. On the other hand, simulation C shows little sensitivity to errors of infrared radiation forcing, even during the polar night when thermal radiation is a dominant component of the surface heat budget.
Density, grain-size and shape
We now consider the structural snow-cover characteristics simulated by Crocus: snow density, grain-size and grain shape Fig. 5. The observations of density and grain-size were obtained by J. R. Petit (personal communication. December 1975). Additional grain-size observations, plotted in Figure 5b, were reported by Reference GowGow (1969). Only qualitative reports of grain shape are available to compare with model results.
Snow-density (a),.grain-size (b) and sphericity (ej profiles inside the snow cover. Details of simulations A, B, C, D. D′ and E are given in the main lest and Table 2. Density observations are from J. R. Petit (personal communication). Grain-size observations are from Reference GowGow (1969) and J. R. Petit (personal communication. 1975).
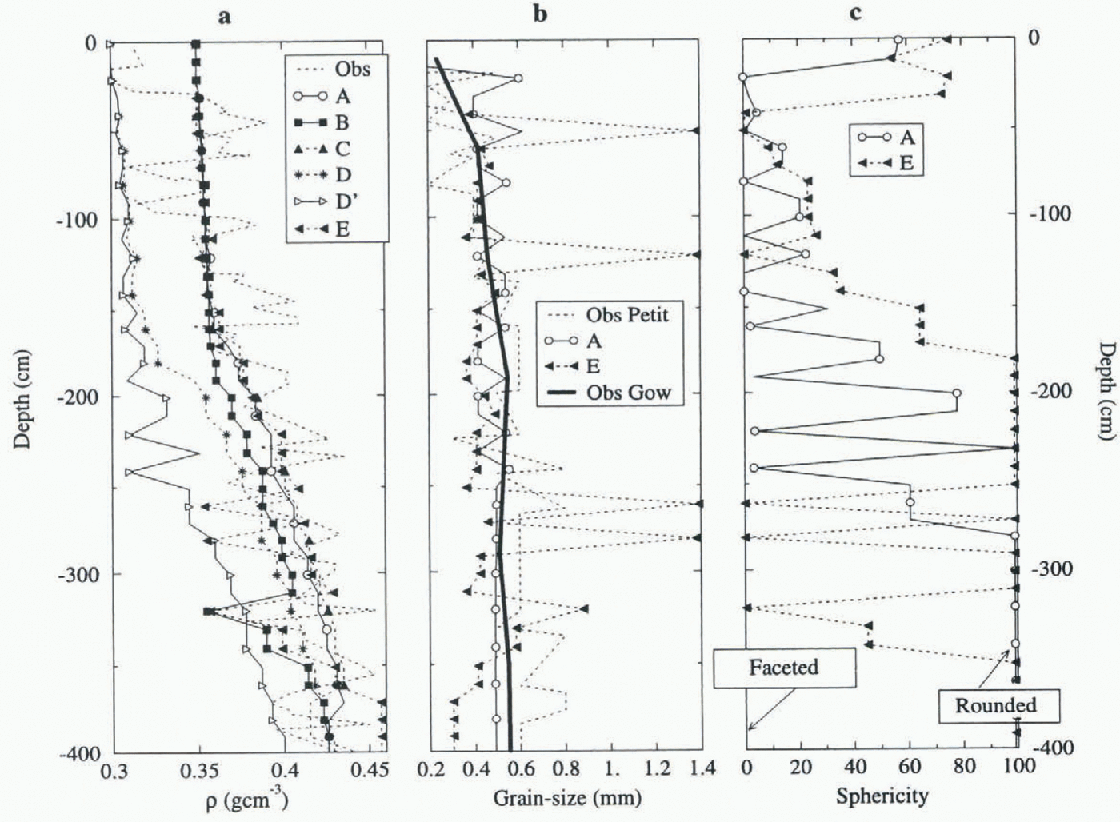
Simulations A and B yield similar, monotonous, density profiles down to 1.5 m. but below this depth the two profiles differ significantly. This is because the present densification
formulation in Crocus only takes into account the settling by the weight of overlying snow layers, with a compactive viscosity depending on local density and temperature In practice, weight-induced densilication becomes efficient below 1.5 m only, but observations show a rapid succession of layers of distinctive densities in the first meter. In fact, a fast densification process takes place right at the surface, due to wind mechanical forcing and the breaking of branched crystals (recently deposited at low density) followed by grain aggregation. This is not yet adequately accounted for by Crocus.
Model results are very sensitive to the initial surface desity of fresh snow deposited at the surface. In standard Crocus, deposited snow density is parameterized using the Pahaut formula (Reference Durand, Burn, Mérindol, Guyomarc’h, Lesaffre and MartinDurand and others, 1993). which is based on wind speed and air temperature. The formula is valid for temperate regions, but gives strongly underestimated densities in the polar temperature range. In the cold and windy polar regions, the measured surface densities are generally in the range of 0.3-0.45 gm−3 . The mean surface density at the South Pole is about 0.35 gcm−3, This value was used for simulation A and B.
Except for the rapid fluctuations (see above), the simulated density profiles show good agreement with observation (Fig. 5a). To test the sensitivity of the results to this parameter, two simulations D and D′ (respectively with AWS and ECMWF air temperature have been performed with an imposed initial density reduced to 0.35 gem3 In Figure 5a, the simulation A should be compared to D, and B to D′. Even though the surface density error decreases with depth (from 0.05 at the surface, to 0.02 at 3 m depth ), it propagates deep into the snow cover. It is apparent that the ECMWF temperature error tends to slow down densification in simulation D′ compared to D. Clearly, the development of a suitable and precise parameterization of the initial surface density is an important aspect of the adaptation of Crocus for the polar regions. This point is addressed again next in simulations F and G.
Grain-size and grain-shape (sphericity) profiles are plotted in Figures 5b and 5c. Crocus simulates a regular succession of small, rounded and large-faceted grain layers.
The large-faceted grains correspond to depth hoar formed near the surface in the region of high lemperature gradient (Reference MarboutyMarbouty. 1980). In simulation A. Crocus appears to simulate more depth hoar than observed (qualitative observations not shown). Reference Perla and OmmnanneyPerla and Ommammey (1985) have verified experimentally that low densities favor depth hoar, but high densities (>0.2gcm−3) inhibit depth-hoar formation. However, The current parametric laws of Crocus allow this formation, even for the high snow densities measured ai the South Pole. Also, the current Crocus law governing the evolution of grain-size allows grain growth when the temperature gradient is strong if the faceted slate is fully reached (sphericity = 0). As a consequence, The model grains only grow near The surface. However. J. R. Petit’s observations Suggest that grain-size still evolves and increases below 2 m, even though temperature gradients are small. The isothermal processes that control grain growth at depth (Reference GowGow, 1969. Reference AlleyAlley. 1988) are not currently formulated in the model, and need to be implemented.
The regularity of year-to-year layer succession is the result of forcing the model with a constant annual precipitation. Yet, inter-annual accumulation variability is high in Antarctica. Simulation E has been computed with variable annual precipitation rates. Instead of using a constant annual precipitation rate, we defined arbitrarily a four year
cycle for precipitation, in which the value of the previous simulations is respectively multiplied by 1.0, 0.5, 2 and 0.5. As all the results shown here come from 20 year runs, this cycle is repeated the times. Results (Fig. 5b) clearly show the importance of this meteorological parameter for the grain-size evolution. When precipitation is less, deposited snow stays longer near the surface and is thus more durably exposed to strong temperature gradients. It is more likely to become faceted, anil to grow to large particles of up to several millimeters (Reference Nishimura and MaenoNishimura and Maeno, 1984, Reference Nishimura and Maeno1985) see levels −50 cm and 120cm in Fig. 5b and c). With increased annual precipitation rate, grains are smaller and less faceted (between −70cm and −110cm) or completely rounded (between −180 and −250 cm).
In order to define more accurately the sensitivity of the model to the initial Surface density, two additional simulations were performed. the setting of simulation F was identical to A. except for the density of freshly deposited snow, which is a function of air temperature and of wind speed. The Pahaut parameterization is used with modified parameters. In simulation G, the accumulation was also dis-turbed as in simulation E. Figure 6 compares observations with simulations F and G. Large density variations are simulated near the surface, which are in good agreement with observations (Fig. 6a). However, densification smooths the variations below 1.5 m, whereas observations show thai they are preserved at depth. The most interesting aspect of these simulations is the impact on grain-size and shape profiles (Fig 6b and c) In simulation F, grains do noi evolve much and remain close to a diameter of 0.4 mm all the way down to a depth of 4 m. In particular, grains do not reach the stale of depth hoar (Fig. 6c), while in simulation. A depth hoar was formed excessively frequently, the differences between simulations A and F are the consequences of snow density on the simulated temperature gradients near the surface, which are lower for simulation Fand thus lead to much slower grain evolution. However, because inter-annual variations in accumulation induce strong inter-annual variability of near-surface temperature gradients see the discussion of experiment E), simulation G does, from time-to-time, reproduce depth-hoar layers in qualitative agreement with observations (levels −170 and −255cm).
Snow-density (a) grain-size (b) and sphericity (c) profiles inside the snow cover. Details of simulations F and G are given in the main text and Table 2. Observations are from J. R. Petit (personal communication. 1975)

Conclusions
We have presented the results of an analysis of Crocus’s ability to simulate the physical characteristics of polar snow at The surface of ice sheets with simple and straightforward adaptations of the snow model.
Meteorological analyses and predictions constitute the only possible source of data for large-scale forcing of the model. yet we find that, over Antarctica (in fact, at the South Pole, the necessary meteorological data archived at ECMNWF are not in full agreement with direct observations. Our tests indicate that the model is sensitive to air temperature errors. This dependency is significant for temperature profiles inside the snow cover, but less important for snow density and grain-size modeling.The uncertainty on the infrared radiation budget has a low impact on the simulation. On the other hand, accumulation variability is an important factor for grain-size evolution.
The density and grain-size of surface snow are functions of the meteorological parameters (air temperature and wind speed), which strongly condition the evolution of the snow cover. Therefore the formulations of these initial Values need to be adapted to polar meteorologieal conditons.
The results of this study are quite encouraging because, even with minor adaptations to polar conditions, Crocus simulates many important aspects of polar snow-cover evolution. Research will be continued through a project of the European Commission Environment and Climate Program that will see collaboration between the Laboratoire de Glaciologie et Géophysique de l’Environnement, the Centre d’Études de la Neige, the British Antarctic Survey, and the University of Barcelona.
Acknowledgements
This research was supported by the Directorate General XII of the European Commission (contract ENV4-CT95-0076).



