


Introduction
The expansion of the Islamic Caliphate to become one of the most powerful early-medieval polities was underpinned by vast reserves of silver coin—dirhams—produced in their millions across a mint network stretching from North Africa to Central Asia (Noonan Reference Noonan1986; Figure 1). There is academic consensus that this minting programme stimulated agricultural production, facilitated the monetisation of wages, taxes and market exchange, and promoted international trade with Europe (e.g. Ehrenkreutz Reference Ehrenkreutz1992; Lombard Reference Lombard2001; Kennedy Reference Kennedy2002; Shatzmiller Reference Shatzmiller and Klemm2013). Yet while the impact of minting and monetisation has been widely discussed, investigations into the sourcing and supply of metal for the minting of silver currency have been more limited. This is a missed opportunity, for by identifying the sources of this silver, we can better understand minting patterns and evaluate the resources, industrial capacity and trans-regional trade networks of the early Islamic state (c. AD 700–900).
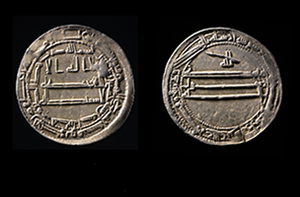
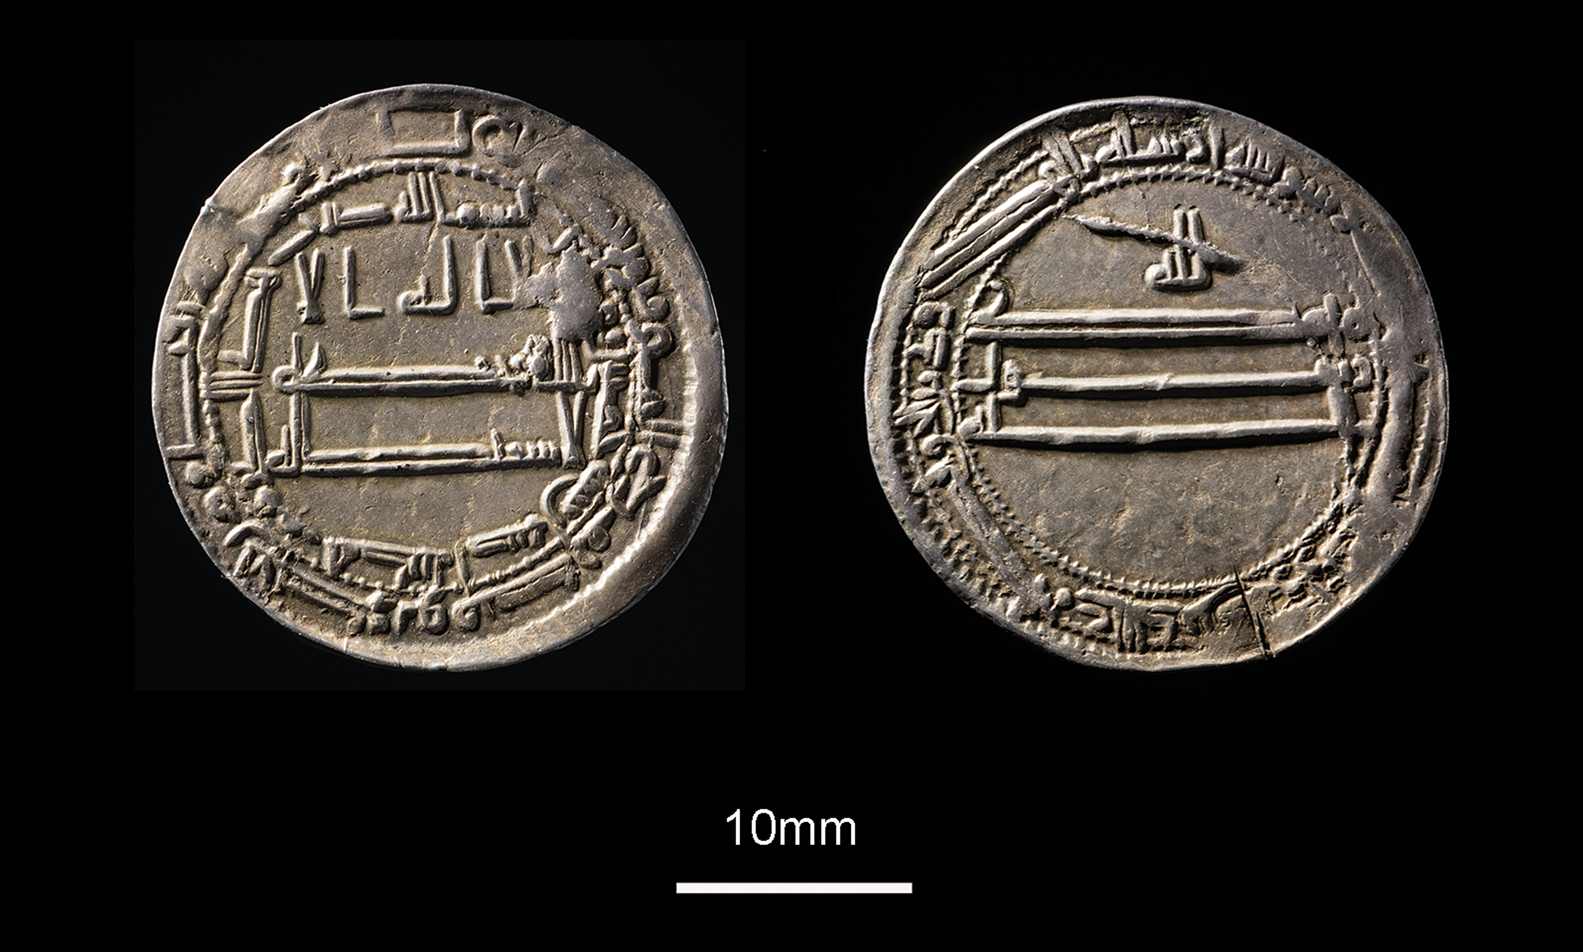
Dirham minted by Caliph al-Ma'mun in Isfahan, AD 820/1 (photograph by Ian Cartwright; © the authors).
Those scholars who have considered the sources of early Islamic silver have pointed to the reminting of older dirhams already in circulation and the coining of recycled, pre-Islamic Sasanian silver collected as booty and taxes by new Islamic rulers (Sears Reference Sears1997: 9; Bessard Reference Bessard2020: 187–8). These scholars have also recognised that new silver mining would have been required to meet the demands of producing such large numbers of fine-silver coinage. There are long-standing historical hypotheses, originating in the written accounts of tenth-century and later Arab geographers, that early Islamic silver mining was focused in Arabia and Central Asia: an area encompassing Khorasan (a historical region of north-east Iran, Turkmenistan and Afghanistan) and Transoxiana (between the Oxus and Jaxartes Rivers; Dunlop Reference Dunlop1957; Lombard Reference Lombard2001; Bessard Reference Bessard and Berg2017: 197–8; Reference Bessard2020: 189–91; Morony Reference Morony2019: 189–91). Guided by this literature, historians have located archaeological evidence of mining in places such as Radrad in Yemen and Shash in Central Asia as key sources of silver for the early Caliphate (Dekówna Reference Dekówna1971; Morony Reference Morony2019: 191; Bessard Reference Bessard2020: 190).
Yet, this text-led approach is problematic. The written accounts were composed after c. AD 900, following a major eastward shift in silver minting and trade flows linked to the rise of the Samanids in Central Asia; the extent to which this influenced contemporary writers is unclear. Moreover, it can be difficult to determine from the evidence of mining archaeology alone when, and on what scale, particular mines were active. At the same time, the potential sources of Islamic silver production elsewhere, in regions such as North Africa and central Iran, remains largely unexplored (for exceptions, see Eustache Reference Eustache1971–2; Stöllner & Weisgerber Reference Stöllner and Weisgerber2004). The question therefore remains open: from what range of sources did the early Islamic state obtain the silver needed for the production of dirhams?
Identifying silver sources through geochemistry
We propose that the understanding of early Islamic silver sources can be advanced by a new approach, that of geochemistry, using lead isotope and elemental data from precisely dated Islamic dirhams. Combined lead isotope and elemental analysis is a powerful tool for inferring the geological provenance of raw materials, yet interpretations must contend with potential challenges (Killick et al. Reference Killick, Stephens and Fenn2020; see also online supplementary material (OSM)). Recycling objects made of silver from different sources can homogenise geochemical values, weakening the visibility of the link between an individual mine and end-product; similarly, refining (cupellation) to purify silver requires the addition of lead, potentially resulting in foreign lead contamination. It is also possible that different ore bodies have overlapping isotope values. These concerns are acute in the study of silver coinage because of the recycling of old coin stock for reminting and the refining required to control metal purity across a standardised currency (e.g. Guénette-Beck et al. Reference Guénette-Beck, Meisser and Curdy2009).
In the case of Islamic dirhams, however, these potential complications are minimised by three factors. First, dirhams were produced over a geographically wide area, extending across regions with distinct geological ore formations, thus diminishing the risk of overlapping isotopic signatures. Second, Islamic policy allowed silver coins to circulate in perpetuity and across the entire Caliphate, meaning that old and newly minted dirhams circulated together and inter-regionally (Shatzmiller Reference Shatzmiller and Klemm2013: 277–8). The mixed composition of coin hoards within the Caliphate (Lowick Reference Lowick1975, Reference Lowick1983) indicates a lack of systematic reminting and therefore limited centralised recycling of coinage. Third, our recent metallographic work on a subset of the dirhams analysed here established that a large proportion (21 of 26 coins) were minted from silver that was never cupelled, either for reminting or at the original point of extraction from the ore (Merkel Reference Merkel2021). The sampled dirhams are predominantly issues of the major mints of Wasit and Baghdad, but also include other mints in Abbasid Iran and Central Asia. While we recognise that the use of dry silver ore (rather than lead-based galena) probably depended on availability, and may have fluctuated across time and space, the apparently common use of non-cupelled silver at the major mints is notable. The supply of freshly produced, non-cupelled silver from rich, dry silver ore diminishes the potential for lead contamination via cupellation, which helps to preserve the isotopic link between source and final product.
Materials and method
Dirhams have been subject to extensive elemental analyses, via a range of methods, in studies going back to the late nineteenth century (see Tables S1–S4). However, these studies have sought primarily to characterise the alloy and/or fineness of the silver, rather than to identify its origins; moreover, provenance studies require lead isotope analyses of silver which, to date, have only been conducted on a small scale (Table S1).
To capture and analyse lead isotope and trace element data, in this study we use (MC)-ICP-MS (multicollector inductively coupled plasma mass spectrometry) and LA-(MC)-ICP-MS (laser ablation multicollector inductively coupled plasma mass spectrometry). We examine a sample of 111 well-preserved and precisely dated dirhams minted during the Umayyad (AD 661–750) and early Abbasid (AD 750–900) eras. We amalgamate the resulting data with those of previous lead isotope analyses of 32 dirhams (Tables S2–S10). Our sample encompasses the four major geographical regions of the Caliphate (North Africa, Iraq, Iran and Central Asia) between c. AD 700 and 900, with particular emphasis on the most prolific mints during periods of high output (Figures 2 & S1). While the dataset represents a sample-size that is an order of magnitude larger than comparable archaeometric provenancing studies (e.g. Angelini et al. Reference Angelini, Canovaro, Venturino and Artioli2019), the vast extent of the Islamic territories means that not all mints or time periods can be investigated here. Instead, we propose an overarching model of silver sources for the Umayyad heartlands and early Abbasid North Africa, Iraq, Iran and Central Asia, omitting the Spanish Emirate, the Caucasus and small-scale local silver sources available to particular mints.
Number of dirhams (n) analysed by mint. Orange = Umayyad, blue = Abbasid period (figure by the authors).

We merge these new coin data with geochemical data from published sources on multi-period archaeological silver and lead artefacts from the same geographical areas, as well as with lead isotope values for silver-lead ores from Islamic-ruled and border regions spanning North Africa, the Arabian Peninsula, the Middle East and Central Asia. In addition to traditional lead isotope diagrams, we used back-calculation of model age (T), initial 238U/204Pb (μ) and initial 232Th/ 238U(κ) to identify the geological context of potential source ores (Albarède et al. Reference Albarède, Desaulty and Blichert-Toft2012). We integrated the results with geographical, historical and archaeological data to identify (or exclude) correlations between mints and specific ore bodies (see OSM1 Materials and Methods and OSM2 Interpretation of Results).
Despite the reasoning set out above, we do not discount the possibility of low-level recycling or occasional cupellation among the sample coins. Indeed, we do find evidence of the recycling of Sasanian silver at the very start of dirham production, alongside fresh mining. Nonetheless, the dataset as a whole signals regional silver stocks, linked to localised ore geochemistry, that are typically neither mixed nor subject to secondary cupellation. The geochemical results indicate a massive and geographically widespread exploitation of silver-bearing ores under the Abbasids, which not only omits Arabia but also includes regions not previously identified as significant silver suppliers, including north-west Africa, central Iran and the Islamic/Byzantine frontier in present-day south-east Turkey (Figure 3).
Early Abbasid mints and mines linked by lead isotope data. Map showing the location of early Islamic mints of the dirhams considered in this study. Potential mining region indicated by crossed shovel and pick. Arrows depict proposed flow of silver from mining region to mint between AD 773 and 900. Bipartite network of mints and potential ore sources (period AD 773–900); thin lines: evidence from single dirham analysis; thick line: three or more dirham analyses (figure by the authors).

Results and discussion
Umayyads, re-used Sasanian silver and silver mined in Iran
The Umayyads came to power following the great Arab-Muslim conquests of the seventh century in the Middle East (Syria, Iraq, Egypt, Iran) and North Africa, initiating production of dirhams c. AD 698. The dominant dirham mint (and army garrison) Wasit (Iraq) was located far from known silver sources, leading modern scholars to speculate about the sources of Umayyad silver. Influenced by the tenth-century Yemeni writer al-Hamdani, historians have argued that the Umayyads mined silver in Arabia, particularly at the famous silver mine of Radrad (Jabali, Yemen) and in Saudi Arabia (Dunlop Reference Dunlop1957; Morony Reference Morony2019: 188; Bessard Reference Bessard2020: 190). Another parallel possibility is that silver arrived in Wasit as taxes and/or booty from newly conquered territories such as North Africa (from AD 702) and Spain (from AD 711; Sears Reference Sears1997: 417). Historians have further suggested that the Umayyads melted down silver from well-stocked Sasanian treasuries that were captured during the Islamic conquests (from AD 711; Sears Reference Sears1997: 417) (Bessard Reference Bessard2020: 196–7).
Our dataset includes 29 Umayyad dirhams from 11 different mints, spanning the period AD 701–740 (Figure 2, Table S2). Despite their diverse geographical origins, the earliest coins are isotopically and chemically identical to earlier, pre-Islamic, Sasanian silver plate and coin (drachms; Figures 4A, 5 & S6a). This result confirms those of earlier elemental studies, which linked Umayyad dirhams to Sasanian silver through their consistent gold levels (Gordus Reference Gordus, Hall and Metcalf1972; Gondonneau & Guerra Reference Gondonneau and Guerra2002). A subset of coins from the current study demonstrate homogeneous gold, copper and bismuth contents, and lead isotope ratios that cluster in the centre of the Sasanian lead isotope field, which suggests derivation from heavily recycled Sasanian silver stock (Figure S8). Enormous quantities of silver plate and coin were seized from treasuries during the Muslim conquest of the Sasanian Empire (Sears Reference Sears1997: 397–8). The analytical data suggest that this silver fuelled the earliest Islamic minting.
Umayyad and Abbasid North African, Iraqi and Iranian dirham datasets: A) comparison of Umayyad dirhams and Sasanian plate/coin and potential ore sources; B) comparison of North African dirhams and ore from Morocco and Tunisia; C) isotopic and D) elemental shift in Iraqi dirhams minted before and after AD 773. For data references, see OSM (figure by the authors).

Box-whisker plots contrasting source-related elements of Sasanian, Umayyad and Abbasid datasets. The plots present the gold content of Sasanian coin and plate (Harper & Meyers Reference Harper and Meyers1981; Gondonneau & Guerra Reference Gondonneau and Guerra2002) and all dirhams from the Umayyad dataset and the main regions and/or major mints of the Abbasids (figure by the authors).

Scholars have also recognised that recycled silver alone was insufficient to sustain minting on the scale pursued by the Umayyad caliphs, although the lack of silver ore in the vicinity of Wasit has raised questions as to which mines might have been exploited (Sears Reference Sears1997: 8–9, 416–7; Bessard Reference Bessard and Berg2017: 197). In both our own data and those of earlier studies, we observe that between AD 717 and 721 there was an abrupt decrease in the copper content (and thus increase in silver fineness) of Umayyad dirhams at the chief mint of Wasit, from approximately six per cent copper to fine, unalloyed silver (Figure S7). Our lead isotope data indicate consistent ratios before and after this shift, including from dirhams whose silver was never cupelled (Figure S6). We can therefore rule out the recycling and cupelling of earlier, more debased, Umayyad silver, or the mixing of silver from new and/or diverse sources, as might be expected if silver reached Wasit from newly conquered territories. It appears that Wasit was supplied with freshly mined, fine silver from the same or geochemically similar sources exploited by the Sasanians.
In contrast to the account of al-Hamdani, we find no evidence that Arabian silver fuelled Umayyad dirham production. The lead isotope ratios of Umayyad dirhams are inconsistent with that of ore and slag from Radrad, and indeed with all known Arabian sources (Figures 4A & S6b). Instead, our results locate freshly exploited silver ore sources in the heart of the Sasanian Empire: Iran, particularly in north-west (Urumieh-Dokhtar zone), north-central (Alborz zone) and west/central Iran (Sanandaj-Sirjan and Central Iran zones) (Figures 4A & S6b). Archaeological ceramic evidence, as well as radiocarbon dates, signal active silver mining during the late Sasanian/early Islamic period in Iran, specifically at Nakhlak and Duna (Stöllner Reference Stöllner, Stöllner, Slotta and Vatandoust2004; Stöllner & Weisgerber Reference Stöllner and Weisgerber2004). Previously, apart from the region of Khorasan in the north-east part of the country, Iran had been considered to be an insignificant silver supplier to the early Islamic Caliphate (Morony Reference Morony2019: 187, 212). The results reported here show that Umayyads not only re-used Sasanian silver stock, but also gained direct access to the Iranian ore base that supplied it. The Abbasid revolution in AD 750 marks a transformation in the mining and supply of silver, with a massive expansion in the production of fine-silver dirhams; in the next section, we provide geochemical evidence for a silver mining boom across four key territories.
Abbasid North Africa: Moroccan silver travelled across the Maghreb
North Africa has long been viewed as suffering from a period of economic decline following the Arab Conquests in the late seventh century, a view made difficult to counter by a lack of direct archaeological evidence for long-distance exchange routes and trade goods crossing the region (Fenwick Reference Fenwick2013). Nevertheless, in the late eighth century, North African mints produced one quarter of the silver currency of the entire Islamic Caliphate (Noonan Reference Noonan1986: 145–54). Until now, the source of this silver has been speculative: two possibilities are the use of Byzantine silver arriving via the port of Carthage and silver mined from the Atlas Mountains of Morocco (Fomin Reference Fomin, Jonsson and Malmer1990). Thanks to recent isotope analysis characterising silver ore deposits across North Africa (e.g. Milot et al. Reference Milot, Baron and Poitrasson2018), it is now possible to demonstrate direct links between North African silver mines and dirhams.
We present analysis of 12 North African dirhams from three mints (Kairouan and al'Abbasiya in the Abbasid province of Ifriqiya, and Tughda in the Maghreb, variously under the control of the Abbasid Caliphs, Idrisids and Khajirites), all dating from the AD 770s–790s (Figure 2, Table S3). The geochemical signatures of these coins make it possible to rule out Byzantine silver sources, owing to their extremely low gold (Figure 5), which contrasts with the high gold content of eighth-century Byzantine silver coins (AD 741–780; Gordus & Metcalf Reference Gordus and Metcalf1970/72).
Instead, the lead isotope ratios of most North African dirhams suggest that their silver was sourced from Morocco, specifically from mineralisation with young geological ages such as the Rif, Atlas and Anti-Atlas domains, including Imiter and Jebel Aouam in Central Morocco, where there is archaeological and documentary evidence for pre-Islamic and medieval mining (Rosenberger Reference Rosenberger1964; Milot et al. Reference Milot, Baron and Poitrasson2018; Figure 4B). We suggest that, to reach Kairouan and al'Abbasiya, the silver from Morocco travelled eastwards via overland routes connecting the western Maghreb with the north-east province of Ifriqiya (Figure 3). We note, too, that Morocco was taken over by the Idrisid dynasty from AD 789. While coin production continued at local mints, including Tughda, this date corresponds with an abrupt decline in mint production at Abbasid al'Abbasiya (Noonan Reference Noonan1986: 150–2; Fomin Reference Fomin, Jonsson and Malmer1990: 74). It is possible that political regime changes restricted Abbasid access to North African silver sources.
The data also signal a hitherto unrecognised ore source for North African dirhams. Three further dirhams minted in Kairouan (modern-day Tunisia) have elevated bismuth and lead isotope ratios consistent with lead-based deposits in Tunisia, particularly in the Nappe zone of northern Tunisia (Figures 4B, S9 & S10) although there is an overlap with less well-studied, geologically related deposits in northern Morocco. Tunisia is not known as a potential source of silver during the Caliphate (Lombard Reference Lombard2001). However, the Kairouan mint continued to produce coins in the late eighth century, after production at al-Abbasiya declined, a pattern that does hint at a separate silver source (Noonan Reference Noonan1986: 151). Recent archaeological work has highlighted pre-Islamic silver mining at Slata and/or Bou Jaber in the Domes zone, and also further north at Djebba and/or Kebbouch, just to the south of the Nappe zone (Delile et al. Reference Delile2019). The data presented here suggest this activity resumed, shifting to the north of Tunisia, after the Arab invasion.
Abbasid Iraq: silver reached Baghdad from the Islamic–Byzantine frontier
In c. AD 762, the Abbasid Caliph Al-Mansur established a new capital, Baghdad (Madinat al-Salam), at the closest point between the Tigris and Euphrates rivers. Baghdad developed into a major commercial centre, its mint producing an estimated 40 per cent of the Caliphate's coin output over the next seven decades (Figure S11). Despite this production, Iraq has no silver-bearing ores, so Baghdad must have relied on silver imports. It has been suggested that Baghdad was served by the Yemen mines (Shatzmiller Reference Shatzmiller and Klemm2013: 80–1). Another possible source of silver is dirhams from North Africa. The latter circulated freely in Iraq from the 780s to the early ninth century and it has been postulated that they were melted down, refined and reminted into new issues at the Baghdad mint (Heidemann Reference Heidemann2011: 457).
We analysed 40 dirhams from Baghdad (minted AD 765–942), and eight dirhams from other Iraqi mints (Figure 2, Table S4). From the geochemical data we can exclude Arabian mines as a source of silver for Iraqi dirhams (compare Arabian ore in Figure 4A with Iraqi mints in Figure 6A). There is also no evidence among the analysed coins for the reuse of North African silver, even during the last decades of the eighth century. The two groups are unrelated isotopically; North African dirhams are characterised by extremely low gold content, whereas Baghdad (and other Iraqi) coins have high gold levels. Indeed, the latter have the highest gold content across all dirham groups, itself an indication of silver sources unique to the region (Figure 5).
Lead isotope ratios of early Abbasid dirhams from Iraq, Iran and Central Asia: A) Abbasid LI datasets; B) Selection of ore and artefact reference data: Taurus ore, artefacts, Iranian ore, ore from the western Tien Shan in Central Asia (see OSM for references). Note that the linear arrays are included as visual markers only (figure by the authors).

Instead, the data reveal an initial use of Iranian sources of silver followed by a marked change in silver supply in AD 773–4, which corresponds to a particularly prolific period of coin production at Baghdad (Figure 4C & D). From this time, the Iraqi dirhams possess distinctive lead isotope ratios, and higher gold and lower bismuth contents than Iranian issues, indicating the use of new silver sources. Twenty-six dirhams have distinctive lead isotope ratios for which we can find just one ore source: a lead-zinc-silver ore deposit at Pirajman in the upper Euphrates watershed of the eastern Taurus mountains (Figures 6, 7 & S12). There, medieval ceramics have been recovered in association with smelting slag from lead-silver production (Seeliger et al. Reference Seeliger, Pernicka, Wagner, Begemann, Schmitt-Strecker, Eibner, Öztunali and Baranyi1985: 634–5). A further, potential, Taurus Mountain ore source is linked to a smaller group of 13 dirhams. It is located further to the west, in the rich mining area of Bolkardağ in south-central Turkey (Aladağ and Esendemirtepe outlier groups) (Figures 6, 7 & S12). Western Taurus sources are thought to have been used for silver and other metals by the Byzantines in the sixth and seventh centuries (Eger Reference Eger2017: 258; compare Scott Reference Scott1990; Yener et al. Reference Yener, Sayre, Joel, Özbal, Barnes and Brill1991; Ströbele Reference Ströbele, Daim, Forlas, Horst and Tsamakda2017), but it has not previously been suggested that these were also exploited by the Caliphate.
Model age (T) and 238U/204Pb (μ) and 232Th/238U (κ) ratios of reference data and Abbasid dirhams from Iraq, Iran and Central Asia. Parts A and B correspond to Figure 6. The linear arrays mark the groups defined in Figure 6A. From left to right, the model ages of the lead from Taurus deposits reflect geologically young crust and recent volcanism; the lead from the Iranian deposits are Cenozoic to late Palaeozoic and the Tien Shan deposits reflect older mineralisation in Palaeozoic crust (figure by the authors).

Thus, the increase in coin production at the mint of Baghdad appears to be connected with sudden access to silver sources upriver in the Taurus Mountains along the Arab–Byzantine frontier. This was a militarily contested zone, characterised by frequent raids. The standard position has been that the raids were ritualistic incursions within a long-standing Holy War in a resource-poor mountain area (e.g. Kennedy Reference Kennedy2004: 54–5). Recent scholarship has re-evaluated this view, however, highlighting valuable natural resources available in the region, including timber, horses, cobalt, lead, copper, tin, iron, zinc and, critically, silver (e.g. Eger Reference Eger2017: 257–63).
Our findings add weight to this re-evaluation. We contend that the raids may have been motivated, in part, to secure mineral resources vital to the output of the Caliphate's most productive mint, with the many fortress sites in the area potentially playing a strategic role in protecting silver mines. The Byzantine eastern-border region, including the area around Pirajman, was a focus of Byzantine raids and Islamic refortification from the AD 750s to the 770s (Eger Reference Eger2017: 124–6). The Abbasid fortress of Shimshat, north-west of Pirajman, was captured by the Byzantines c. AD 770, but was back in Muslim hands by 775. The securing of this fortress, and nearby precious mineral resources, may explain the upsurge in minting at Baghdad from c. AD 770–80 (Figure S11). The Tigris and Euphrates rivers could have served as transport routes taking the silver downstream from the mountain region to the Iraqi mints.
Abbasid Iran: mints supplied by ancient silver mines in central Iran
The literary sources provide little information about mining on the Iranian Plateau during the Abbasid period. The data cited above for Umayyad coinage point to the exploitation of ore sources from north, western and central Iran during the early eighth century. We find that these same ore sources continued to be exploited under the Abbasids to supply the prominent mints of Tehran (al-Muhammadiyya, northern Iran), Isfahan (central Iran) and Shiraz (south-central Iran). The data for 22 Abbasid dirhams minted in Iran between AD 765 and 884 (Table S4) reveal a consistent spread of lead isotope ratios that broadly match the distribution of Umayyad and pre-Islamic, Sasanian silver (Figure 6). In particular, the famous mining region of Nakhlak, central Iran, has produced ore, slag and litharge (PbO) with lead isotope values consistent with those of the analysed dirhams (Figures 6, 7 & S12). Iran—outside of Khorasan—appears to have been a vital source of fresh precious metal for the Umayyads and early Abbasids.
Abbasid Central Asia: silver mined on the western Tien Shan supplied regional mints
Abbasid Central Asia includes the historical regions of Khorasan and Transoxiana. It was a focus of minting under the Samanids (tenth century) and, thanks to the writings of tenth-century and later Muslim geographers, has long been considered the dominant supplier of silver for the entire Caliphate, including during the period c. AD 700–900 (Dunlop Reference Dunlop1957; Morony Reference Morony2019: 190–91; Bessard Reference Bessard2020: 197).
Our analyses, however, suggest that early Islamic mines in this area were of regional importance only. Based on its high bismuth contents and lead isotope ratios, silver from the major late-ninth-century mine of Panjhir in Afghanistan can be excluded as a source of silver for early Islamic dirhams minted in the region (Merkel Reference Merkel2016: 73–4, 248–53). Lead isotope ratios of 22 dirhams from far-eastern provinces instead reveal two other candidate sources (Figures 6 & S12). One is the Ilak mining region on the western edge of the Tien Shan Mountain Range; this is located close to the Talas River, the site of the Battle of Talas in AD 751, at which the Abbasids defeated the Tang dynasty for control of Transoxiana (Figure 3). The second candidate cannot be precisely pinpointed but appears to have supplied mints in Afghanistan/Turkmenistan (Balkh, Merv) and may be located in Khorasan.
Significantly, mines in Central Asia did not supply all mints in that region. Four dirhams from Merv and Zaranj, the most westerly Khorasani mints, are geochemically similar to Iranian dirhams, with one coin from Zaranj being made of silver that had never been cupelled (Merkel Reference Merkel2021). This suggests that these mints received silver that had travelled eastwards from Iran (Figure 6). We also note that no other Abbasid mints share geochemical signatures linked to mines in Transoxiana. Silver deposits in Central Asia do not appear to have supplied silver beyond the region before the tenth century.
Conclusion
We have sought to cast fresh light on the subject of early Islamic silver sources through large-scale trace element and lead isotope analyses of Umayyad and Abbasid dirhams (c. AD 700–900). Our approach has been aided by a combination of factors which diminish the potential challenges posed to silver provenancing through the practices of recycling and cupellation: a broad geographical scope, a lack of systematic dirham re-minting and the widespread use of dry silver ore. Rather than a model in which silver from diverse sources was centralised, refined and re-minted, the geochemical data presented here point to regional ore supplies, with localised networks linking mines to mints and little evidence for silver travelling trans-regionally. While we have little information about how silver was transported from mine to mint, tenth-century written sources describe the taxation of freshly mined silver by the governing official in Iran and the transport of ingots to administrative centres in Central Asia (Allan Reference Allan1976: 42–3). It seems likely that silver was cast into ingots close to the site of extraction, travelling overland by pack animals or by river routes to nearby mints.
The data here challenge existing text-based narratives of early Islamic silver mining, offering a new, geochemically based model of Umayyad/Abbasid wealth resources. While we find clear evidence for the recycling of Sasanian silver under the Umayyads, evidence of large-scale recycling under the Abbasids is absent. Instead, the data stress the importance of new silver mining to the Islamic economy.
The quantities of silver traditionally said to have come from mines in Arabia, including Yemen, and Central Asia during the time frame considered here appear to be overstated. Simultaneously, our identification of potential mining locations across the Caliphate—including in previously overlooked areas such as Tunisia, central Iran and the Taurus Mountains—reveals the complexity and vibrancy of the Islamic economy and outlines ways in which the acquisition of silver may have influenced contemporary geopolitics, particularly at the Arab–Byzantine frontier. We propose that the fluctuating character of Islamic minting may, in some instances, be directly linked to successive changes in control and loss of silver ore sources, whether territorial or through mining boom–bust cycles. It is striking that, during these times, mints decreased or suspended output rather than issuing debased coinage. This policy may relate to the need for a fine, standardised and regionally interchangeable silver currency across a vast area.
More broadly, we have demonstrated the significance of geochemical approaches for provenance studies. The application of lead isotope analysis for the provenancing of silver need not always be constrained by recycling and refining, and can generate meaningful data. The results presented here indicate that silver stocks supplying mints were sourced regionally from silver-rich ore minerals and were not subject to large-scale, inter-regional mixing. Recycling and refining are culturally specific practices. The extent to which this pattern is reflected more widely in other past societies has yet to be fully established, but initial studies indicate the use of native silver and silver-rich minerals in contexts such as Bronze Age Europe (Murillo-Barroso et al. Reference Murillo-Barroso, Bartelheim, Cortés, Onorato and Pernicka2012) and the pre-Columbian Americas (Kałaska et al. Reference Kałaska, Mathur, Kamenov, Chyla, Prządka-Giersz and Giersz2022). Lead isotope analysis therefore has tremendous potential in the study of diverse regions and societies to advance understanding of mining locations, silver trade and wider economic structures.
Acknowledgements
We are grateful to Stefan Heidemann, Marek Jankowiak and A. Asa Eger for discussing aspects of this article and to staff at the Fitzwilliam Museum, Cambridge, the Coin Chamber, National Museum of Finland and the Department for Oriental Studies, University of Oxford, for facilitating access to dirhams. Thank you to Jane Barling, Alan Hsieh, Jack Longman and Chris Standish for their roles in analytical development and support and to Natasha Eniosova for providing access to dirham analyses from Moscow. We thank the two anonymous reviewers for their constructive and helpful comments.
Funding
This research was carried out under a European Research Council Starter Grant awarded to Jane Kershaw (Action number 802349).
Supplementary material
To view supplementary material for this article, please visit https://doi.org/10.15184/aqy.2023.165.


 Open access