





Introduction
Dryland cereal grain production in the Northern Great Plains typically includes a crop-fallow rotation to allow for soil water recharge and nitrogen mineralization before the following crop year (Lenssen et al., Reference Lenssen, Johnson and Carlson2007; Gan et al., Reference Gan, Hamel, O'Donovan, Cutforth, Zentner, Campbell, Niu and Poppy2015). However, it has been well documented that in semiarid systems, only 25–40% of precipitation is effectively stored in the soil on fallow years, leading to increased concerns related to soil erosion and sustainability (Hatfield et al., Reference Hatfield, Sauer and Prueger2001). Diversifying cropping systems, such as incorporating a cover crop in a wheat-fallow system, has been shown to reduce erosion, and improve soil organic carbon and nitrogen, which leads to retention of organically bound nutrients and improved soil hydrology (Franzluebbers and Stuedemann, Reference Franzluebbers and Stuedemann2008b; Blanco-Canqui et al., Reference Blanco-Canqui, Shaver, Lindquist, Shapiro, Elmore, Francis and Hergert2015). In addition, cover crops can effectively suppress weeds in various production systems (Teasdale and Abdul-Raki, Reference Teasdale and Abdul-Raki1998; Kruidhof et al., Reference Kruidhof, Bastiaans and Kropf2008; Hodgdon et al., Reference Hodgdon, Warren, Smith and Sideman2016). Therefore, the introduction of cover crop systems can reduce off-farm inputs while producing similar profits to more conventional systems (Davis et al., Reference Davis, Hill, Chase, Johanns and Liebman2012).
In a wheat-cover crop rotation, cover crops must be terminated prior to the planting of wheat. Conventional cover crop termination typically includes tillage, herbicide, crimper roller or a combination of methods, all of which represents a cost with no immediate return, potentially limiting producer adoption. However, cover crops including annual grasses, small grains and forage legumes following grain or fiber crops could provide a source of high-quality forage for livestock (Franzluebbers and Stuedemann, Reference Franzluebbers and Stuedemann2007, Reference Franzluebbers and Stuedemann2008b). In addition, manure deposited from grazing cattle has been demonstrated to increase soil organic carbon accumulation compared to a legume-grain crop rotation and a conventional fertilizer-based system, presumably due to manure taking longer to decompose than plant residue (Hassink, Reference Hassink1992; Paustian et al., Reference Paustian, Parton and Persson1992; Drinkwater et al., Reference Drinkwater, Wagoner and Sarrantonio1998). Therefore, an integrated crop-livestock system that utilizes livestock grazing as a mechanism to terminate cover crops is proposed to better pair nutrient demand and availability compared to other termination methods, mutually benefiting both livestock and crop producers (Russelle et al., Reference Russelle, Entz and Franzluebbers2007; Franzluebbers and Stuedemann, Reference Franzluebbers and Stuedemann2008a; Liebig et al., Reference Liebig, Tanaka, Kronberg, Scholljegerdes and Karn2012). Although cover crops offer an opportunity for a high-quality forage source for livestock grazing, previous research evaluating the integration of livestock grazing on cover crops focuses solely on the following crop production and soil attributes and evaluates little if any metric of the effects of cover crop mixtures on animal nutrition with the exception that grazing cover crops could expose livestock to toxic levels of nitrates (Brummer et al., Reference Brummer, Johsnon, Obour, Caswell, Moore, Holman, Schipanski and Harmoney2018; Farney et al., Reference Farney, Shoup, Rethorst, Blasi and Holman2018; Lenz et al., Reference Lenz, Kern, Orvis and Drewnoski2019b).
Season-long cover crops, planted in the spring, are most often used by producers who intend to graze or harvest the cover crop as forage (Brummer et al., Reference Brummer, Sedevic, Nester, Gaugler and Schaunaman2015). Conventional wisdom suggests that the greater biomass a cover crop adds to a system, the greater the soil organic C accumulation and available forage for livestock grazing. Therefore, increasing species and functional group diversity of cover crop mixtures has been promoted as a method to increase soil organic C by producing greater above and below-ground biomass compared to a single-species mixture (Faé et al., Reference Faé, Sulc, Barker, Dick, Eastridge and Lorenz2009; Wortman et al., Reference Wortman, Francis, Bernards, Drijber and Lindquist2012; Blanco-Canqui et al., Reference Blanco-Canqui, Shaver, Lindquist, Shapiro, Elmore, Francis and Hergert2015). The use of diverse cover crop mixtures has been demonstrated to have less nutrient leaching than single species cover crops due to the complementarity of root systems in a mixture (Blanco-Canqui et al., Reference Blanco-Canqui, Shaver, Lindquist, Shapiro, Elmore, Francis and Hergert2015). However, the advantage of mixtures over monocultures in biomass production appears dependent on timely precipitation following cover crop seeding (Liebig et al., Reference Liebig, Hendrickson, Archer, Schmer, Nichols and Tanaka2015).
Developing cover crop mixtures that include species from different functional groups can also provide multiple system benefits (Sanderson et al., Reference Sanderson, Johnson and Hendrickson2018). For example, legumes can provide both nitrogen fixation and pollinator benefits (USDA-SARE, 2015), while brassicas have been shown to suppress weeds, reduce fungal diseases and nematode populations due to the decomposition of glucosinolate compounds and an early rapid canopy development (Weil and Kremen, Reference Weil and Kremen2007; Kruidhof et al., Reference Kruidhof, Bastiaans and Kropf2008; Lawley et al., Reference Lawley, Teasdale and Weil2012). Additionally, cereal grain species typically increase biomass and residue that protects against soil erosion (Weil and Kremen, Reference Weil and Kremen2007), while species with deep taproot, such as radish (Raphanus sativus), turnip (Brassica rapa), safflower (Carthamus tinctorius) and sunflower (Helianthus annuus) can reduce soil compaction, break the plow pan and increase rainfall infiltration (Merrill et al., Reference Merrill, Tanaka and Hanson2002; Weil and Kremen, Reference Weil and Kremen2007). Thus, the use of complex cover crop mixtures of functionally diverse species offers the potential to improve ecosystem services in various cropping systems (USDA-SARE, 2015; Hodgdon et al., Reference Hodgdon, Warren, Smith and Sideman2016; Sanderson et al., Reference Sanderson, Johnson and Hendrickson2018).
Although several cover crop species can be incorporated into a mixture, most are categorized as either cool-season and warm-season species. The fundamental difference between these two categories of cover crop species is the optimal temperature for growth. Cool-season forages including most cereal grains, brassicas and legumes can germinate at temperatures as low as 4°C with optimal temperature for growth near 20°C (Cooper and Taiton, Reference Cooper and Taiton1968; Nelson and Moser, Reference Nelson, Moser, Fahey, Collins, Mertens and Moser1994). Alternatively, warm-season species such as millet (Setaria italica), sorghum-sudangrass (Sorghum × drummondii), sunflower (H. annuus), soybean (Glycine max) and chickpea (Cicer arietinum) do not initiate growth until soil temperature nears 10°C with the optimal temperature for growth occurring between 30 and 35°C (Cooper and Taiton, Reference Cooper and Taiton1968; Nelson and Moser, Reference Nelson, Moser, Fahey, Collins, Mertens and Moser1994). Due to the differences in optimal growth, cool-season crops are often planted earlier in the spring compared to warm-season crops. Including both cool- and warm-season species in a cover crop mixture has been suggested to provide effective ground cover for soil erosion benefits (Sanderson et al., Reference Sanderson, Johnson and Hendrickson2018). However, early establishment of cool-season species could limit the potential for warm-season plants to contribute to forage biomass, thus, may require a later planting date to facilitate warm-season plant growth. Therefore, cover crop mixture and planting date can directly impact the timing of forage availability and quality for livestock grazing.
In general, cover crops are promoted worldwide due to the conservation benefits including reduced soil erosion, greater water infiltration and enhanced soil biological abundance and activity (Snapp et al., Reference Snapp, Swinton, Labarta, Mutch, Black, Leep, Nyiraneza and O'Neil2005; Myers and Watts, Reference Myers and Watts2015; Sanderson et al., Reference Sanderson, Johnson and Hendrickson2018). Nevertheless, the benefits of incorporating a cover crop rotation in a semi-arid cereal-based system are highly variable compared to the humid environments that the bulk of cover crop research has been performed (Blanco-Canqui et al., Reference Blanco-Canqui, Shaver, Lindquist, Shapiro, Elmore, Francis and Hergert2015). Although livestock grazing of cover crops could provide a low input alternative for beef cattle nutrition requirements while delivering a low-input cover crop termination method, previous research evaluating the integration of livestock grazing on cover crops focuses solely on the following crop production and soil attributes and evaluates little if any metric of the effects of cover crop mixtures on animal nutrition with the exception that grazing cover crops could expose livestock to toxic levels of nitrates (Brummer et al., Reference Brummer, Johsnon, Obour, Caswell, Moore, Holman, Schipanski and Harmoney2018; Farney et al., Reference Farney, Shoup, Rethorst, Blasi and Holman2018; Lenz et al., Reference Lenz, Kern, Orvis and Drewnoski2019b) The lack of information on the effect of cover crop mixtures on both cover crop biomass and forage quality for livestock grazing limits our understanding of the long-term sustainability of integrated crop-livestock systems involving cover crop grazing in dryland cereal grain production in the Northern Great Plains. Therefore, the objective of this research was to examine the effects of cover crop mixtures (cool-season, warm-season, a mixture of both cool- and warm-season) on cover crop biomass production, quality and the potential for nitrate toxicity on a dryland wheat-cover crop rotation.
Methods
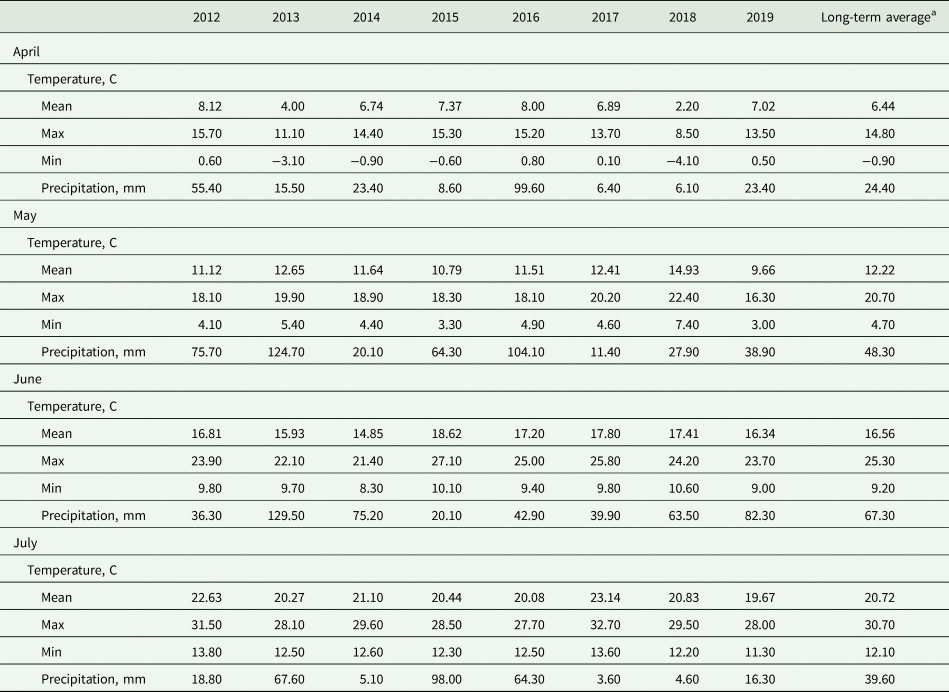
This research was part of a long-term study evaluating cover crops in a semi-arid region of the Northern Great Plains. Research was conducted at the Montana State University-Northern Agricultural Research Center near Havre, MT (48°29′N, −109°48′W) from 2012 to 2019. The research site is approximately 815 m above sea level, with an average annual precipitation of 305 mm. Soil is characterized as clay loam and classified as a Telstad-Joplin complex. The site is characterized as having 129 frost-free days and an average annual temperature of 5.94°C with an average high of 13.6°C and average low of 0.0°C. Weather data were collected onsite with official National Weather Service (NOAA) meteorological instruments. Recorded monthly mean, maximum and minimum temperatures and precipitation for April, May, June and July 2012 through 2019 and long-term averages (1916–2018) are presented in Table 1.
Monthly mean, maximum, and minimum temperature and precipitation for April, May, June and July 2012–2019 with long-term averages at Montana State University, Northern Agricultural Research Center
a Long-term average (1916–2018).
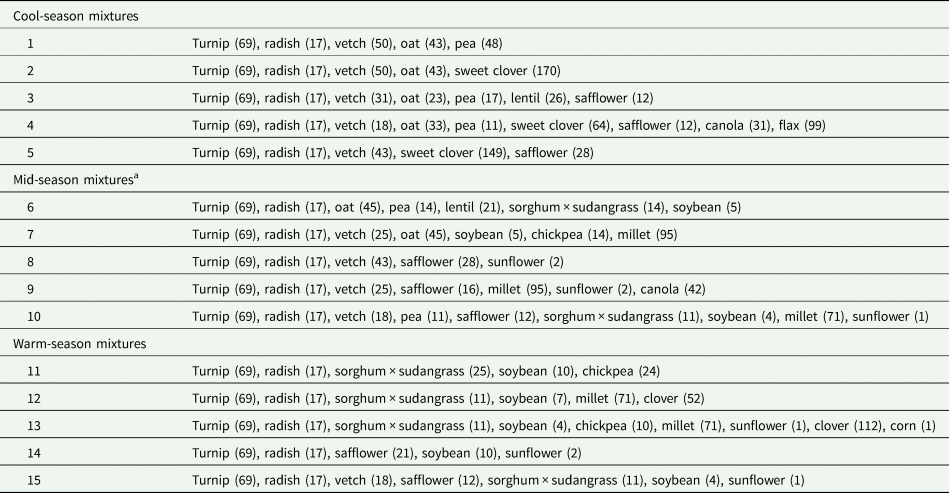
This experiment was conducted as a randomized-complete-block design, where 29 individual species were utilized in 15 different cover crop mixtures in a wheat-cover crop rotation (Table 2). Cover crop mixtures were classified into three treatment groups, including (1) cool-season species, (2) warm-season species and (3) cool- and warm-season species mixture (mid-season). Both the commodity crop (spring and winter wheat) and each of the 15 cover crop mixtures were present in each of two adjacent fields (three replications per field) for each year of the study (2012–2019). The cover crop mixtures were randomly allotted to plots (7.3 by 40.2 m) within each field the first year of the study and each treatment was planted in the same plot for the remainder of the trial in a wheat-cover crop rotation. Each block was separated by a barley (Hordeum vulgare) half-plot (3.6 by 40.2 m), which was later deemed an additional control of interest (barley control), as barley is the second most common grain crop in this region (USDA-FSA, 2020) and continuous cropping with a barley rotation is a common practice in the region (Carr et al., Reference Carr, Bell, Boss, DeLaune, Eberly, Edwards, Fryer, Graham, Holman, Islam, Liebig, Miller, Obour, A and Xue2021). All seeds for each species used in this trial were locally sourced and tested for germination prior to planting. Only seed sources with ⩾95% germination rates were utilized in the cover crop mixtures. Seed sources that failed to meet a 95% germination rate were then re-sourced and tested before mixing. Seeds were then mixed to cover crop specifications by research technicians at the Northern Agricultural Research Center in Havre, MT. Cover crop mixtures including legumes were inoculated with their respective Rhizobium/Bradyrhizobium strains during seeding.
Cover crop species list for each of the 15 cover crop mixtures grown for livestock grazing at Montana State University, Northern Agricultural Research Center between 2012 and 2019
a Mixture of cool- and warm-season species.
Turnip, Brassica rapa; radish, Raphanus sativus; vetch, Vicia villosa; oat, Avena sativa; pea, Pisum satuvum arvense; sweet clover, Melilotus sp.; lentil, Lens culinaris; safflower, Carthamus tinctorius; canola, Brassica napus; flax, Linum usitatissimum; sorghum × sudangrass, Sorghum × drummondii; soybean, Glycine max; chickpea, Cicer arietinum; millet, Setaria italica; sunflower, Helianthus annuus; clover, Trifolium repens.
Seeding rates (seeds per m2) are shown in parentheses behind each species.
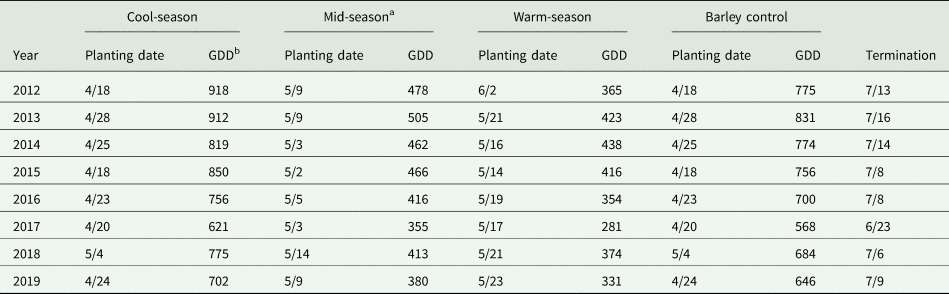
Following a glyphosate application, cover crop mixtures were planted according to their treatment groups using a 12-row ConservaPak hoe-type air seeder with 30 cm row spacing at a depth of 2.54 cm. Seeding rates were based on Montana Natural Resources Conservation Service recommendations adjusted for pure live seed, germination rate and the number of species in each cover crop mixture (Table 2; USDA-NRCS, 2021a). Cool-season mixtures were planted in the spring as soon as conditions allowed, mid-season 10–14 days later, and the warm-season 10–14 days after mid-season planting (Table 3). Cover crop planting dates were also based on Montana Natural Resources Conservation Service recommendations to ensure each cover crop was planted in the respective planting window (cool-season, early-April to mid-May; warm-season, mid-May to mid-June; mid-season, May), mimicking general planting dates of the region for each cover crop treatment group (USDA-NRCS, 2021b). All cover crop mixtures were fertilized at their respective planting dates (20-20-20; N-P-K) at a rate of 112 kg ha−1 to ensure cover crop establishment. Cover crop emergence was also measured via stand counts, with all cover crops successfully germinating at predicted rates with cool-season mixtures averaging 97 plants per m2 while mid- and warm-season cover crop treatment groups and the barley control averaging 75 plants per m2. All crop fields in this study have been managed as no-till for over 25 years.
Planting and termination dates for cover crop treatment groups grown for livestock grazing at Montana State University, Northern Agricultural Research Center between 2012 and 2019
a Mixture of cool- and warm-season species.
b Growing degree days, adjusted for cool- and warm-season crops.
Cover crop mixtures were typically terminated from late June to early July at anthesis of cool-season cereal species to avoid volunteer cereal grains in the following wheat crop. At the time of crop termination cool-season broadleaf species were typically vegetative and flowering while warm-season species were vegetative and budding. Cover crops were divided into three termination plots (7.3 × 13.4 m); herbicide, swathing and bailing, and grazing as part of a larger project evaluating the effects of cover crop and termination method on subsequent wheat yield and soil bacterial communities. Briefly, herbicide treated plots were treated with glyphosate at 2500 g ai per hectare, while the swathing and bailing mechanically cut cover crops at a height of 5.08 cm and bales were removed from the field. Cattle were grazed on the remainder of the plot with 8–10 animal units for approximately 2 days. Measurements of wheat production (Bourgault et al., this issue) and soil bacterial communities (Eberly et al., this issue) in response to cover crop treatment group and termination method are described in companion papers from this experiment.
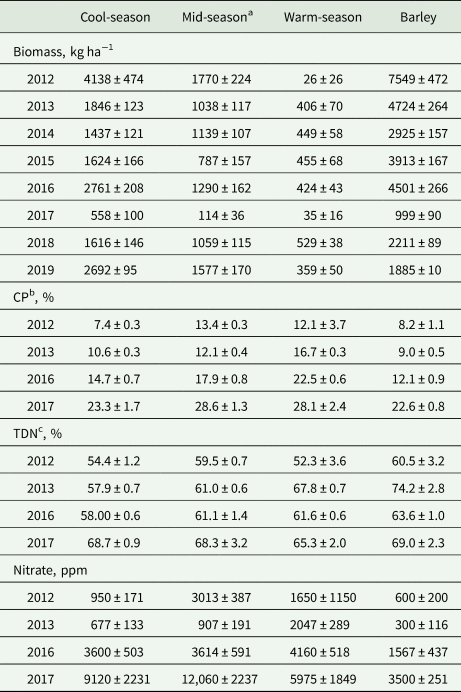
To determine forage quantity and quality at the time of cover crop termination, five rows of each swath and bale cover crop termination treatment were sampled using a forage harvester with a load bar and data logger to automatically record the fresh weights of the sample cut at a height of 5.08 cm (Almaco, Nevada, IA, USA). A subsample from each cover crop plot was then collected from the harvester, weighed fresh, placed in a forced-air oven at 40°C for 72 h, or until constant weight, and weighed again to calculate cover crop forage production on a dry matter basis (kg ha−1; Table 4). Cover crop dry matter forage production was estimated each year of the study period (2012–2019; Appendix S1). For 4 years within the study period (2012, 2013, 2016, 2017), the dried cover crop forage samples were ground to pass through a 2 mm screen in a Wiley mill and sent to a commercial lab (Midwest Laboratories, Omaha, NE, USA) and analyzed for crude protein (CP, %), total digestible nutrients (TDN, %) and nitrates (N03, ppm) as indicators of forage quality (Table 3; Appendix S2). Total digestible nutrients are an indicator of available energy and are calculated as the sum of the digestible protein, digestible crude fiber, digestible nitrogen-free extract and 2.25 times the digestible fat. Protein and energy are often considered the most important nutrients for grazing livestock, as they are required to support ruminal microbial activity. Finally, many popular cover crop species are nitrate accumulators that can be toxic to grazing livestock (Khorasani et al., Reference Khorasani, Jedel, Helm and Kennelly1997; Lenz et al., Reference Lenz, Farney, Kern, Orvis and Drewnoski2019a). Therefore, it is not recommended for pregnant cattle to graze forages with greater than 1500 ppm nitrates on a dry matter basis; however, 1500–5000 ppm on a dry matter basis is generally considered safe for non-pregnant livestock (Cash et al., Reference Cash, Funston, King and Wichman2002). Due to funding limitations, the 4 years of forage quality sampling took place at the initiation (2012, 2013) and the completion (2016, 2017) of a long-term cover crop project conducted at the Northern Agricultural Research Center.
Biomass production, crude protein (CP), total digestible nutrients (TDN), nitrate levels on a dry matter basis for cover crop treatment groups and barley control grown for livestock grazing at Montana State University, Northern Agricultural Research Center between 2012 and 2019.
a Mixture of cool- and warm-season species.
b Crude protein.
c Total digestible nutrients.
Forage production (kg ha−1), crude protein (%), total digestible nutrients (%) and nitrates (ppm) were analyzed using ANOVA (car; Fox and Weisberg, Reference Fox and Weisberg2011) with a generalized linear mixed model (lme4; Bates et al., Reference Bates, Maechler, Bolker and Walker2015). Cover crop treatment group and cover crop mixture nested within treatment group were considered fixed effects with plot nested within field (block) and year as a random intercept to compare overall cover crop treatment effects on response variables. Year was considered a random effect as it is not controllable, predictable or repeatable (McLean et al., Reference McLean, Sanders and Stroup1991; Moore and Dixon, Reference Moore and Dixon2015). Data were plotted and log transformed if needed to satisfy assumptions of normality and homogeneity of variance. An α ⩽0.05 was considered significant. Means were separated using the Tukey method when P < 0.05 (emmeans; Lenth et al., Reference Lenth, Singmann, Love, Buerkner and Herve2018). All statistical analyses were performed in R version 4.0.5 (R Core Team, 2020).
Results
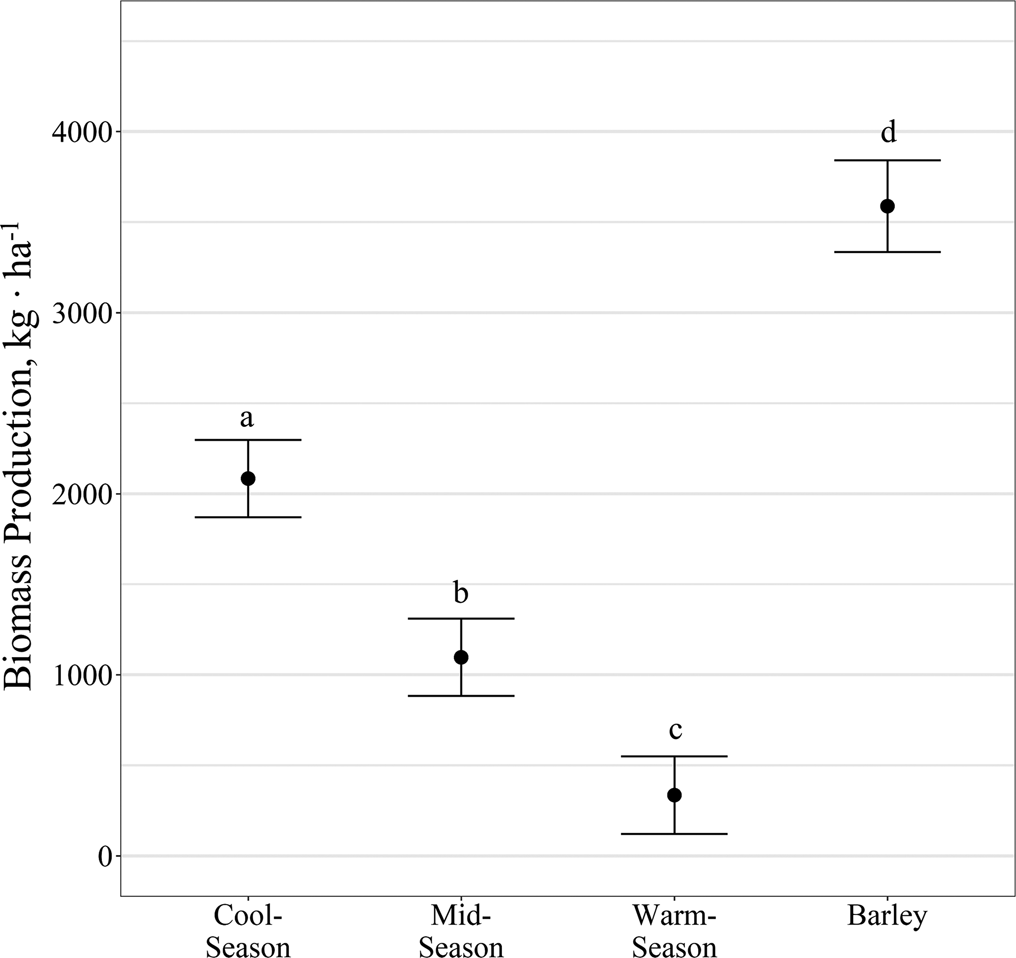
Cover crop mixture nested within treatment had an influence (P < 0.01) on biomass production (Table 5), where all mixtures containing oats (Avena sativa) had greater (P ⩽ 0.03) biomass production than the mixtures excluding oats within their respective treatment groups (cool- and mid-season). Additionally, cool-season cover crops including turnip, radish, vetch (Vicia villosa), oat and sweet clover (Melilotus sp.) produced on average 670 kg ha−1 more biomass (P = 0.02) than a similar mixture that replaced sweet clover with a combination of pea (Pisum satuvum arvense), lentil (Lens culinaris) and safflower. There was no effect (P ⩾ 0.88) of cover crop mixture on biomass production within the warm-season treatment group, averaging 335 kg ha−1. However, the barley control on average produced a minimum of 949 kg ha−1 more biomass than any other cover crop mixture regardless of treatment group (P < 0.01). When evaluating the effect of cover crop treatment group on forage biomass, the barley control produced the greatest (P < 0.01) amount of forage biomass when compared to cool-, mid- and warm-season cover crop treatment groups (3588 ± 253, 2084 ± 214, 1097 ± 214, 335 ± 214 kg ha−1, respectively; Fig. 1). Additionally, the cool-season treatment group produced on average 987 and 1749 kg ha−1 greater (P < 0.01) forage biomass than mid- and warm-season treatment groups. Furthermore, the mid-season treatment group had 702 kg ha−1 greater (P < 0.01) forage production than the warm-season treatment group.
Influence of cover crop treatment group grown for livestock forage on biomass production (P < 0.01; mean ± SE; kg ha−1) at Montana State University, Northern Agricultural Research Center between 2012 and 2019. Data points without a common letter differ (P < 0.05).
The influence of cover crop mixture nested within cover crop treatment group (cool-, mid-, warm-season) on biomass production (kg ha−1) and crude protein (%) on a dry matter basis for cover crops grown for livestock grazing at Montana State University, Northern Agricultural Research Center between 2012 and 2019

1Mixture composition described in detail in Table 1.
2Pooled standard error.
3Cover crop treatment group (cool-, mid-, warm-season).
4Cover crop treatment group (cool-, mid-, warm-season) × mixture interaction.
Means within cover crop treatment group lacking common superscript differ (P < 0.05).
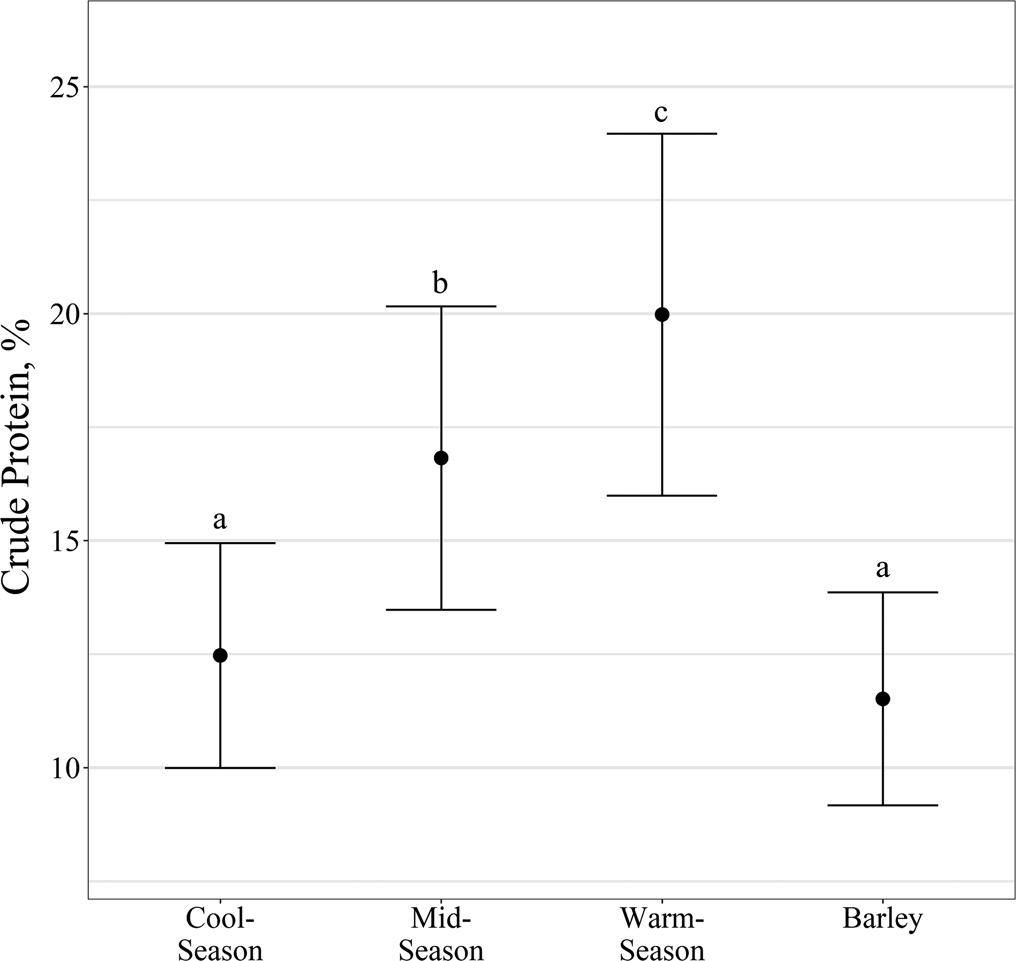
Cover crop mixture nested within treatment group also had an effect (P = 0.02) on crude protein content of the forage (Table 5). However, this effect was limited to cool-season cover crop mixtures that excluded oats having 3.4% greater crude protein on a dry matter basis than five-species cool-season cover crop mixtures including oats (14.9 vs 11.5% CP). There was no effect of cover crop mixture within mid- (P ⩾ 0.32) and warm-season (P ⩾ 0.82) treatment groups averaging 16.9 and 20.0% CP, respectively. The crude protein content of the barley control did not differ (P = 0.99) from other cool-season mixtures that included oats. However, the barley control averaged 3.8% less crude protein content on a dry matter basis than all other cover crop mixtures (P ⩽ 0.05). When evaluating the effect of cover crop treatment group on crude protein content, the warm-season treatment group had greater (P < 0.01) crude protein compared to the barley control, cool- and mid-season treatment groups (20.0 ± 4.0, 11.5 ± 2.3, 12.5 ± 2.5 and 16.8 ± 3.3%, respectively; Fig. 2). Additionally, the mid-season treatment group had on average 4.8% greater (P < 0.01) crude protein content on a dry matter basis than the cool-season treatment group and the barley control. The crude protein content of the barley control and cool-season treatment group did not differ (P = 0.48), averaging 12% crude protein.
Influence of cover crop treatment group grown for livestock forage on crude protein levels (P < 0.01; mean ± SE; %) at Montana State University, Northern Agricultural Research Center between 2012 and 2019. Data points without a common letter differ (P < 0.05).
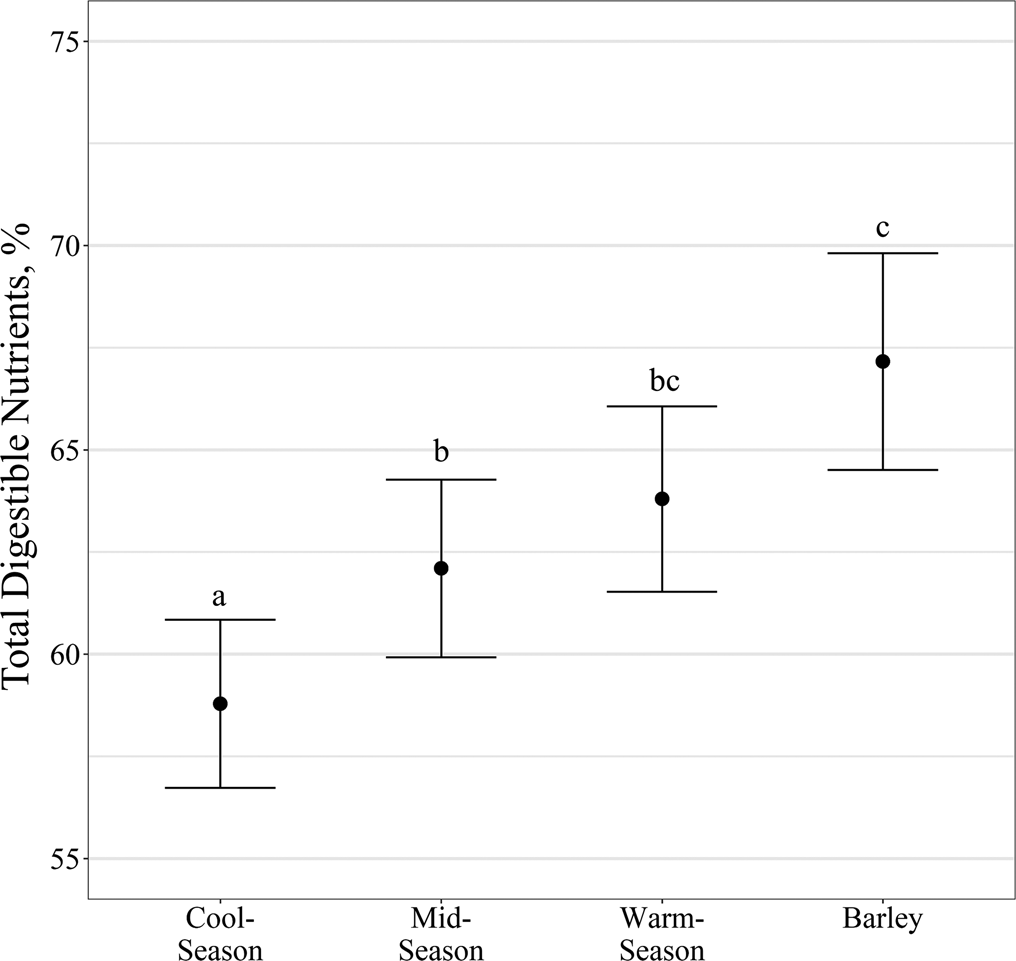
There were no meaningful effects (P = 0.08) of cover crop mixture nested within treatment group on total digestible nutrients, therefore total digestible nutrient data are displayed only as treatment group main effects. Total digestible nutrients were greater (P < 0.01) in the barley control compared to the cool- and mid-season treatment groups (67.2 ± 2.7, 58.8 ± 2.1, 62.1 ± 2.2%, respectively; Fig. 3). However, total digestible nutrients did not differ (P = 0.13) between the barley control and the warm-season treatment group, averaging 65.5%. In addition, the warm-season treatment group had 5.0% greater (P < 0.01) total digestible nutrients on a dry matter basis than the cool-season treatment group but did not differ (P = 0.29) from the mid-season treatment group, averaging 63.0% total digestible nutrients.
Influence of cover crop treatment group grown for livestock forage on total digestible nutrients (P < 0.01; mean ± SE; %) at Montana State University, Northern Agricultural Research Center between 2012 and 2019. Data points without a common letter differ (P < 0.05).
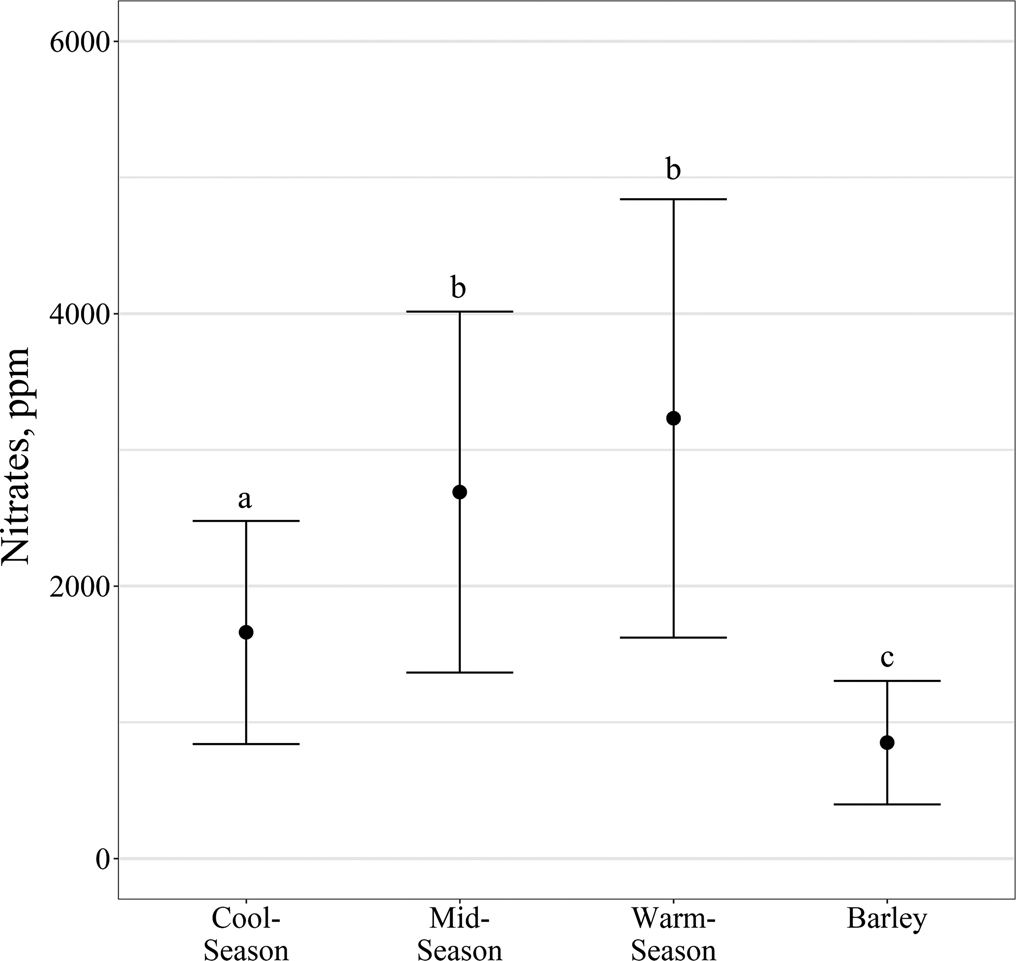
There was also no meaningful cover crop mixture nested within treatment group effect (P = 0.61) for nitrate content, therefore nitrate data are displayed only as treatment group main effects. The barley control produced fewer nitrates (P ⩽ 0.05) than the cool-, mid- and warm-season treatment groups (850.3 ± 453.8, 1660.2 ± 818.5, 2690.7 ± 1325.4, and 3231.5 ± 1609.1 ppm, respectively; Fig. 4). Additionally, the cool-season cover crop treatment group produced 1030.5 and 1571.3 ppm fewer (P < 0.01) nitrates than the mid- and warm-season treatment groups, respectively. Mid- and warm-season cover crop treatment groups did not differ (P = 0.69) in nitrate levels, averaging 2961.1 ppm nitrates.
Influence of cover crop treatment group grown for livestock forage on nitrate levels (P < 0.01; mean ± SE; ppm) at Montana State University, Northern Agricultural Research Center between 2012 and 2019. Data points without a common letter differ (P < 0.05).
Discussion
The cover crop treatment groups in our study were planted at different dates and, therefore, harvested at different stages of maturity. Thus, the results of cover crop treatment groups on forage quality of this study are likely attributed to the stage of maturity at the time of termination. However, all cover crop mixtures were planted within the Natural Resources Conservation Service recommended planting windows for the region and are representative of general cover crop management of the Northern Great Plains. Thus, although influenced by planting date, the effects of cover crop mixture and treatment group on forage quality presented in this study are representative of the general cover crop management of the Northern Great Plains when cover crops are terminated by early July.
Our study results suggest that the addition of oat in a cool- or mid-season cover crop mixture can increase overall biomass production, however, can reduce crude protein content in cool-season mixtures. However, we found that cover crop mixture within treatment group had no effect on crude protein for mid- and warm-season cover crop mixtures or biomass production in warm-season mixtures. In addition, cover crop mixture within treatment group had no effect on total digestible nutrients or nitrate content of the forage. In general, we found that warm- and mid-season cover crop mixtures produce greater crude protein and total digestible nutrients than cool-season mixtures; however, produce less biomass at the time of termination. Although warm-season forage species typically contain lower crude protein levels and are less digestible than cool-season species when at similar stages of maturity, it is important to note that forage digestibility and crude protein decrease as plants reach reproductive maturity and dormancy (Minson, Reference Minson and Morley1981; Coleman et al., Reference Coleman, Moore, Wilson, Moser, Burson and Sollenberger2004). The reduction of forage quality is related to increased fiber and lignification, which is negatively correlated to both total digestible nutrients and crude protein (Ely et al., Reference Ely, Kane, Jacobson and Moore1953). Considering the optimal temperature for growth is near 20°C for cool-season forages, with reproductive maturity occurring in late-June to early-July, and 30–35°C for warm-season forages, with maturity not occurring until August to September, suggests that cover crop termination occurred when cool-season forages were mature and warm-season forages were not (Cooper and Taiton, Reference Cooper and Taiton1968; Nelson and Moser, Reference Nelson, Moser, Fahey, Collins, Mertens and Moser1994). Additionally, the temperature can have a considerable effect on forage quality as higher ambient temperatures are typically associated with lower dry matter digestibility (Ford et al., Reference Ford, Morrison and Wilson1979; Fick et al., Reference Fick, Holt, Lugg, Hanson, Barnes and Hill1988). When forage is grown at the lower end of their optimal temperature, forages tend to be more digestible (Akin et al., Reference Akin, Fales, Rigsby and Snook1987). Due to weather conditions at the study site never reaching the optimal temperature for warm-season forages before termination and the different stages of maturity between cool- and warm-season species may explain greater crude protein and digestibility of the warm-season mixtures. Furthermore, the addition of oat in the cover crop mixture likely increased biomass production and decreased protein due to cover crop termination being based on anthesis of cool-season cereal species.
Peak nutrient requirements for a 544.31 kg cow weaning a 7-month-old calf weighing 224.98 kg is approximately 56.2% total digestible nutrients and 8.8% crude protein (National Research Council, 1996, 2016). Additionally, requirements for 272.16 kg growing cattle with an anticipated finishing/mature weight of 544.31 kg are 56.6% total digestible nutrients and 8.7% crude protein for expected 0.68 kg average daily gain, or 60.7% total digestible nutrients and 9.8% crude protein for 0.91 kg average daily gain (National Research Council, 1996, 2016). In general, the forage produced by the cover crops met the nutritional requirements of beef cattle for most stages of production at the time of crop termination (National Research Council, 1996, 2016). However, it should be noted that the barley control and cool-season cover crop mixture did not fully meet the crude protein nutritional requirements for cattle one of the 4 years that forage quality data were recorded (2012), likely related to below-average precipitation for June (Table 4).
Although nutrient quality sets the upper limit of individual animal performance, forage quantity determines the proportion of the performance that is attained (Duble et al., Reference Duble, Lancaster and Holt1971; Sollenberger and Vanzant, Reference Sollenberger and Vanzant2011). Thus, forage quality interacts with forage quantity in determining animal performance, where forages with greater nutrient quality require less forage quantity to reach maximum potential. Past research has suggested that cover crop mixtures can produce greater biomass than single-species cover crops (Khan and McVay, Reference Khan and McVay2019). However, our results contradict these findings as the barley control consistently produced a minimum of 949 kg ha−1 more biomass than all cover crop mixtures used in the trial. Differences in results between our research and the previous study are likely related to differences in annual precipitation (283.46 vs 349.76 mm), annual temperatures (6.36 vs 7.92°C), cover crop termination dates (late-June to early-July vs late-July to early-August) and species combination within the mixtures used. Additionally, it's likely that certain single species crops, such as barley, can produce higher biomass than mixtures; however, it's challenging to predict a single species' crop success in any given season or location (Khan and McVay, Reference Khan and McVay2019). Mid- and warm-season cover crops used in this trial had substantially lower biomass production than the cool-season cover crop mixture and the barley control. These findings are likely due to the differences in optimum growing temperatures and stage of maturity between warm and cool-season species at the time of crop termination.
Previous research suggests that moderate to high-quality forages require 750–1000 kg ha−1 of forage biomass to achieve optimum animal performance while grazing (Duble et al., Reference Duble, Lancaster and Holt1971; Sollenberger and Vanzant, Reference Sollenberger and Vanzant2011). In general, the barley control, cool-season and mid-season cover crop treatment groups produced adequate forage biomass to achieve optimum animal performance. However, the warm-season treatment group never produced over 528.46 ± 37.61 kg ha−1. The barley control produced over 1000 kg ha−1 consistently across all years of the study, and cool- and mid-season mixtures produced over 1000 kg ha−1 for 7 and 6 years of the 8 years, respectively. However, the year cool-season cover crops did not produce over 1000 kg ha−1, and one of the 2 years mid-season cover crops did not produce adequate forage biomass (2017) was a severe drought, with precipitation during the growing season 118.3 mm below average. Although severe drought can reduce overall biomass production, forage quality is often greater under drought stress compared to normal conditions (Grant et al., Reference Grant, Kreyling, Dienstbach, Beierkuhnlein and Jentsch2014), as seen in our study. When not limited by the nutritive quality of forage, cattle typically consume 1–3% of their body weight daily (Cordova et al., Reference Cordova, Wallace and Pieper1978). Thus, assuming an animal consumes 3% of its body weight per day, a 544.31 kg cow will consume approximately 16.32 kg d−1. Furthermore, grazing efficiency (the proportion of forage consumed by livestock compared to the total that disappears due to all other activities) for moderately stocked pastures is estimated at 50% (Allison et al., Reference Allison, Kothmann and Rittenhouse1982; Smart et al., Reference Smart, Derner, Hendrickson, Gillen, Dunn, Mousel, Johnson, Gates, Sedivec, Harmoney, Volesky and Olson2010). Therefore, based on these assumptions, the cover crop mixtures used in this trial could support approximately 2.13 animal unit months (AUM) per ha for cool-season mixtures, 1.12 AUM ha−1 for mid-season mixtures, 0.34 AUM ha−1 for warm-season mixtures, and 3.66 AUM ha−1 if the barley control were grazed.
This study also found that species composition of the mixtures used did not influence nitrate contents. Both mid- and warm-season cover crop mixtures contained greater levels of nitrates than cool-season cover crop mixtures and the barley control. These results are likely due to the stage of maturity as nitrate levels are negatively associated with plant maturity (Khorasani et al., Reference Khorasani, Jedel, Helm and Kennelly1997; Lenz et al., Reference Lenz, Farney, Kern, Orvis and Drewnoski2019a). Thus, succulent, actively growing tissue is typically higher in nitrates than mature plants. Additionally, many species grown as crops can accumulate nitrates under stress conditions such as drought, shading, injury, frost or an improper balance of soil nutrients (Wilson, Reference Wilson1943; Crawford et al., Reference Crawford, Kennedy and Johnson1961; Undersander et al., Reference Undersander, Combs, Shaver and Thomas1999). Our results support previous work as nitrates of all cover crop treatment groups were substantially elevated during the drought conditions of 2017. Considering weather conditions at the study site never reached the optimal temperature for warm-season forages before termination may further explain elevated levels of nitrates. Additionally, nitrogen fertilizer application is one of the most common causes of elevated nitrate levels in plant tissue (Bolan and Kemp, Reference Bolan and Kemp2003). Although the rate of nitrogen fertilizer application was likely too low to affect plant nitrate levels in our study (22.4 kg ha−1), additional nitrogen fertilizer application could potentially further elevate plant nitrate concentrations and increase the likelihood of nitrate toxicity of grazing livestock.
When consumed by cattle, nitrates are reduced to nitrites in the rumen, and when absorbed, they interfere with the blood's ability to carry oxygen (Emerick, Reference Emerick and Church1988). Chronic symptoms of nitrate poisoning in ruminants include depressed intake, weight loss, abortion, reduced fertility and reduced milk production (Davison et al., Reference Davison, Hansel, Krook, McEntee and Wright1964; Bennett et al., Reference Bennett, Olds and Seath1968; Thompson, Reference Thompson2014). Therefore, it is not recommended for pregnant cattle to graze forages with greater than 1500 ppm nitrates on a dry matter basis; however, 1500–5000 ppm on a dry matter basis is generally considered safe for non-pregnant livestock (Cash et al., Reference Cash, Funston, King and Wichman2002). Nitrate levels between 5000 and 10,000 ppm on a dry matter basis are not suitable for livestock grazing but could be harvested and fed as hay to non-pregnant livestock, as long as feeding is limited to 25–50% of the ration (Cash et al., Reference Cash, Funston, King and Wichman2002). All cover crop mixtures used in this study contained between 1500 and 3500 ppm nitrates on a dry matter basis on average. When evaluating nitrate levels of cover crop mixtures within year of our research, the cool-season mixtures and barley control were below 1500 ppm nitrates 2 years and mid-season mixtures for 1 year of forage quality data (2012 and 2013). Warm-season mixtures were never below 1500 ppm throughout the study. Each cover crop mixture produced nitrates at unsafe levels for livestock grazing for one of the 4 years of quality data (2017), likely related to drought conditions. High nitrate levels could be mitigated by altering species composition of the mix, as brassica species (present in all mixtures in this study) are known to be nitrate accumulators, waiting to graze until the crop is more mature, limiting grazing time, providing low nitrate supplemental feed and providing concentrate supplements (Burrows et al., Reference Burrows, Horn, McNew, Croy, Keeton and Kyle1987; Bolan and Kemp, Reference Bolan and Kemp2003; Lenz et al., Reference Lenz, Farney, Kern, Orvis and Drewnoski2019a). However, forage quality decreases with plant maturity and could result in a forage base that doesn't meet animal requirements. Intensifying grazing management, providing supplementary feed, and concentrate supplements increase livestock production costs and do not eliminate the risk of nitrate toxicity. Additionally, environmental conditions that elicit plant stress, such as drought, further elevate plant nitrate levels (as seen in 2017). Thus, when evaluating the potential for nitrate toxicity associated with grazing cover crops, forages should be tested prior to grazing, especially during drought conditions. If nitrate levels of a cover crop are beyond the limits for livestock grazing, producers should consider postponing grazing till nitrate levels drop to a safe level or harvest the cover crop as hay.
Conclusion
Although cover crop mixtures containing warm-season species had greater crude protein levels and total digestible nutrients than cool-season mixtures and the barley control, warm-season species produced the least amount of biomass with the highest levels of nitrates. An integrated crop-livestock system approach that is mutually beneficial for livestock and crop producers necessitates a cover crop that produces an abundant source of forage that meets livestock nutrient requirements. The barley forage-wheat grain rotation consistently produced the greatest biomass at an acceptable forage quality for grazing livestock during the barley phase. However, this cereal rotation is more susceptible to carry-over diseases and will not likely provide the benefits of mixed-species cover crops (Faé et al., Reference Faé, Sulc, Barker, Dick, Eastridge and Lorenz2009; Blanco-Canqui et al., Reference Blanco-Canqui, Shaver, Lindquist, Shapiro, Elmore, Francis and Hergert2015; Khan and McVay, Reference Khan and McVay2019). Therefore, in a dryland cover crop-wheat rotation that requires early-July termination to prevent volunteer cereal grains in the following wheat crop, cool-season cover crop mixtures should provide a suitable forage source for livestock grazing most years. However, the relatively high and variable nitrate levels of all cover crop mixtures across years in this study suggests that forage should be tested for nitrates before grazing. Additional research is needed that focuses on season-long cover crop biomass production, forage quality and nitrate levels when cover crop harvesting occurs later in the year (August–September).
Supplementary material
The supplementary material for this article can be found at https://doi.org/10.1017/S1742170521000417.
Acknowledgements
The Montana Natural Resource and Conservation Service CIP grant was the initial funding source for the project. Montana Wheat and Barley Committee funding was also instrumental to the initiation and early years of this long-term project. The Montana Research and Economic Development Initiative supported this project from 2015 to 2017, and the United States Department of Agriculture (USDA) National Institute of Food and Agriculture supported the project from 2018 to 2020. The authors would like to acknowledge the contributions of various Northern Agricultural Research Center staff who helped with various aspects of data collection over the years. Particularly, sincere thanks are due to Roger Hybner for all aspects of the technical work related to this project, Tom Allen for planting and spraying operations, and Cory Parsons and the livestock crew for putting up electrical fences and bringing cows and bulls in for grazing. Numerous short-term employees and student interns have also helped with soil sample collection, residue counts, infiltration measurements, and sample processing and cleaning and are also acknowledged.
Conflict of interest
None.


 Open access

