

Zn is an essential trace mineral indispensable for the function of several enzymes in human body. Zn-dependent enzymes are involved in diverse biochemical reactions including metabolism of macronutrients, micronutrients and nucleic acids and are required for cell division, stabilization of cellular structures and normal physiology of the immune system(Reference Prasad1). Zn deficiency in children causes stunting, increases susceptibility to infection and may limit psychomotor development(Reference Caulfield, Black, Ezzati, Lopez and Rodgers2,Reference Blac3) . Further, observational studies proposed that perinatal Zn inadequacy may lead to multiple obstetric complications; however, systematic reviews of controlled trials are yet to provide confirmatory evidence(Reference Ota, Mori and Middleton4).
Studies over the last two decades suggested that Zn deficiency is fairly common in low-income countries(Reference Wessells and Brown5–Reference Bailey, West and Black7). Analysis of the global food supplies indicated that in 2005, 17 % of the world population was at risk of inadequate Zn intake and sub-Saharan Africa had the highest risk of deficiency (24 %)(Reference Wessells and Brown5,Reference Bailey, West and Black7) . Major risk factors of Zn deficiency include limited access to animal source foods and abundance of phytate in the diet. Furthermore, pregnant women and young children are at the highest risk of deficiency due to elevated physiological needs(Reference Caulfield, Black, Ezzati, Lopez and Rodgers2).
Phytate is the principal storage form of phosphorus in plant-based foods. Especially, legumes, cereals, nuts and seeds have abundant phytate. Phytate bonds with cations in the gut to form insoluble complex and inhibit absorption of minerals. In high-phytate diets, fractional absorptions of Zn, Fe and Ca are considerably inhibited. In low-income countries where access to animal source foods is limited, poor Zn absorption secondary to phytate is a major cause of Zn deficiency. Food processing techniques including fermentation, germination and soaking of grains considerably reduce phytate(Reference Gibson, Raboy and King8).
Studies over the last decade confirmed that Zn deficiency is among the leading micronutrient deficiencies of public health significance in Ethiopia(9–Reference Belay, Marquis and Desse12). The recent national micronutrient survey revealed that in 2015, more than one-third of women 15–49 years, preschool and school-age children had low serum Zn levels indicative of deficiency(9). Localised studies based on dietary Zn intake or serum Zn levels also reported alarmingly high prevalence in preschool children and pregnant women(Reference Abebe, Bogale and Hambidge10–Reference Belay, Marquis and Desse12). A global national food supply estimate concluded that Zn deficiency has moderate significance in Ethiopia(Reference Wessells and Brown5).
In the last three decades, Ethiopia underwent rapid socio-economic and political transformations(Reference Manyazewal, Shiferaw, Cheru, Cramer and Oqubay13). In early 1990s, the country transitioned into market-led economy and after the new millennium embarked into rapid economic growth and expansion of social services. Between 1990 and 2015, child mortality was reduced by two-thirds, and the prevalence of stunting dropped by half(14). The per capita energy and protein availability also significantly raised(Reference Sheehy, Carey and Sharma15). Yet, little is known about changes in the dietary supply of micronutrients including Zn. Accordingly, the current study, based on the national Food Balance Sheets (FBS) compiled by the Food and Agriculture Organzation of the United Nations (FAO), analysed the trends (1990–2017) in the supply of total and bioavailable Zn and estimated the prevalence of population at risk inadequate Zn intake. Such trend analyses are imperative for informing national nutrition, food and agricultural policies.
Methods
Study design and data source
This trend analysis (1990–2017) was conducted based on the FBS of Ethiopia compiled by FAO. FAO has been assembling data on the Ethiopian food supply since 1961(16); however, for this analysis, 1990 was considered as the base year as it roughly coincided with the onset of political and economic transformations in Ethiopia. The most recent 3 years (2018–2020) were not included in the analysis because the compilations are yet to be finalised and data are not available for use(17).
An FBS is an annual 3-year running average summary of a country’s food supply available for human consumption as estimated based on the balance of food production, imports, exports and stocks availability at the beginning of the year(18). Food balances report supply statistics for standardised major food commodities. The new food balances (2013–2017) tabulate 95 food groups, whereas the old version (up to 2012) summarised 87 groups(18). Some of the commodities aggregate broader groups (e.g. beans, peas), while others are limited to a specific food item (e.g. banana, palm oil and bovine meat). In FBS, eight different cereals including wheat, maize, sorghum, barley and millets are independently represented but no particular category is provided for Teff (Eragrostis tef). Accordingly, the ‘other cereals’ category is assumed to refer to Teff.
Study setting
Ethiopia is a horn of African nation with diverse agroecological features. Between 1990 and 2017, the population size increased from 47 to 106 million(19). Despite the recent rapid economic growth, Ethiopia remains a low-income country with GDP per capita of 772 USD(20). The Ethiopian economy is primarily dependent on rainfed subsistent agriculture. Commonly cultivated crops include a variety of cereals, such as teff, wheat, maize, sorghum, barley, pulses, oilseeds, and coffee(Reference Tafesse, Dorosh, Asrat, Dorosh and Rashid21).
Estimation of zinc and phytate contents
Zn content of the food commodities was estimated principally based on the Food Data Central database of the U.S. Department of Agriculture(22). When a specific food group is missing from the database, other sources including the FAO/INFOODS Food Composition Databases(23), World Food System International Mini-list(Reference Calloway, Murphy and Bunch24) and NutriSurvey software(25) were consulted. When information taken from multiple databases is reasonably comparable, their arithmetic mean was used.
The phytate content of the food commodities was determined based on multiple sources including the FAO/INFOODS/IZiNCG Database for Phytate(26), the book ‘Food Phytates’(Reference Reddy and Sathe27) and other relevant published literature(Reference Wessells and Brown5). When phytate contents were provided in ranges, the median values were used.
The quantities of Zn and phytate in cereals were estimated assuming that 90 % of the total grain is milled into refined flour and the remaining 10 % is consumed as whole grain flour(Reference Wessells and Brown5). For Teff, which is universally consumed in Ethiopia as fermented flat bread, phytate content was estimated assuming universal fermentation(Reference Urga and Narasimha28). For the other food groups including legumes and pulses, dietary compositions were estimated per 100 g of edible mass. For broader food groups (e.g. beans, peas), the major specific sub-variants in Ethiopia were identified, and the arithmetic mean of their Zn and phytate contents was computed and used assuming equal weights. Propositions made regarding the Zn and phytate contents of the food commodities are summarised in a supplementary file (see online supplementary material, Supplemental file 1). For all food groups, Zn content was computed assuming no fortification because Ethiopia so far has no mandatory fortification policy for Zn.
Estimation of absorbable zinc
The proportion of dietary Zn absorbable from the food groups was estimated using the Miller equation as a function of daily dietary Zn and phytate(Reference Miller, Krebs and Hambidge29,Reference Hambidge, Miller and Westcott30) . The Miller equation is a validated, hybrid (mathematical and statistical), non-linear saturation-response model developed based on the basic knowledge of Zn absorption and empirical data(Reference Miller, Krebs and Hambidge29). In order to estimate the total absorbable Zn, first the total dietary Zn and phytate contents (mg/person/d) available from all food groups were determined. Then total dietary Zn and phytate were converted into their molar equivalent values (mmol/person/d) and entered into the Miller equation. Finally, absorbable (or bioavailable) Zn was determined by the equation using updated model parameters(Reference Hambidge, Miller and Westcott30). Fractional Zn absorption (%) was estimated as a percentage of total absorbable Zn out of the total dietary Zn in the national food supply.
Estimation of phytate:zinc molar ratio
The phytate:Zn molar ratio was estimated for every food group as the phytate content of the food (mg)/660 molar weight of phytate, divided by the Zn content of the food (mg)/65·4 molar weight Zn. The phytate:Zn molar ratio for the entire food supply in a given year was estimated as the weighted average of phytate:Zn molar ratio for the individual food commodities, weighted by the quantity of supply for each food type.
Estimation of phytate:zinc molar ratio
The estimated average requirement cut-point method proposed by the Food and Nutrition Board of Institute of Medicine (IOM/FNB) National Academy of Sciences(31) was used to determine the prevalence of inadequate Zn intake in the population. The FNB/IOM and International Zinc Nutrition Consultative Group (IZiNCG) proposed two different sets of human Zn requirements(32,33) . The requirements defined by IOM/FNB are higher than that of IZiNCG for most of age–sex-defined groups(Reference Wessells, Singh and Brown34). In this analysis, prevalence of inadequate Zn intake was computed separately using both of the recommendations.
In order to estimate the prevalence of inadequate Zn intake, the following procedures were completed. First, the Zn requirements of different age, sex and physiological (pregnancy and lactation) groups were defined according to both of the recommendations (IOM/FNB and IZiNCG). Second, using the data of the Population Division of the United Nations(19), the size and composition of the population based on the aforementioned categories were worked out for all singular years (1990–2017). Then, the mean year-specific EAR were computed separately using the IOM/FNB and IZiNCG physiological requirements, as the weighted average of Zn requirements for different age, sex and physiological groups. Finally, as recommended by WHO, the prevalence of inadequate Zn intake was estimated assuming normally distributed individual Zn intakes with CV of 25 %(Reference Brown, Wuehler and Peerson6,35) .
While estimating the mean estimated average requirement and composition of the population, some mathematical assumptions were made. All infants under the age of 6 months were assumed to be exclusively breastfed and hence their dietary Zn requirement was taken as zero. Further, infants under the age of 6 months assumed to comprise 50 % of the total infants. The number of lactating women was considered to be equivalent to the number of infants under the age of 6 months. Though Ethiopian mothers commonly breastfeed their children beyond 2 years, in terms of estimating Zn intake, the assumption is reasonable because Zn in breast milk sharply declines after 3 or 4 months postpartum(Reference Krebs36). For every year represented, proportion of pregnant mothers was estimated based on interpolation of the data of four Demographic and Health Surveys conducted in Ethiopia between 2000 and 2016(37).
The computation of prevalence of inadequate Zn intake was as follows: Z = (x – µ)/s, where x is the mean estimated average requirement for that year, µ is the average absorbable Zn in the food supply (mg/person/d) and s is the sd of the distribution – equal to 25 % of the mean. Z-values were converted to percent by referring to tabulated standard normal distribution(31).
Estimation of food groups contribution to absorbable zinc
The relative contribution of three food groups (cereals, animal source foods and other plant-based foods, e.g. legumes, nuts, oil seeds, fruits and vegetables) to the total absorbable Zn was estimated as recommended by Smith et al. (Reference Smith, Ruth DeFries and Chhatre38). Because the absorption of Zn is dependent on the contents and ratio of dietary Zn and phytate, the contribution of each food item is not linear and cannot be directly added(Reference Miller, Krebs and Hambidge29,Reference Hambidge, Miller and Westcott30,Reference Smith, Ruth DeFries and Chhatre38) . In order to estimate the contribution of each food group, the following steps were completed. First, the Zn and phytate contributions of each food group were excluded one by one from the diet, and absorbable Zn from the remaining diet was determined. Then, in order to estimate the marginal absorbable Zn supplied by that group, the total absorbable Zn without that group was subtracted from the grand absorbable Zn coming from the entire diet. Ultimately, the relative contribution of each group was estimated by dividing the marginal absorbable Zn contributed by that group to the sum of marginal absorbable Zn contributions of all food groups(Reference Smith, Ruth DeFries and Chhatre38).
Data management and statistical analysis
All statistical analyses were performed using SPSS 23 for windows and Microsoft Excel (XLSTAT) programmes. The food supply statistics for each year (1990–2017) were separately downloaded from the FAOSTAT databases(16,17) . The food groups in the old(16) and new(17) databases were harmonised and merged into one spreadsheet. Food groups including rye, crustaceans, cephalopods, molluscs, aquatic plants and fish liver oil that had zero level of supply in the Ethiopian food system across the years were dropped from the analysis. The ultimate analyses were performed using the dataset that contains the supply data of seventy-two groups.
Time trend analyses for multiple variables including total dietary Zn, absorbable Zn, dietary phytate, fractional Zn absorption and estimated prevalence of inadequate intake were made using Mann–Kendall trend test and Z-score and corresponding P-values are reported. Percentage increment between 1990 and 2017 estimated by dividing difference in the outcome of interest between 1990 and 2017 to the base value in 1990.
Results
Overview of food supply in Ethiopia
Table 1 summarises the per capita supply (kg/person/year) of ten food groups in Ethiopia between 1990 and 2017. In the study period, more than double fold increases in the supply of oils and sugar (148·1 %) and alcoholic/non-alcoholic beverages (107·0 %) were observed. Likewise, the supply of fruits and vegetables, pulses, nuts and oil seeds, milk and milk products, roots and tubers and cereals, all considerably increased between 46 and 63 %. Conversely, the availabilities of eggs and meat were consistently low throughout the years and showed declining trends (Table 1).
Supply of different food groups in Ethiopia 1990–2017

Total and absorbable zinc supply in the Ethiopian food system
In 2017, the total dietary Zn content of the Ethiopian food supply was 13·0 mg/person/d and the corresponding level in 1990 was 9·8 mg/person/d. Between 1990 and 2017, the per capita total Zn supply positively increased (Z = 6·46, P < 0·001) except marginal declines between 1992 and 1995. Over the period, the total Zn supply was increased by 32·5 %.
On the other hand, in 1990 and 2017, the per capita absorbable national Zn supplies were 2·6 and 2·7 and mg/person/day, respectively. Over the period, absorbable Zn supply remained almost constant (Z = 1·87, P > 0·05) and with reference to the 1990 base value, in 2017 it only increased by 2·7 % (Fig. 1).
Estimated per capita supply of absorbable and total dietary zinc in Ethiopia, 1990–2017, absorbable zinc (mg/person/d), total dietary zinc (mg/person/d)

Phytate load in the food system
Table 2 displays the phytate supply (mg/person/d) and the average phytate:Zn molar ratio in the food system in selected years (5-year interval). In 2017, the per capita phytate supply was 2095 mg/person/d and the average phytate:Zn molar ratio stood at 13·9. Between 1990 and 2017, the phytate supply showed a positive trend (Z = 6·50, P < 0·001), and it substantially increased by 48·1 %. In the study period, the phytate:Zn molar ratio fluctuated between 12·1 and 13·9 (Table 2).
Zinc (mg/person/d) and phytate (mg/person/d) supplies and average phytate to zinc molar in the food supply of Ethiopia, 1990 and 2017

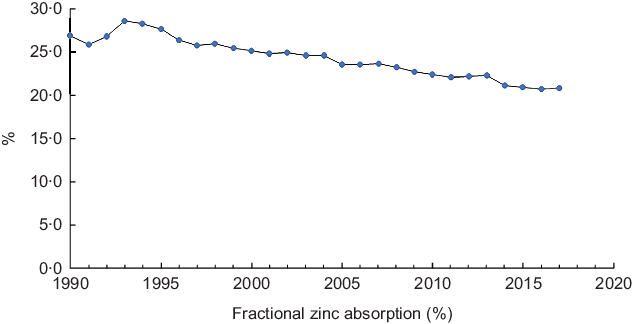
Fractional zinc absorption
Figure 2 depicts patterns in fractional Zn absorption between 1990 and 2017. In the study period, fractional absorption showed a significant negative trend (Z = −6·62, P < 0·001) and gradually declined from 27·0 in 1990 to 20·9 % in 2017 (Fig. 2).
Fractional zinc absorption in Ethiopia, 1990–2017
Relative contribution of different food groups to absorbable zinc
Table 3 presents proportion of absorbable Zn in the national food supplies coming from three different food groups. Cereals were by far the most dominant dietary sources of Zn in Ethiopia. In the year 2017, nearly four-fifths of the bioavailable Zn came from cereals while less than 15 % originated from animal source foods. Between 1990 and 2017, the contribution of animal source foods substantially declined by 45 % from 26·0 to 14·3 %. In the same period, the relative share of cereals increased by 11·3 % from 69·1 to 80·4 % (Table 3).
Relative contribution of three different food groups to the total supply of bioavailable zinc in Ethiopia, 1990–2017
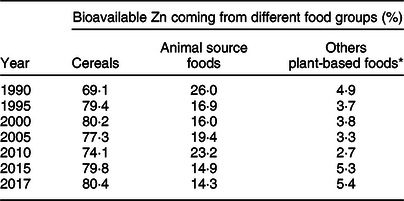
* Including legumes, nuts, oil seeds, fruits and vegetables.
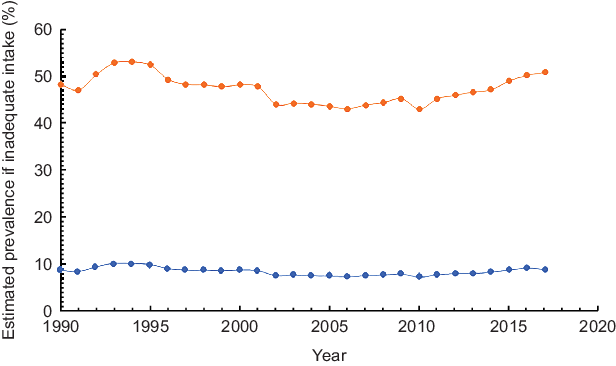
Estimated inadequate zinc intake
Figure 3 depicts the trends in the estimated proportion of Ethiopian population at risk of inadequate Zn intake between 1990 and 2017 based on two different physiological requirements proposed by FNB/IOM and IZiNCG. Over the period, the population at risk of inadequate intake almost remained constant. Based on physiological requirements defined by IZiNCG, prevalence of inadequate intake fluctuated between 10·1 and 7·4 % (Z = −1·87, P > 0·05). When requirements were defined according to the FNB/IOM standard, proportions at risk of inadequate Zn were much higher but still remained constant between 52·9 and 44·3 % (Z = −1·64, P > 0·05) (Fig. 3).
Estimated inadequate Zn intake in Ethiopia, 1990–2017, ![]() based on IZiNCG estimated physiological requirements and
based on IZiNCG estimated physiological requirements and ![]() based on FNB/IOM estimated physiological requirements
based on FNB/IOM estimated physiological requirements
Discussion
The analysis of the Ethiopian FBS suggested that between 1990 and 2017 the per capita availability of total dietary Zn considerably increased by more than 30 %. However, the supply of bioavailable Zn and the estimated prevalence Zn deficiency did not show meaningful changes due to higher (48·1 %) rise in the supply of phytate and concomitant decline in fractional Zn absorption. Similarly, according to the estimate of Wessells and Brown (2012), between 1990 and 2015, total Zn supply in Ethiopia increased from 8·6 to 10·2 mg/person/d, but the absorbable Zn remains constant around 2·5 mg/person/d and fractional Zn absorption declined from 28 to 24 %(Reference Wessells and Brown5).
The findings of the study should be interpreted in the consideration of the multiple shortcomings of the FBS data. While FBS provides a comprehensive overview of food potentially available for human consumption in a given country overtime, it does not avail information about sub-national, seasonal and ecological food distributions. Furthermore, it does not take food access inequalities and household food wastage into considerations. In addition, the FBS is only limited to major food commodities and does not account for subsistence production of less pertinent food commodities. The aforementioned shortcomings may have caused over- or underestimation of the adequacy of Zn in the national food supply. A study that compared FBS-based estimates with nationally representative individual-based dietary intake data for more than 100 countries concluded that for many of the food groups including whole grains, FBS substantially overestimated individual dietary intakes(Reference Del Gobbo, Khatibzadeh and Imamura39). Furthermore, inference about individual dietary intake based on macrolevel data can be biased by ecological fallacy.
It is also important to note that the per capita supply of absorbable Zn was estimated based on several methodological assumptions which may not be strictly true. Changes in the propositions made about compositions of the food commodities, model of Zn absorption, level of food processing and nature of individual Zn intake distribution, can considerably change the findings of the study. Wessells et al. confirmed that alterations in the analytical assumptions can significantly change the estimated proportion of the population at risk of Zn deficiency(Reference Wessells, Singh and Brown34). Accordingly, interpretations must be made in the context of the methodological assumptions made in the study. However, the analysis permits for meaningful comparison of Zn supply overtime which is imperative for informing national nutrition, food and agricultural policies.
As described earlier in the Methods section, the FAO FBS does not treat Teff – a major cereal in Ethiopia in terms of amount of production – as a separate food commodity. Accordingly, in this analysis, it was assumed that the category ‘other cereals’ refers to Teff. This proposition may have caused overestimation of the per capita supply of Zn because Teff has relatively higher Zn content than other cereals(Reference Koubová, Sumczynski and Šenkárová40).
IZiNCG has proposed a composite index – based on stunting rates in children and the adequacy of Zn in the national food supply – for scoring the public health significance of Zn deficiency as ‘low’, ‘moderate’ or ‘high’(Reference Hotz and Brown41). According to this index, Zn deficiency is considered as having ‘high’ significance when the prevalence of stunting and inadequacy of Zn exceed 20 and 25 %, respectively. Conversely, when the two indicators fall below 10 and 15 %, respectively, the deficiency is judged to have ‘low’ significance. When the indices fall in-between, moderate public health significance is assumed. Accordingly, considering the fact that stunting rates remained above 20 % over the years and the risk of inadequate Zn intake fluctuated between 10·1 and 7·4 % (as defined using the IZiNCG physiological requirements), in the last three decades, the public health significance of Zn deficiency has remained in the ‘moderate’ degree in Ethiopia.
The study found that, between 1990 and 2017, in Ethiopia the total absorbable Zn supply coming from animal source foods declined by 45 % from 26·0 to 14·3 %. From Zn nutrition point of view, this is a worrying because Zn coming from cereals and other plant source foods is largely unavailable for absorption. According to Wessells and Brown (2012), in 2005, about 35 % of the global and 15 % the SSA absorbable Zn supply came from animal source foods(Reference Wessells and Brown5). The decline in the Zn contribution of animal source foods in Ethiopia can be due to multiple reasons including uncontrolled population growth and increasing export of livestock for maximising foreign currency earnings. The Ethiopian livestock sector, as compared with the other agricultural sector, has received little attention and suffers from multiple bottlenecks(Reference Negassa, Rashid, Gebremedhin, Dorosh and Rashid42).
This analysis suggested that the per capita availability of phytate in the Ethiopian food supply has considerably increased over the last three decades and exceeded 2 g/person/d since 2015. The rising trend in the availability of phytate is due to two reasons: increasing the availability of cereals in the food supply and concomitant decline in that of animal source food. The study also found that the average phytate to Zn molar ratio of the Ethiopian diet is approximately 14. The findings are in agreement with a previous estimate which found that in 2015 the per capital supply of phytate in the Ethiopian food system was 1·7 g and the phytate:Zn molar ratio was around 16(Reference Wessells and Brown5). According to the WHO, Zn coming from diet with phytate:Zn molar ratio between 5 and 15 is considered to be moderately bioavailable and fractional absorption is below 30 %(35).
The analysis detected substantial disparities in the prevalence of inadequate intake estimated using the Zn requirements put forth by FNB/IOM and IZiNCG. A previous study also documented that in 2005 the global prevalence of inadequate Zn intake determined using the IZiNCG requirements was around 17 %, whereas it increased to 66 % when applying the IZiNCG recommendation(Reference Wessells, Singh and Brown34). This is due to the fact that the requirements set by FNB/IOM are noticeably higher than the other(Reference Wessells, Singh and Brown34,Reference Hambidge, Miller and Krebs43) . Wessells and Brown (2012) considered that the IZiNCG requirements are more applicable for international use(Reference Wessells, Singh and Brown34), whereas Hambidge et al. argued that it has major flaws(Reference Hambidge, Miller and Krebs43).
A national micronutrient survey conducted in 2015 concluded that more than one-third of Ethiopian women, preschool and school-age children were Zn deficient based on serum Zn levels(9). This is considerably different from the prevalence of inadequate Zn intakes the current study estimated using the FNB/IOM or IZiNCG requirements. Zn deficiency prevalence figures determined based on individual-based surveys and national food supply statistics may not converge due to reasons including the aforementioned limitations of the FBS method and absence of a valid Zn biomarker.
Conclusion
Between 1990 and 2017, Ethiopia significantly increased the availability of total dietary Zn in the food system. However, this did not result in meaningful change in the supply of bioavailable Zn and prevalence of inadequate Zn intake due to proportional rise in dietary phytate and concomitant decline in fractional Zn absorption. Furthermore, over the study period, the absorbable Zn contribution of animal source foods significantly declined. In order to improve Zn nutrition, Ethiopia must work towards improving the supply of animal source foods and reducing dietary phytate.
Acknowledgements
Acknowledgements: The author acknowledges FAO for making the Food Balance Sheets data publicly available without any restrictions. Financial support: No financial support was received for this work. Conflict of interest: There are no conflicts of interest. Authorship: S.G. conceived the study, analysed the data, drafted and finalised the manuscript. Ethics of human subject participation: Not applicable.
Supplementary material
For supplementary material accompanying this paper visit https://doi.org/10.1017/S1368980020003456


