





1. Introduction
The evolution of a viscous gravity current beneath an elastic layer is a problem frequently found in nature. It has been used to model situations such as subglacial flooding following lake drainage (Hewitt, Chini & Neufeld Reference Hewitt, Chini and Neufeld2018) and magmatic intrusions in the Earth's crust (Michaut Reference Michaut2011). While these models typically consider only horizontal spreading, observations of the downstream response of glacial ice following rapid supraglacial lake drainage (Mejia et al. Reference Mejia, Gulley, Trunz, Covington, Bartholomaus, Xie and Dixon2021) and the necessity of ice deformation in forming the flood paths of rapidly rising jökulhlaups (Einarsson et al. Reference Einarsson, Jóhannesson, Thorsteinsson, Gaidos and Zwinger2017) suggest that the incorporation of variable topography may be useful in describing the behaviour of such floods beyond an initial spreading regime. Even when the current itself is flat, variations in the depth of the overlying sheet can produce a pressure field equivalent to varying basal topography, extending the relevance of the problem in the glacial case as well as in the case of magmatic intrusions (Woods et al. Reference Woods, Winder, White and Brandsdóttir2019).
The case of a viscous current spreading beneath an elastic sheet on a horizontal surface has been widely studied (Hosoi & Mahadevan Reference Hosoi and Mahadevan2004; Lister, Peng & Neufeld Reference Lister, Peng and Neufeld2013; Adhikari & Tsai Reference Adhikari and Tsai2015; Hewitt, Balmforth & de Bruyn Reference Hewitt, Balmforth and de Bruyn2015). Peng & Lister (Reference Peng and Lister2020) comprehensively described the behaviour of an expanding blister in the case of a rigid impermeable base, with bending and tension in the upper membrane. Variations in the properties of the lower boundary have also been considered, such as the poroelastic layer considered by Hewitt et al. (Reference Hewitt, Chini and Neufeld2018) which was motivated by models of subglacial till. In these cases, the shape of the blister is determined by the approximately constant pressure in the interior, where viscous dissipation is negligible, while the evolution of the blister is determined by the process of peeling at the edges.
It is well known that mathematical models of a fluid filled blister in which the edge of the blister contacts an impermeable surface suffer from a divergence of the viscous shear stresses at the contact point (Flitton & King Reference Flitton and King2004). These mathematical models do not allow the contact line to propagate. A choice of regularisation is therefore required at the contact line to allow spreading. A common choice is that of a pre-wetted layer (Hewitt et al. Reference Hewitt, Balmforth and de Bruyn2015; Peng & Lister Reference Peng and Lister2020) but other choices such as a vapour tip (Hewitt et al. Reference Hewitt, Balmforth and de Bruyn2015; Ball & Neufeld Reference Ball and Neufeld2018) or considerations of fracture toughness (Lai et al. Reference Lai, Zheng, Dressaire and Stone2016b) have also been explored. These regularisations resolve the viscous stresses in the tip region by removing the contact point entirely, by filling the tip region with fluid of negligible viscosity, or by constraining the geometry of the crack tip by the breaking of the solid, respectively.
Regardless of the choice of regularisation, the constant pressure interior solution requires a jump in curvature at the contact line. In the pre-wetted layer and vapour tip cases, a balance between bending and viscous stresses resolves this discontinuity and leads to an advancing contact line, while models relying on fracture toughness impose the geometry of the fracture front through a condition on the geometry of the elastic medium, and imply a vapour or vacuum filled tip region. Lai et al. (Reference Lai, Zheng, Dressaire, Ramon, Huppert and Stone2016a) showed experimentally that the radius of a crack in an impermeable elastic medium remains constant, even as the fluid inside it is drained. As a result, these models all describe blisters which spread uniformly without the possibility for receding edges.
The introduction of a sloping base breaks the symmetry in the problem, and so is likely to lead to behaviour beyond the case of uniform spreading described above. Hewitt et al. (Reference Hewitt, Balmforth and de Bruyn2015) introduce such a slope, but restrict their attention to solutions with a constant flux into the blister, ensuring that the edges of the blister are static (upslope) or have advancing contact lines (downslope). Outside of the study of blisters, recent work by Warburton, Hewitt & Neufeld (Reference Warburton, Hewitt and Neufeld2020) on the elastic analogue to the capillary Landau–Levich problem considered a receding edge in the case of a plate being withdrawn at constant speed from a bath of fluid overlain by an elastic sheet. In this case, it is the shear stress and not the curvature which must be resolved at the edge of the constant pressure region, and hence this edge may travel with arbitrary speed and direction, leaving behind a trailing film of fluid in the receding case.
In this paper, we apply this description of a receding edge to the evolution of a fixed-volume blister on a slope, demonstrating the presence of a new, nearly translating (henceforth ‘translating’) regime in which the blister ceases spreading and instead travels downslope, leaving a trailing film of fluid behind it. In § 2 we describe the governing equations for a two-dimensional blister, and find characteristic length and time scales for its evolution. In § 3 we present the results of numerical simulations, demonstrating the presence of three separate regimes, dominated by the spreading of the blister, translating of the blister, and viscous flow in the trailing film, respectively. We then study these regimes analytically in § 4, deriving scaling relationships for their behaviour. We conclude in § 5 with a summary of our results and a discussion of how the model may be adapted to better reflect the various geophysical processes which motivated it.
2. Governing equations
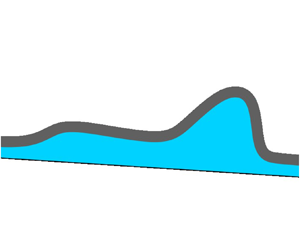
We consider the motion of a two-dimensional blister of a fixed volume per unit width,  $V$. The fluid is bounded above by an elastic sheet and below by a rigid surface, inclined at an angle $\alpha$ to the horizontal, as shown in figure 1, and has density $\rho$ and dynamic viscosity $\mu$. The sheet is modelled as a bending beam of thickness $d$, Young's modulus $E$ and Poisson ratio $\nu$, giving bending stiffness $B = {Ed^3}/{12(1-\nu ^2)}$. For the bending beam limit to be valid, we require the thickness $d$ to be much less than the length scale associated with the fluid. The gravitational acceleration $g$ acts both perpendicular and along the slope, thereby driving flow, and additional effects such as tension (which is outweighed by elasticity when the deformation is significantly less than the depth of the beam) are here neglected for simplicity.
Problem set-up, showing a layer of viscous fluid trapped between a rigid base and an elastic sheet. In the far field ( $x \gg X_D$ and $x \ll X_U$) the elastic sheet sits on a thin fluid layer of thickness $h_0$.

When the depth of the current is small compared with its extent, we may use lubrication theory to describe the flow beneath the elastic sheet. The large aspect ratio means the pressure is approximately hydrostatic. Taking into account the force due to bending on the upper boundary, the pressure is therefore given by
 \begin{equation} p = p_0 + \rho g \left(h-z\right) \cos{\alpha} + B\frac{\partial{^4 h}}{\partial{x^4}}, \end{equation}
where  $h$ is the depth of the current, $x$ is the coordinate in the downslope direction, $z$ is the distance from the lower boundary and $p_0$ is the (constant) pressure at the surface of the current in the absence of bending (with contributions both from atmospheric pressure and the weight of the beam). Pressure gradients balance the shear parallel to the boundary and, given no-slip boundary conditions at the top and bottom of the current, result in a parabolic velocity profile. The downslope fluid flux is therefore given by
 \begin{equation} q = \frac{h^3}{12\mu}\left(\rho g \sin{\alpha} - \frac{\partial{p}}{\partial{x}}\right). \end{equation}
Local conservation of mass therefore leads to an evolution equation which describes the behaviour of the current
 \begin{equation} \frac{\partial{h}}{\partial{t}} + \frac{\partial{}}{\partial{x}}\left\{\frac{h^3}{12\mu}\left[\rho g \left(\sin{\alpha} - \frac{\partial{h}}{\partial{x}}\cos{\alpha}\right) - B \frac{\partial{^5 h}}{\partial{x^5}}\right]\right\} = 0. \end{equation}
 This model of viscous flow beneath an elastic sheet does not allow for peeling upwards at the contact line when the sheet lies flush against the base due to a divergence in the viscous stresses as  $h \to 0$ (Hewitt et al. Reference Hewitt, Balmforth and de Bruyn2015). It therefore requires a choice of regularisation describing the physics at these points. In a glacial setting, existing drainage networks route meltwater beneath the glacier in the absence of catastrophic flooding. Motivated by this physical context, we regularise the problem by considering a pre-existing pre-wetting layer of far-field depth $h_0$, such that
 \begin{equation} \lim_{x \to \pm \infty} h = h_0. \end{equation}
We assume that the blister of fluid is initially sufficiently localised that bending stresses dominate throughout the blister and hence determine its shape. The only remaining parameter in the problem is therefore the initial (two-dimensional) volume of fluid (excluding the pre-wetting layer)
 \begin{equation} V = \int_{-\infty}^{\infty}{(h-h_0)}\,{\rm d}\kern0.7pt {x} \end{equation}
which we take to be constant, motivated by observations of rapid supraglacial lake drainage.
2.1. Non-dimensionalisation
Natural vertical and horizontal length scales and a time scale may be defined as
 \begin{gather} \mathcal{H} \sim \left(\frac{V^5\rho g \sin{\alpha}}{B}\right)^{{1}/{6}}, \end{gather}
 \begin{gather} \mathcal{X} \sim \left(\frac{BV}{\rho g \sin{\alpha}}\right)^{{1}/{6}}, \end{gather}
 \begin{gather} \mathcal{T} \sim 12\mu\sqrt{\frac{B}{\left(V\rho g \sin{\alpha}\right)^3}}, \end{gather}
which are arrived at by balancing the contributions of bending and the along-slope component of gravity to the pressure. By scaling height  $h$, length $x$ and time $t$ by these characteristic scales the problem may be written non-dimensionally as
 \begin{gather} \frac{\partial{h}}{\partial{t}} + \frac{\partial{}}{\partial{x}}\left\{h^3\left(1 - \varLambda \frac{\partial{h}}{\partial{x}} - \frac{\partial{^5 h}}{\partial{x^5}}\right)\right\} = 0, \end{gather}
 \begin{gather} \lim_{|x| \to \infty} h = \delta, \end{gather}
 \begin{gather} \int_{-\infty}^{\infty}{(h-\delta)}\,{\rm d}\kern0.7pt {x} = 1, \end{gather}
where now (and henceforth in the manuscript) we take  $h$,
$h$,  $x$ and $t$ to be the dimensionless variables. The behaviour of the blister is now a function of two parameters; the scaled pre-wetting film thickness
 \begin{equation} \delta = h_0\left(\frac{B}{V^5 \rho g \sin{\alpha}}\right)^{{1}/{6}}, \end{equation}
and the ratio of downslope to elasto-gravity length scales
 \begin{equation} \varLambda = \left(\frac{\rho g \cos{\alpha}V^2\cot{^2\alpha}}{B}\right)^{{1}/{3}} = \left(\frac{l_s}{l_{eg}}\right)^{{4}/{3}}, \end{equation}
which determines the significance of lateral spreading due to gravity on the evolution of the blister.
For simplicity, we focus in this paper on the case  $\varLambda \ll 1$, in which the elasto-gravity length scale $l_{eg} = (B/\rho g \cos {\alpha })^{{1}/{4}}$ is much larger than the length scale associated with the slope $l_s = \sqrt {V\cot {\alpha }}$. In this case the slope-perpendicular component of gravity is always much smaller than the other terms in (2.9), and so can be neglected.
If instead  $\varLambda \gg 1$, bending would not be able to balance the downslope component of gravity everywhere within the blister at leading order, and so the behaviour described in this paper would not be seen. Instead, the behaviour of the blister would progress through a series of previously studied regimes in which the slope-perpendicular component of gravity contributes first to spreading (Lister et al. Reference Lister, Peng and Neufeld2013) and then to the progress of a viscous gravity current down slope (Lister Reference Lister1992).
3. Numerical results
The problem described by (2.9)–(2.11) has been solved numerically using a Crank–Nicolson scheme modified to include the higher-order derivatives associated with elastic bending of the beam. A predictor–corrector step was used for the nonlinear dependence on film depth,  $h^3$. In order to fully resolve the behaviour at the peeling front, a non-uniform grid spacing was used, with the grid spacing decaying linearly from an initial coarse grid spacing to a much finer grid in the region of the peeling front. The fine grid spacing was chosen to ensure that there were at least 10 grid points in each wavelength of the travelling wave ahead of the peeling front. As the blister moves into the region with the finer grid spacing, larger values of $h$ combined with more closely spaced grid points can lead to significant round-off error in the calculation of $(h^3h_{xxxxx})_x$. To avoid this, the otherwise fixed grid spacing was updated whenever this round off error was estimated to be more than $0.1\,\%$. The point in the new grid at which the decay towards the smaller grid spacing began was set at the maximum of $x=0$ or a non-dimensional distance of $0.5$ in advance of the peeling front.
The calculations were initialised with the distribution
 \begin{equation} h(x,0) = \delta + \frac{4}{\sqrt{\rm \pi}}e^{-(4x)^2}, \end{equation}
to represent rapid localised injection of a fixed volume of fluid. The code was tested against solutions for the known behaviour of a viscous gravity current ( $B = 0$) and for a blister on a flat surface ( $\alpha = 0$) and found to produce the expected power-law behaviour for the extent. As this paper focusses on the case $\varLambda \ll 1$, the code was run with $\varLambda = 0$ to reduce the computational cost.
A selection of the blister profiles produced by these numerical calculations are shown in figure 2. Figure 3 provides more detail by showing the position of key points on the blister over time. The numerical results exhibit three distinct phases in the evolution of the blister.
Numerical solutions for the profile of the blister with  $\delta = 10^{-4}$ at (a) relatively early times $t \approx 1.65, 3.67, 8.17, 18.2, 40.4, 90.0$; (b) intermediate times $t \approx 134, 446, 1480, 4910, 16\,300, 54\,200$;(c) and relatively late times $t \approx 121\,000, 180\,000, 268\,000, 400\,000, 597\,000, 891\,000$; showing the spreading, translating and gravity current regimes, respectively. All calculations performed with $\varLambda = 0$.

Positions of the edges of the region of elastic deformation and the back of the blister (where it meets the trailing film) for  $\delta = 10^{-4}$, $t < 1000$. The position of $X_U$ and $X_T$ is the same for early times. The sudden jump in $X_T$ reflects the fact that ${\partial h}/{\partial x}$ is not monotonic, so the position of $X_T$ can change abruptly when a local maximum falls below the threshold.

First, the blister spreads about the origin (figure 2a), as in the case of a blister spreading on a flat surface. Defining the upslope,  $X_U$, and downslope, $X_D$, extent of the region of elastic deformation as the points at which the height above the prewetted layer crosses the threshold $h-\delta \geq \delta /10$, it can be seen that this initial spreading very quickly becomes asymmetric (figure 3), with the downslope component of gravity ultimately causing the blister to spread faster in the downslope direction.
Second, the effect of gravity is such that the upslope extent reaches a static position (figure 3) and the blister then propagates solely downslope. In this regime the velocity is controlled by peeling at the front, and the blister leaves a macroscopic film in its wake (figure 2b). Tracking where the back of the blister meets the trailing film,  $X_T$, by finding the first point behind the maximum value of $h$ where the slope is less than ${\partial h}/{\partial x} \le \delta /10$, we see that the blister is effectively translating in the down slope direction (figure 3), although the volume decreases as fluid is left in the trailing film. As time progresses, a shock forms in the trailing film, and progresses downslope in the direction of the blister. A close up of this process can be seen in figure 4.
Close up of shock forming in the trailing film, and the collision with the blister for  $\delta = 10^{-4}$.

Finally, the shock collides with the blister, which by this point has lost enough fluid that the blister is overwhelmed by the flux behind the shock. The propagation is now controlled by the balance of downslope gravity and viscous drag in the trailing film as found in a classical viscous gravity current, with the effects of elasticity only visible at the front (figure 2c).
These three regimes can be distinguished by the evolution of the front position of the blister which is plotted in figure 5. Although the behaviour of the blister is complex, early in each regime the front position obeys different power laws and we see that the intermediate translating regime becomes less apparent as the pre-wetted layer depth,  $\delta$, is increased.
Downslope position of the front edge of the blister against time for  $\delta = 10^{-4},10^{-4.5},10^{-5},10^{-5.5}$. The triangles indicate the power law followed in each of the three regimes. Significant deceleration below the predicted power law towards the end of the translating regime is due to fluid loss from the blister into the trailing film.

Figure 6 shows the hydraulic potential,  ${\partial ^4h}/{\partial x^4}-x$, in each of the regimes. This can be thought of as the apparent pressure (which we shall simply refer to as the ‘pressure’), accounting for the slope. Indeed, it is identical to the pressure in glaciological situations where the background potential gradient is cause by variations in the thickness of the overlying ice, rather than the gradient of the bed. We see that this pressure is approximately constant within the blister, while in the trailing film it is dominated by the $-x$ term.
Comparison of the pressure  $p = h_{xxxx}-x$, and the height $h$ with analytical predictions (see § 4) in the spreading, translating and gravity current regimes. The plots show the properties of pressure and height for $\delta =10^{-4}$ and (a) $t \approx 8.2$; (b) $t\approx 1500$ and (c) $t \approx 120\,000$. In the plot of the analytical prediction in (b) the front position has been chosen to align with the numerics for easier comparison of the shapes. Comparison of front positions can be seen in figure 12. The prediction for the trailing film in (b) incorporates the expansion fan and the depth of the film being left at the time plotted, but does not show the full solution by characteristics, instead switching from the expansion fan to a constant depth film when the two depths coincide.

Numerical simulations were also run a few times with positive values of  $\varLambda$. As anticipated, the results showed that small values of $\varLambda$ had little effect on the behaviour of the blister, as seen in figure 7 which shows the evolution of the front position of the blister for both $\varLambda = 0$ and $\varLambda = 0.1$. This suggests that the $\varLambda =0$ case will approximate blister evolution for which $\varLambda \ll 1$ and therefore that the choice to neglect the slope-perpendicular component of gravity in the majority of simulations was valid.
Front position of blister for  $\varLambda = 0$ and $\varLambda = 0.1$, showing that the slope-perpendicular component of gravity can safely be ignored for $\varLambda \ll 1$. The case $\delta = 10^{-2}$, $\varLambda = 0.1$ is not visible in the plot as it coincides almost exactly with $\delta = 10^{-2}$, $\varLambda = 0$.

To further understand the behaviour of the blister, in what follows below we detail the physical balances which characterise propagation in a series of asymptotic regimes.
4. Analytical results
The numerical results show clear scaling relationships in the three regimes. Here we derive simple analytical models, highlighting the key physical balances, in each regime.
We proceed by dividing the domain into a quasi-static interior region,  $x \in (X_-,X_+)$ in which pressure is constant to leading order, and an exterior region in which viscous stresses may play an important role. By comparison with the pressure in the numerical results (figure 6) we expect $X_-$ and $X_+$ (which are defined in terms of the pressure) to correspond approximately to $X_T$ and $X_D$ (which are defined in terms of the height) with $X_- \approx X_T$ and $X_+ \approx X_D$. We denote the length of this quasi-static region as
 \begin{equation} L = X_+- X_-, \end{equation}
and the volume contained within the quasi-static region as
 \begin{equation} \tilde{V} = \int_{X_-}^{X_+}{\left(h-\delta\right)}\,{\rm d}\kern0.7pt {x}. \end{equation}
Given a sufficiently localised initial injection of fluid, bending stresses will dominate and quickly lead to approximately constant pressure everywhere within the injected fluid. As a result,  $\tilde {V} \approx 1$ at $t=0$.
4.1. Early times  $t \ll \delta ^{-{1}/{2}}$: spreading

At early times, spreading is slow and the entire region of elastic deformation is hydrostatic away from the contact points, in a manner analogous to the horizontally spreading blister considered by Lister et al. (Reference Lister, Peng and Neufeld2013). Hence both height and slope are zero to leading order at the edges of the hydrostatic interior region and constant pressure requires
 \begin{equation} 1 - \varLambda\frac{\partial{h}}{\partial{x}} - \frac{\partial{^5 h}}{\partial{x^5}} = 0, \end{equation}
with
 \begin{equation} h = \frac{\partial{h}}{\partial{x}} = 0, \end{equation}
at the upstream and downstream edges,  $X_-$ and $X_+$, respectively.
Since we evaluate the form of the blister in the limit  $\varLambda \to 0$, the form is particularly simple:
 \begin{equation} \frac{\partial{^5 h}}{\partial{x^5}} = 1, \end{equation}
which has polynomial solutions. We note that since  $h \geq 0$ everywhere there are no possible solutions with $h = h_x = 0$ at $x = X_+$ and $L > (7200\tilde {V})^{{1}/{6}} \approx 4.4\tilde {V}^{{1}/{6}}$ (as seen in figure 8). Hence there is an upper bound on the length of the isostatic region with a peeling-by-bending front.
Constant-pressure solutions calculated for a range of values of  $L$, showing the effect of including the downslope gravity term (blue) compared with the flat solutions previously studied (red). Here, as elsewhere, $L_0(\tilde {V}) = (7200\tilde {V})^{{1}/{6}}$. (a) $L = \tfrac {3}{4} L_0(\tilde {V})$, (b) $L = L_0(\tilde {V})$. (c) $L = \tfrac {5}{4} L_0(\tilde {V})$.

This equation may be simply integrated to give
 \begin{equation} h = (x-X_-)^2(x-X_+)^2\Bigg[\frac{30\tilde{V}}{L^5} + \frac{1}{120}\left(x-\frac{X_-+X_+}{2}\right)\Bigg]. \end{equation}
The curvature is non-zero at the two edges, with
 \begin{gather} \left.\frac{\partial{^2h}}{\partial{x^2}}\right\rvert_{X_-} = \frac{60\tilde{V}}{L^3} - \frac{1}{120}L^3 \equiv K_-, \end{gather}
 \begin{gather} \left.\frac{\partial{^2h}}{\partial{x^2}}\right\rvert_{X_+} = \frac{60\tilde{V}}{L^3} + \frac{1}{120}L^3 \equiv K_+, \end{gather}
at the upslope and downslope edges, respectively.
This discontinuity in curvature where the blister meets the (flat) pre-wetted film reflects a breakdown in the quasi-static approximation. While viscous dissipation may be neglected in the interior of the blister, it becomes significant at the edges where the film thickness approaches that of the pre-wetting film. In this limit, the curvature of the isostatic interior blister must be matched with the curvature of a viscous peeling region in order to resolve the discontinuity.
We look for a local travelling wave solution near the edges of the blister  $h = h(x-X_\pm )$. Near the edges a balance of the elastic pressure gradient with viscous shear stresses in the travelling frame of reference gives
 \begin{equation} -\dot{X}_\pm\frac{\mathrm{d}{h}}{\mathrm{d}\kern0.06em {x}} - \frac{\mathrm{d}{}}{\mathrm{d}\kern0.06em {x}}\left(h^3\frac{\mathrm{d}{^5h}}{\mathrm{d}\kern0.06em {x^5}}\right) = 0. \end{equation}
Away from the edges of the blister, we must match our solution to the curvature  $h_{xx}$ in the interior of the blister, and to the pre-wetted film depth outside the blister.
This is the case of a peeling blister considered in Lister et al. (Reference Lister, Peng and Neufeld2013), which we review here for completeness. We look for tip solutions whose height and peeling length scale are set by the pre-existing film thickness and the above balance between bending and viscous dissipation, respectively. By writing  $h = \delta g(\xi )$, where $\xi = \pm (|\dot {X}_\pm |\delta ^{-3})^{{1}/{5}}x$, the local tip solutions described by (4.7) may be expressed as
 \begin{equation} -\frac{\mathrm{d}{g}}{\mathrm{d}{\xi}} ={\pm} \operatorname{sgn}(\dot{X}_\pm) \frac{\mathrm{d}{}}{\mathrm{d}{\xi}}\left(g^3\frac{\mathrm{d}{^5g}}{\mathrm{d}{\xi^5}}\right), \end{equation}
which we must match to the prewetted layer
 \begin{equation} \lim_{\xi \to \infty}g = 1, \end{equation}
and to the curvature in the interior of the blister
 \begin{equation} \lim_{\xi \to -\infty} \frac{\mathrm{d}{^2g}}{\mathrm{d}{\xi^2}} = \varGamma, \end{equation}
for some constant  $\varGamma$.
A solution exists to this problem only in the case  $\pm \operatorname {sgn}(\dot {X}_\pm ) = +1$, and so solutions must take the form of an advancing, peeling front at both the upslope and downslope edges. Together, these conditions specify a unique solution, for which previous numerical calculations have found $\varGamma \approx 1.35$ (Hewitt et al. Reference Hewitt, Balmforth and de Bruyn2015).
Rescaling the curvature,  $h_{xx} = \delta (|\dot {X_\pm }|\delta ^{-3})^{{2}/{5}} g_{\xi \xi }$, we see that we must have $K_\pm = \delta (|\dot {X_\pm }|\delta ^{-3})^{{2}/{5}} \varGamma$ and so
 \begin{equation} \delta \left(\frac{|\dot{X_+}|}{\delta^3}\right)^{{2}/{5}} \varGamma = \frac{60\tilde{V}}{L^3} + \frac{1}{120}L^3, \end{equation}
at the downslope edge of the blister, and
 \begin{equation} \delta \left(\frac{|\dot{X_-}|}{\delta^3}\right)^{{2}/{5}} \varGamma = \frac{60\tilde{V}}{L^3} - \frac{1}{120}L^3, \end{equation}
at the upslope edge of the blister. These combine to provide an evolution equation for the length of the blister
 \begin{equation} \dot{L} = \delta^{{1}/{2}}\varGamma^{-{5}/{2}}\left[\left(\frac{60\tilde{V}}{L^3}+\frac{L^3}{120}\right)^{{5}/{2}}+\left(\frac{60\tilde{V}}{L^3}-\frac{L^3}{120}\right)^{{5}/{2}}\right]. \end{equation}
A comparison of the solution of these equations with the numerical results can be seen in figure 9, showing good agreement.
Comparison of analytical (dashed line) and numerical (solid line) results for the spreading regime, showing  $X_+$ in red and $X_-$ in blue. (a) $\delta = 10^{-3}$, (b) $\delta = 10^{-4}$.

At early times,  $\tilde {V} \approx 1$ and $L$ is small and so the upslope and downslope edges respond symmetrically with $L \sim (\delta t^2)^{{1}/{17}}$ as for a blister spreading on a flat surface. This behaviour is visible in figure 5. However, as time progresses and the length of the blister increases the downslope component of gravity leads to faster peeling of the blister in the downslope direction, while the upslope spreading speed decreases.
From (4.10) we see that there is a maximum value of  $L$ at which $\dot {X}_- = 0$ and the upslope edge comes to rest, given by
 \begin{equation} L_0(\tilde{V}) \equiv \left(7200\tilde{V}\right)^{{1}/{6}}. \end{equation}
This corresponds to the upper bound on the length of the quasi-static region found at the beginning of this section, and is the point at which the downslope component of gravity is sufficient to balance the curvature that would otherwise exist at the upslope edge of the blister. It is clear that the behaviour of the blister can therefore no longer be described purely by considering peeling at the upslope and downslope contact positions.
Given our description of the spreading of the length of the blister,  $L \sim (\delta t^2)^{{1}/{17}}$, and the requirement that $L < L_0(\tilde {V})$, we expect this description of the behaviour to be valid for $t \ll \delta ^{-{1}/{2}}$. When $t \sim \delta ^{-{1}/{2}}$ the upslope edge of the blister will come to rest and the blister will enter a second, translating regime. Figure 10 shows that this transition time is consistent with the numerical observations.
The predicted transition times between regimes (solid lines) in comparison with a measure of the instantaneous power law for the front,  $p$, where $X_+=At^p$. The solid red lines indicate the analytically predicted transition times between spreading, translating and gravity current regimes, while the black line indicates the time within the translating regime after which the speed is no longer predicted to be constant to leading order. The power-law exponent $p$ for the front position of the blister was obtained by fitting $X_+ = At^{p}$ to pairs of numerical results at times $t$ and $te^{0.1}$.

4.2. Intermediate times $\delta ^{-{1}/{2}} \ll t \ll \delta ^{-{9}/{8}}$: the translating blister

For small values of  $L$, the shape of the blister is primarily determined by the bending stress, and so the behaviour is similar to that of a blister on a flat surface. However, as $L$ increases, the effects of the downslope component of gravity become more prominent. When $L=L_0(\tilde {V})$, upslope migration ceases but, as shown in figure 2(b), the blister continues to propagate downslope now depositing a macroscopic film at the trailing upslope edge. To understand this dynamics we return to our original description of the quasi-static interior in (4.5). For this larger value of $L$, the downslope component of gravity drives a forward slumping of the blister (seen in figure 8). This means that there is no longer a discontinuity in the curvature, which is needed to drive peeling at the upslope extent of the blister. Instead, the shear stress in the elastic sheet, which is proportional to $h_{xxx}$, must be matched between the interior and trailing film as it is in the elastic Landau–Levich problem considered by Warburton et al. (Reference Warburton, Hewitt and Neufeld2020). Following their approach, we first evaluate the shear stress at the upslope edge
 \begin{equation} \left.\frac{\partial{^3h}}{\partial{x^3}}\right\rvert_{X_-} = \left( \frac{9 \tilde{V}}{10} \right)^{{1}/{3}} \equiv S(\tilde{V}). \end{equation}
Once again at the edge of the blister viscous dissipation balances flow driven by elastic pressure gradients
 \begin{equation} -\dot{X}_-\frac{\mathrm{d}{h}}{\mathrm{d}\kern0.06em {x}} - \frac{\mathrm{d}{}}{\mathrm{d}\kern0.06em {x}}\left(h^3\frac{\mathrm{d}{^5h}}{\mathrm{d}\kern0.06em {x^5}}\right) = 0, \end{equation}
now with the requirement that the shear stress,  $h_{xxx}$, matches to that in the interior of the blister.
The condition on shear stress is expressed as a condition on the third derivative,  $h_{xxx}$, and so is weaker than the condition on curvature (4.8c). As a result, it does not specify the sign of $\dot {X}_-$. However, we have shown that the length of a quasi-static region led by a peeling front is bounded by $L_0(\tilde {V})$. Hence, since the curvature continues to control peeling at the front of the blister and $L$ may not increase past $L_0(\tilde {V})$, we may assume $\operatorname {sgn}(\dot {X}_-) = \operatorname {sgn}(\dot {X}_+) = +1$.
We rescale the height of the drainage film as before with  $h = H g(\xi )$ and $\xi = (\dot {X}_-H^{-3})^{{1}/{5}}x$. Here, $H$ is the depth of the fluid film left behind. The weaker condition on shear stress allows for a receding edge, and so the film depth is no longer pre-set and may in general take a value other than $\delta$. This rescaling gives
 \begin{equation} -\frac{\mathrm{d}{g}}{\mathrm{d}{\xi}} = \frac{\mathrm{d}{}}{\mathrm{d}{\xi}}\left(g^3\frac{\mathrm{d}{^5g}}{\mathrm{d}{\xi^5}}\right), \end{equation}
with
 \begin{equation} \lim_{\xi \to -\infty}g = 1, \end{equation}
and
 \begin{equation} \lim_{\xi \to \infty}\frac{\mathrm{d}{^3g}}{\mathrm{d}{\xi^3}} = \varLambda, \end{equation}
for some constant  $\varLambda$. This problem was considered by Warburton et al. (Reference Warburton, Hewitt and Neufeld2020), who found that $\varLambda \approx 0.8325$. The scaling of the edge region requires that the shear stress exerted by the bulk matches that at the edge, $S = H (|\dot {X}_-|H^{-3})^{{3}/{5}} \varLambda$, and so
 \begin{equation} H \left(\frac{|\dot{X}_-|}{H^3}\right)^{{3}/{5}} \varLambda = \left( \frac{9\tilde{V}}{10} \right)^{{1}/{3}}. \end{equation}
In contrast, the motion of the downstream edge behaves as before, with the dynamics controlled by peeling by bending at the front
 \begin{equation} \delta \left(\frac{|\dot{X_+}|}{\delta^3}\right)^{{2}/{5}} \varGamma = \sqrt{2\tilde{V}}. \end{equation}
 To relate these two equations, we must first find the relationship between  $\dot {X}_+$ and $\dot {X}_-$. The upper bound on the length of the quasi-static region requires that $X_+ - X_- \leq L_0(\tilde {V})$, while immediate return to the spreading regime for $X_+ - X_- < L_0(\tilde {V})$ suggests that we must retain $X_+ - X_- \geq L_0(\tilde {V})$. Hence, we may assume that the blister is of slowly varying length $X_+ - X_- = L_0(\tilde {V})$ and take $\dot {X}_- = \dot {X}_+ \equiv \dot {X}$ (to leading order) to get the velocity of the blister. Thus
 \begin{equation} \dot{X} = 2^{{5}/{4}}\varGamma^{-{5}/{2}}\delta^{{1}/{2}}\tilde{V}^{{5}/{4}} = C_1\delta^{{1}/{2}}\tilde{V}^{{5}/{4}}, \end{equation}
where  $C_1 \approx 1.12$, and the trailing film thickness is
 \begin{equation} H = \varLambda^{{5}/{4}}\varGamma^{-{15}/{8}}2^{{65}/{48}}3^{-{5}/{6}}5^{{5}/{12}} \delta^{{3}/{8}}\tilde{V}^{{25}/{48}} = C_2 \delta^{{3}/{8}}\tilde{V}^{{25}/{48}}, \end{equation}
where  $C_2 \approx 0.907$.
The values of  $\dot {X}$ and $H$ are both dependent on the volume $\tilde {V}$ inside the quasi-static region. Hence, to determine the behaviour of the blister, we must formulate an evolution equation for $\tilde {V}$. Once $\tilde {V}$ is known, it may be substituted back into the equations for $\dot {X}$ and $H$.
$H$.
Considering fluxes in and out of the quasi-static region, the volume evolves slowly according to
 \begin{equation} \dot{\tilde{V}} = \dot{X}(\delta - H) - (\delta^3 - H^3), \end{equation}
where  $\dot {X}\delta$ is the change in volume due to the blister overrunning the pre-wetted layer, $\dot {X}H$ is the loss of fluid into the trailing film, $\delta ^3$ is the downslope flux in the prewetted film ahead of the blister, and $H^3$ is the flux from the trailing film in the direction of the blister.
When determining the shape of the blister, we assume that  $h=0$ to leading order at both edges (4.3b). For this ‘touchdown’ assumption to hold at the upstream edge, the depth of the trailing film must be much less than the height of the blister. Hence, noting that $H \sim \delta ^{{3}/{8}}(\tilde {V}/L_0(\tilde {V}))^{{5}/{8}}$, we must have $\delta \ll H \ll \tilde {V}/L_0(\tilde {V})$. Thus, for all cases considered here,
 \begin{equation} \dot{\tilde{V}} \approx-\dot{X}H \end{equation}
is sufficient to describe the leading-order evolution of the volume of the translating blister.
Together (4.18), (4.19) and (4.21) give
 \begin{equation} \dot{\tilde{V}} =-C_1C_2\delta^{{7}/{8}}\tilde{V}^{{85}/{48}}, \end{equation}
thus providing a prediction for the volume of the translating blister
 \begin{equation} \tilde{V} \approx \left(1 + \frac{37}{48}C_1C_2\delta^{{7}/{8}}t\right)^{-{48}/{37}}. \end{equation}
 We see that initially, to leading order,  $\dot {X}$ is constant for small $t$, with
 \begin{equation} \dot{X} = C_1\delta^{{1}/{2}}\tilde{V}^{{5}/{4}} \sim \delta^{{1}/{2}}, \end{equation}
as seen in figure 11(a). However, drainage from the blister causes slow deceleration, which is particularly noticeable for larger values of  $\delta$ (as seen in figures 10 and 11a). For values of $t \gg \delta ^{-{7}/{8}}$, drainage from the blister is sufficient to have a leading-order impact on the speed, causing rapid deceleration and a departure from the previous power-law behaviour. This can be seen in figure 10 as denoted by the black line. The predicted deceleration agrees well with the numerical results at early times, as seen in figures 11(b) and 12. This suggests that the prediction for the trailing film depth is accurate. However, relatively large higher-order terms in the asymptotic expansion such as those caused by backflow from the trailing film ( $O(\delta ^{{1}/{4}})$) and variation in $L_0$ ( $O(\delta ^{{3}/{8}})$) mean that at late times there is some deviation from the analytical prediction even for relatively small values of $\delta$. Throughout this deceleration the profile of the blister – with a translating quasi-static head which leaves a thin film in its wake – nevertheless remains the same and the translating regime persists.
(a) Front speed of blister, scaled by the analytical prediction for its leading order value in the translating regime,  $C_1\delta ^{{1}/{2}}$, shown for time $t<1000$. Loss of fluid into the trailing film means that deceleration below the leading-order value is visible, particularly for larger values of $\delta$. (b) Scaled front speed, as before, now adjusted to account for predicted volume loss. Breakdown in the asymptotics is apparent for larger values of $\delta$. Note that the jagged line at early times is a numerical artifact cause by averaging speed over a short period of time.

Scaled front position for different values of  $\delta$, along with analytical prediction. The inset figure shows the analytical (dashed line) and numerical (solid line) results for the front position when $\delta = 10^{-5.5}$ with a log axis, showing the divergence from the predictions at late times more clearly.

4.3. Intermediate times $\delta ^{-{1}/{2}} \ll t \ll \delta ^{-{9}/{8}}$: the trailing film

To determine the length of the translating regime, we must consider the dynamics within the trailing film.
Within the trailing film, bending stresses are small and so the height of the blister evolves as for a viscous gravity current, with
 \begin{equation} \frac{\partial{h}}{\partial{t}} + \frac{\partial{h^3}}{\partial{x}} = 0. \end{equation}
This equation can be solved using characteristics with  $h$ constant on characteristics ${{\rm d}\kern0.06em x}/{{\rm d}t} = 3h^2$.
When the blister begins to translate at time  $t_0 \approx \delta ^{-{1}/{2}}$, it leaves behind a film of depth $h(x_0,t_0) = C_2\delta ^{{3}/{8}}$ at the upslope extent, $x_0$, of the spreading regime. This produces a characteristic with $x = x_0+3C_2^2\delta ^{{3}/{4}}(t-t_0)$. In front of this characteristic, the film depth can be determined by considering the characteristics associated with the film left at later times, while behind it an expansion fan emanates from $(t_0,x_0)$ and results in the traditional $h = \sqrt {({x-x_0})/({3(t-t_0)})}$ profile for a viscous gravity current. This can be seen in figure 13.
Blister profiles for various values of  $\delta$ at $t=e^{8.1}\approx 3294$, compared with the profile of a standard viscous gravity current.

As the blister moves down slope, loss of fluid from the blister means that the depth of the film left behind decreases, and therefore so does the gradient of the characteristics. As a result, a shock must form at some point between the expansion fan and the characteristics created as the blister deposits the trailing film. This is illustrated in the characteristic diagram, figure 14, and produces the shock seen in figure 4. Conservation of flux across the shock tells us that it must move with speed
 \begin{equation} \dot{X}_{shock} = H_-^2 + H_-H_++ H_+^2, \end{equation}
where  $H_-$ and $H_+$ are the film depths immediately upstream and downstream of the shock, respectively. By considering the possible values of $h$ within the trailing film, we can find upper and lower bounds for this speed.
Characteristic diagram showing the formation of a shock in the trailing film for  $\delta = 10^{-4}$. The position of $X_-$ (solid black line) and the shock (solid red line) are taken from the numerics. The dotted lines show the characteristics on which $h$ is constant.

To find the upper bound, we note that  $h$ is constant along characteristics, and therefore cannot be greater than the initial depth of the film left behind by the blister, $H|_{t=t_0} = C_2 \delta ^{{3}/{8}}$, anywhere within the trailing film. Hence we must have
 \begin{equation} \dot{X}_{shock} \leq 3C_2^2\delta^{{3}/{4}}. \end{equation}
 To find the lower bound, we consider the volume of fluid,  $1-\tilde {V}$, left in the trailing film. As the depth of the film decays both upstream and downstream of the shock, the depth of the fluid immediately upstream of the shock must be at least $(1-\tilde {V})/(X_--x_0)$. By substituting (4.23) into (4.18) and integrating, we can find an expression for the position of the back of the blister
 \begin{equation} X_-= x_0 + \frac{48}{23 C_2}\delta^{-{3}/{8}}\left[1-\left(1+\frac{37}{48}C_1C_2\delta^{{7}/{8}}t\right)^{-{23}/{37}}\right]. \end{equation}
Substituting (4.23) back into this equation, we see that  $X_- - x_0 \propto 1 - \tilde {V}^{{23}/{48}}$ and therefore $X_--x_0$ grows more slowly than $1-\tilde {V}$. This gives us a lower bound on $H_-$
$H_-$
 \begin{equation} H_-\geq \frac{23C_2}{48}\delta^{{3}/{8}}\frac{1-\tilde{V}}{1-\tilde{V}^{{23}/{48}}} \geq \frac{23C_2}{48}\delta^{{3}/{8}}, \end{equation}
which in turn gives us a lower bound on the speed of the shock
 \begin{equation} \dot{X}_{shock} \geq \left(\frac{23C_2}{48}\right)^2\delta^{{3}/{4}}. \end{equation}
 These bounds imply that the speed of the shock scales as  $\dot {X}_{shock} \sim \delta ^{{3}/{4}}$. At early times, this is substantially less than the approximately constant speed of the blister, $\dot {X} \sim \delta ^{{1}/{2}}$. However, as fluid drains from the blister, its speed decreases allowing the shock to catch up with the blister. By considering the expression for the position of the back of the blister given in (4.28), we see that drainage of fluid from the blister prevents it from travelling further than $X_- = x_0 + 48\delta ^{-{3}/{8}}/23C_2$ and so when $t \sim \delta ^{-{9}/{8}}$ the shock must collide with the translating blister. This transition time is visible in figure 10.
To understand the behaviour after the collision, we must consider the flux into the blister. By considering our bounds on the depth of the fluid behind the shock, we see that the flux behind the shock scales as  $(\delta ^{{3}/{8}})^3 = \delta ^{{9}/{8}}$. Substituting the collision time $t \approx \delta ^{-{9}/{8}}$ into (4.23) gives the volume of the blister immediately before collision, $\tilde {V} \sim \delta ^{{12}/{37}}$. The corresponding rate of drainage from the blister into the trailing film is ${\dot {X}H \sim \delta ^{{7}/{8}}\delta ^{{85}/{148}} \ll \delta ^{{9}/{8}}}$. Hence, after the collision the flux into the blister from the translating film is much larger than the potential drainage due to translation. The flux into the blister can no longer be ignored, and our description of the translating blister breaks down.
4.4. Late times $t \gg \delta ^{-{9}/{8}}$: viscous gravity current

At early times, we may neglect the flow in the trailing film and assume that its effects on the behaviour of the blister are minimal. However, it is apparent that this assumption does not hold indefinitely. When the shock in the trailing film collides with the blister, the flux within the trailing film can no longer be ignored. Fluid flows into the blister, increasing the front speed  $\dot {X}_+$ until the net flux into the blister becomes zero. The movement of the blister is now entirely determined by the trailing film, and the behaviour of the system is now that of a viscous gravity current with elasticity resolving the discontinuity in height at the front and slope at the back. As the majority of the fluid is contained in the trailing film, we may take $X_+ \approx X_-$.
Assuming  $h\gg \delta$ recovers the classic viscous gravity current solution, with $X_+ \sim t^{{1}/{3}}$ (Lister Reference Lister1992) as can be seen in figure 5. However, over time the depth of the current decays and so the prewetted layer must once again be considered. The shape of the gravity current is determined by characteristics, as before, giving
 \begin{equation} h = \max\left(\delta,\sqrt{\frac{x-x_0}{3\left(t-t_0\right)}}\right), \end{equation}
upstream of  $X_+$. The position of the front can then be found by conservation, making sure to account for the prewetted layer so that
 \begin{equation} \int_{x_0}^{X_+}{h}{\rm d}\kern0.7pt {x} = 1 + \left(X_+-x_0\right)\delta. \end{equation}
A comparison of the solution of this equation with the numerics can be seen in figure 15.
Comparison of analytical (dashed line) and numerical (solid line) results for the position of  $X_+$ in the gravity current regime; (a) $\delta = 10^{-2}$, (b) $\delta = 10^{-4}$.

5. Discussion and conclusions
In this paper, we have considered the effect of a sloping base on the evolution of a fixed-volume blister of fluid under an elastic sheet. To allow advancing contact lines, we considered the case where regularisation is provided by a thin pre-wetted layer. We found that the introduction of a slope puts a limit on the length of the quasi-static body of the blister
 \begin{equation} L \approx \left(\frac{7200BV_{head}}{\rho g \sin{\alpha}}\right)^{{1}/{6}}, \end{equation}
where  $V_{head}$ is the volume per unit width of fluid in the quasi-static region. Beyond this length scale previous descriptions of spreading blisters cannot be applied. Slumping due to gravity means that there is no curvature to drive spreading at the upslope end, and so a new mechanism must be considered. By comparison with the elastic Landau–Levich problem, we have shown that the behaviour at the upslope edge is instead driven by the shear stress at the trailing edge of the blister. This allows for a receding edge and so provides a new translating regime in which the body of the blister travels downslope with approximately constant speed
 \begin{equation} \dot{X}_+= \frac{\left(V\rho g\sin{\alpha}\right)^{{5}/{4}}h_0^{{1}/{2}}}{12\mu B^{{1}/{4}}}, \end{equation}
leaving a thin layer of fluid behind it.
For the purpose of simplicity, we have restricted our attention to the case where the behaviour of the blister is determined entirely by gravity and bending stresses. Other descriptions of elastic blisters (e.g. Peng & Lister Reference Peng and Lister2020) have incorporated tension, which could also be added to our model. Tension  $T$ would add a $T h_{xx}$ term to the pressure. This balances the bending term, $Bh_{xxxx}$ when $x \sim (B/T)^{{1}/{2}}$. Considering our upper bound on the length of the quasi-static blister, we see that tension may be safely neglected within the blister so long as
 \begin{equation} T \ll \left(\frac{B^2 \rho g \sin{\alpha}}{7200 V}\right)^{{1}/{3}}. \end{equation}
Similarly, by considering the length scales involved, we can show that this condition implies that tension will always be outweighed by either bending or gravity at the edges of the blister, while in the trailing film tension may be neglected for sufficiently small prewetted layer thickness. Given the high bending stiffness of ice and the small deformation observed compared with ice thickness, it is reasonable to assume that tension will therefore not be relevant in a glaciological context. However, in other contexts it may be significant and additional regimes may be observed which are not considered in this paper.
Although we have restricted ourselves to the case where flow inside the blister is laminar and the front is regularised by a prewetting layer in this paper, it could be fairly simply modified to include more geophysically realistic conditions. The viscous interior of the blister can be replaced by a description of turbulent flow, as in Hewitt et al. (Reference Hewitt, Chini and Neufeld2018), relatively simply. This would have no effect on the shape of the constant-pressure interior, although care has to be taken over the conditions for the flow at the edges of the blister to remain laminar. Similarly, the regularisation at the peeling front could be replaced with other physically relevant options, such as a fracture condition. As with the prewetted layer, this would result in the peeling speed being determined by curvature at the front (Lister, Skinner & Large Reference Lister, Skinner and Large2019), and would also allow for situations in which no fracturing could occur, perhaps halting the propagation if there is insufficient fluid in the quasi-static blister.
In this paper we have considered the case where the sheet overlying the fluid deforms only elastically and have neglected the shear stress exerted on the sheet by the fluid. In reality, there must be some force on the sheet in the upslope direction to prevent it from simply sliding down the slope on top of the lubricating layer of fluid beneath it. Theoretical studies of a fluid beneath an elastic sheet often simply take the sheet to be clamped (e.g. Hosoi & Mahadevan Reference Hosoi and Mahadevan2004), but in geophysical contexts a more complex dynamics is likely to be involved. In the glacial context, a resistive force may result from contact with the underlying till, with porosity of the till providing an effective prewetted layer despite this contact. Slip laws such as the one described by Zoet & Iverson (Reference Zoet and Iverson2020) relating the slip velocity to shear stress and pressure are used when modelling the viscous flow of ice. Although the large velocities sustained during the translating regime suggest that deformation will be predominantly elastic, incorporation of viscous effects and shear stress in the sheet would provide more insight into the response of the overlying ice.
These modifications would allow for more realistic comparison with observations such as those of supraglacial lake drainage, which has traditionally been modelled by considering only horizontal spreading. While topography has little influence on the initial spreading of the blister, its role in limiting the extent of spreading and keeping lake water localised could have an influence on the transition between the initial flooding stage and the later evacuation of water through an efficient subglacial drainage system.
Despite the simplicity of the existing model, it shows reasonably good agreement with observations. The water from the lake drainage event described by Mejia et al. (Reference Mejia, Gulley, Trunz, Covington, Bartholomaus, Xie and Dixon2021) travelled approximately  $10\unicode{x2013}30\,\mathrm {km}$ within $1$ day, giving a speed of at least $10^{-1}\unicode{x2013}10^{-0.5} \,\mathrm {m}\mathrm {s}^{-1}$. Taking the effective slope to be the change in the ice elevation divided by the distance travelled gives $\alpha \sim 10^{-2}$ while ice thickness of approximately $1\mathrm {km}$ gives bending stiffness $B \sim 10^{17} \,\mathrm {Nm}$ (Hewitt et al. Reference Hewitt, Chini and Neufeld2018). Considering the shape of the translating blister, we find that in this case the observed uplift of approximately $0.1 \,\mathrm {m}$ corresponds to a cross-sectional area of approximately $100 \,\mathrm {m}$. Substituting these values into (5.2) gives an effective prewetted layer depth of
 \begin{equation} h_0 \approx 10^{-7.5}-10^{-6.5} \,\mathrm{m}. \end{equation}
A porous till of permeability  $k$ and depth $b$ is equivalent to a prewetted layer of depth $(kb)^{{1}/{3}}$ (Hewitt et al. Reference Hewitt, Chini and Neufeld2018), putting this near the bottom of the expected range ( $h_0 \approx 10^{-{10}/{3}} - 10^{-7} \,\mathrm {m}$) (Hewitt et al. Reference Hewitt, Chini and Neufeld2018), for ice overlying a permeable till. Faster speeds due to drainage later within the possible $1$ day window would correspond to a deeper effective pre-wetted layer depth, giving good agreement between possible speeds and the known properties of glacial till.
Most practical applications of downslope blister propagation beneath an elastic sheet are three dimensional, which introduces further complexity to the two-dimensional case considered in this paper. While elasticity has a stabilising effect in some viscous problems (Pihler-Puzović et al. Reference Pihler-Puzović, Illien, Heil and Juel2012), the flow of an infinitely wide front of viscous fluid down a slope beneath an elastic sheet has been shown to be unstable (Khomenko Reference Khomenko2010). Depending on the size of the initial distribution of fluid, similar instabilities may be seen in the case of a more localised three-dimensional blister. The approach here, in which the shape and evolution of the blister is determined entirely by the edge positions may provide some insight into whether such instabilities exist. If they do, the range of scales involved make it unlikely that a purely elastic model of ice would remain relevant, further increasing the complexity.
Acknowledgements
The authors are very grateful to N. Balmforth for his helpful comments during the editorial process, particularly regarding the formation of the shock in the trailing film.
Funding
S.T. is supported by an Engineering and Physical Sciences Research Council studentship (grant no. EP/R513180/1).
Declaration of interests
The authors report no conflict of interest.


 Open access

