

The increase in the prevalence of obesity in both developed and developing countries(1) has led to increased pressure on the health care industry for resources needed to combat the co-morbidities associated with excess fat deposition(Reference Haslam and James2). This has led to efforts being focused on weight-loss diets that achieve high rates of compliance from dieters. Indeed, the ideal diet would satisfy hunger at intakes below energy maintenance and lead to body fat loss while protecting against lean tissue loss. Weight-loss diets with a very low carbohydrate intake, the so-called ketogenic diets, as advocated by the late Robert Atkins(Reference Atkins3), have become popular with the public. Indeed, a number of studies have shown that various forms of very-low-carbohydrate diets lead to weight loss under both controlled(Reference Weigle, Breen and Matthys4) and free-living conditions(Reference Foster, Wyatt and Hill5), although for the latter situation, these diets often contain a high protein content(Reference Soenen, Bonomi and Lemmens6). This may be advantageous in that higher protein intakes may protect against lean mass loss while body fat is lost(Reference Johnstone, Horgan and Murison7), but higher protein intakes also inhibit ketosis, which may be undesirable if ketones are viewed as therapeutic. Nonetheless, the low intake of fruit and vegetables necessary to induce the ketogenic state has raised other health concerns(Reference Anderson, Konz and Jenkins8), although, in practice, such diets can be well formulated with the inclusion of non-starchy vegetables(Reference Feinman, Vernon and Westman9). However, these concerns do raise the question of how critical is the ketogenic state for improving either satiation (meal termination) or satiety (inter-meal interval) and how this is recognised by the brain, the key organ that integrates appetite-related signals(Reference Ahima and Antwi10).
Under normal dietary conditions, the main fuel for the brain is glucose and, in humans, this involves a continuous requirement of approximately 4–5 g/h(Reference Reinmuth, Scheinberg and Bourne B11). In short periods of carbohydrate deprivation, such as overnight fasting, these glucose needs can be met by activities within other tissues, including glycogen mobilisation and gluconeogenesis from lactate, amino acids and glycerol. With longer-term fasting, mobilisation of body fat occurs, with the release of ketones, acetoacetate (AcAc) and 3-hydroxybutyrate (3-OHB), and these can provide alternative fuels to many tissues, including the brain(Reference Hasselbalch, Knudsen and Jakobsen12). Furthermore, specific regions of the rodent brain have been shown to be able to utilise ketone bodies instead of glucose in the fasted state(Reference Hawkins, Mans and Davis13). Some of these areas, notably the hypothalamus, are known to be involved in appetite regulation(Reference Morton, Cummings and Baskin14), and this raises the question of whether a switch in the metabolic fuel from glucose to ketone bodies alters the perception of hunger and might contribute to the effectiveness of very-low-carbohydrate diets. The uptake of R-3-[11C]hydroxybutyrate has been shown to differ between the regions of the brain in healthy men after an overnight fast, with greater transport into the grey matter than into the white matter being observed(Reference Blomqvist, Thorell and Ingvar15). Furthermore, it has been reported that the total uptake by the brain increases with increasing plasma 3-OHB concentrations(Reference Pan, Rothman and Behar16).
Earlier findings(Reference Johnstone, Horgan and Murison7) have indicated that consumption of a high-protein (HP), more-ketogenic (HPLC) diet is less than for an isoenergetic non-ketogenic (HPMC) diet when both are given ad libitum over a 4-week period. Furthermore, despite the lower intake, the subjects felt less hungry. The aim of the present study was to examine whether the impact on hunger was related to the altered metabolism of glucose by the brain, associated with the lower supply of dietary glucose and increased reliance on ketones as an energy fuel by the body when such a HPLC diet is given. The present study involved, as part of a randomised design, fixed intakes of HPLC and HPMC diets with a composition similar to that of diets used previously(Reference Johnstone, Horgan and Murison7), with each diet being given for 28 d. At the end of each dietary intervention period, measurements of both whole-body glucose and ketone body kinetics were taken coupled with the quantification of glucose uptake across different regions of the brain using positron emission tomography (PET). The present observations were made within a larger study, parts of which have been presented elsewhere(Reference Johnstone, Lobley and Horgan17).
Subjects and methods
In the present study, fourteen men (average BMI 35·3 kg/m2, range 27·9–48·5 kg/m2, but otherwise healthy) aged above 50 (range 50–74) years were recruited by advertisement. This age restriction was an ethical requirement based on the doses of radiation received during the two PET scans. Volunteers who were smokers, suffered from claustrophobia, or had psychiatric or neurological illnesses, and anyone who reported food allergies, were excluded from the study. The volunteers underwent an independent medical examination, and then their general practitioner was contacted to ensure that there were no other grounds for exclusion. Finally, all the volunteers were asked to provide written informed consent. The present study was conducted according to the guidelines laid down in the Declaration of Helsinki, and all procedures involving human subjects were approved by the North of Scotland Research Ethics Service. The study protocol was not completed by two volunteers: one withdrew before the first PET scan and the other after the scan. All data for these two subjects were removed from subsequent analyses. The subjects who completed the study protocol had a mean age of 66·7 (se 1·9) years and a BMI of 34·9 (se 1·7) kg/m2 and were weight stable in the previous 3 months. All the recruited volunteers were right handed.
Study protocol
The study was conducted as a balanced within-subject, cross-over design with the order of feeding two HP weight-loss diets being randomised between the subjects. The participants resided at the Human Nutrition Unit at the Rowett Research Institute, Aberdeen, but were allowed to leave the unit to go to their workplace. All foods and drinks consumed during the study period were supplied by the Human Nutrition Unit staff. The study protocol has been described previously for a larger group of subjects(Reference Johnstone, Lobley and Horgan17), and it is shown in Fig. 1. The subjects first consumed, for 7 d, a fixed maintenance diet (M1; 13 % protein, 37 % fat and 50 % carbohydrate as energy), calculated to meet the energy requirements of each subject (estimated at 1·6 × measured RMR after an overnight fast, RMR). They were then randomly allocated to consume one of the two diets (HPLC or HPMC), each for 4 weeks. These were given as a fixed metabolisable energy intake set at 8·3 MJ/d, related to the mean consumption observed in the previous trial ad libitum (Reference Johnstone, Horgan and Murison7). There was a 3 d period between the consumption of the two diets, during which the subjects consumed the maintenance diet (termed M2). This was done to allow for the restoration of hepatic glycogen stores that were expected to be depleted if the HPLC diet was the first intervention. Diet composition and daily mean intakes are given in Table 1, and additional details related to the larger study group have been reported previously(Reference Johnstone, Lobley and Horgan17). Every day, except those when the PET scan or ketone body kinetic measurements were carried out, the subjects were asked to record hourly feelings related to hunger and appetite(Reference Johnstone, Horgan and Murison7). Towards the end of each dietary intervention period, RMR was measured by respiratory gas exchange using a Deltatrac II (Datex-Ohmeda) for a 40 min period following an overnight fast.
Experimental protocol (see Johnstone et al. (Reference Johnstone, Lobley and Horgan17)). The subjects were given an energy maintenance diet (M1; 13 MJ/d) for 7 d, after which fasting blood samples and anthropomorphic measurements were taken. Immediately following this, the subjects were given two weight-loss diets, each for 28 d, separated by a further 3 d when they were given the maintenance (M2) diet. The weight-loss diets were given as part of a randomised cross-over design and contained 8·3 MJ/d and were high protein with either a very low or an adequate carbohydrate content, 29:5:66 or 28:35:37 in proportion of energy as protein:carbohydrate:fat, respectively. Positron emission tomography (PET) scans were conducted on day 26 or 27 of the dietary intervention period with ketone body kinetic analyses being carried out on either day 27 or 28. a, Maintenance diet 1 (7 d); b, weight-loss diet 1 (28 d); c, maintenance diet 2 (3 d); d, weight-loss diet 2 (28 d). ![]() , Blood samples;
, Blood samples; ![]() , PET scan and infusions.
, PET scan and infusions.
Composition and intakes of diets given to the twelve subjects: maintenance diet (M1, given as 1·6×RMR for 7 d) or two high-protein weight-loss diets (given as 1·0×RMR) with either low (HPLC) or moderate (HPMC) amounts of carbohydrate, each given for 28 d as part of a randomised cross-over design
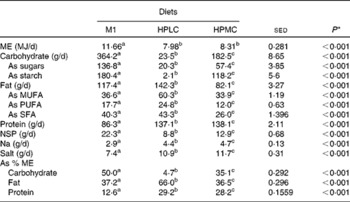
ME, metabolisable energy. a,b,cMean values within a row with unlike superscript letters were significantly different (P< 0.05). * By ANOVA with the twelve subjects as random effects and diet treatments as fixed effects.
Formulation and preparation of the diets and measurement of food intakes
The subjects were given foods on a daily basis and asked to complete a food diary each day to record the time of consumption of each meal. All breakfasts were hot and freshly cooked within the Human Nutrition Unit by the staff. Lunch was provided as a cold packed meal, and the subjects could take this to their workplace, if necessary. Evening meals were pre-prepared and could be heated in either a microwave or an oven.
Each of the three daily meals in the HPLC and HPMC dietary regimens provided 2·77 MJ, i.e. a total intake of 8·3 MJ/d. All individual meals within a dietary regimen had identical macronutrient composition, each with a fixed energy density of 5·5 MJ/kg (1·3 Mcal/kg), calculated with a computerised version of McCance and Widdowson's ‘The composition of foods’, 5th edition and supplements (Windiets Program, Research version 1 (2006), Univation Limited, The Robert Gordon University, Aberdeen, Scotland). All meals within the HPLC dietary regimen contained, by energy, 29 % protein, 5 % carbohydrate and 66 % fat, while those within the HPMC dietary regimen contained 28 % protein, 35 % carbohydrate and 37 % fat. Any uneaten food was returned to the kitchen daily and weighed.
Metabolic parameter measurements and positron emission tomography scans
Blood samples were collected at weekly intervals throughout the study period after an overnight fast, and plasma was stored at − 80 °C for subsequent analyses. On day 26 or 27 of each dietary intervention period, glucose uptake across various regions of the brain was measured using the PET scan. On day 28, both whole-body ketone body and glucose kinetics were measured under similar conditions to the PET scan. The first four subjects were asked to fast overnight before the PET scan, but by the time the tracers were synthesised, the main scan was not started until approximately 11.30 hours and plasma ketone concentrations had started to increase markedly on consumption of the HPMC diet. This probably reflects the duration that the subjects had been in a state of negative energy balance on the weight-loss regimen, because carbohydrate deprivation for more than 20 h is usually needed for such increases to occur in weight-stable individuals(Reference Balasse18). The remaining eight subjects were fed at 08.00 hours on the morning of the PET scan, with a meal equivalent to the breakfast normally being given (2·77 MJ, similar macronutrient composition). The same dietary regimen was followed on the day glucose and ketone body kinetics were measured.
Positron emission tomography scan imaging (day 26 or 27)
PET images were obtained at the John Mallard PET Centre, jointly operated by the University of Aberdeen and NHS Grampian, with measurements being carried out in subjects 1–4 (after an overnight fast) using a CTI/Siemens ECAT EXACT-31 (CTI/Siemens) full-ring scanner with a 10 cm axial field of view. This machine was then replaced with a GE Discovery STE PET/CT (GE Healthcare) with a 15 cm field of view, and this was used to scan subjects 5–12. The subjects were scanned twice, at the end of each dietary intervention period, at 07.00 hours after an overnight fast. A 20G cannula was inserted into the radial artery of the wrist of the subjects for blood sampling, and an 18G cannula was inserted into the antecubital vein of the opposite arm for isotope injection.
For PET scan imaging, 18fluoro-deoxyglucose (18FDG) was produced on-site and was available between 11.00 and 11.30 hours. For the first 5 min following the injection of a known quantity of 18FDG (150–220 MBq), blood was drawn continuously from the arterial catheter by peristaltic pump and passed through a radioactivity detector (Allog AB), and integrated data were recorded every 2 s. Blood samples (5 ml) were then collected manually at known time points (7, 10, 15, 20, 30, 40, 50 and 60 min) after injection for the determination of radioactivity and glucose concentrations. During the hour immediately after the injection of 18FDG, nineteen frames (8 × 15 s, 4 × 30 s, 1 × 60 s, 1 × 5 min and 5 × 10 min) were acquired.
Positron emission tomography brain image analysis and processing
Image processing was carried out using Pmod v3.2 (Pmod Technologies Limited). All the images were registered to the Montreal Neurological Institute brain atlas, and time–activity curves were generated for a total of 116 regions of the brain. These included fifty-four regions present in both the left and right hemispheres and eight regions ascribed to the vermis. Parameter estimates linked to glucose supply to the brain were obtained by fitting a three-component exponential curve to radioactive glucose in the arterial plasma obtained as continuous and discrete samples over the 1 h of the PET scan. Within each region of the brain, fractional transfers based on a three-compartment model (plasma 18FDG, brain 18FDG and brain 18FDG-P; Fig. 2) were obtained from the PET time–activity data by extension of the Skoloff model(Reference Huang, Phelps, Phelps, Mazziotta and Schelbert19). The fractional net transfer (K net) was obtained by combining the fractional transfers for inward and outward movements(Reference Huang, Phelps, Phelps, Mazziotta and Schelbert19) and subsequently converting to absolute glucose rates (rate of glucose uptake by the brain (MRGlc), μmol/min per 100 ml) from K net× (arterial plasma glucose concentration)/LC, where LC is a lumped constant (set at 0·65(Reference Wu, Bergsneider and Glenn20)).
Compartment model used to define the transfers of 18fluoro-deoxyglucose (18FDG) between the plasma and the brain(Reference Huang, Phelps, Phelps, Mazziotta and Schelbert19). The phosphorylated form of 18FDG produced in the brain cannot be metabolised further and accumulates. The fractional net movement of 18FDG (K net) was derived from ((k 1× k 3)/(k 2+k 3)). The absolute utilisation of glucose (calculation of the glucose metabolic rate) was calculated from K net× (plasma glucose concentration)/LC, where LC is a lumped constant (set at 0·65(Reference Wu, Bergsneider and Glenn20)). 18FDG-6-P, 18FDG-6-phosphate. k 1, fractional influx of 18FDG into the brain from the plasma; k 2, fractional efflux of 18FDG to the plasma; k 3, rates of conversion of 18FDG to 18FDG-6-phosphate.
Stable isotope glucose and ketone body kinetics (day 27 or 28)
Subjects 1–4 fasted overnight and throughout the infusion of the tracer, while subjects 5–12 were fed at 07.00 hours, and then measurements were carried out 3–4 h later to match the conditions for the PET scan. Catheters were inserted into the antecubital vein of each arm of the subjects, with one being used for the infusion of stable isotopes (Cambridge Isotope Laboratories). A catheter was also inserted into a vein in the hand, and blood samples were withdrawn at appropriate time points after placing the hand in a hot box at 60°C for 10 min for arterialised blood production. Baseline (background) samples for the determination of natural abundance enrichment of plasma glucose, AcAc and 3-OHB were collected, and then a bolus of [6,6-2H2]glucose (22 μmol/kg body weight) was injected, followed by a 3 h infusion at 0·5 μmol/h per kg. During the last 2 h of this infusion, a mixture of sodium [1,2,3,4-13C]acetoacetate and sodium [2,4-13C]3-hydroxy butyrate(Reference Avogaro, Valerio and Gnudi21) was infused at appropriate rates for the HPMC and HPLC dietary regimens, respectively (AcAc 7·5 and 20 μmol/h per kg body weight, 3-OHB 12 and 30 μmol/h per kg body weight). Sodium acetoacetate was prepared from ethyl [1,2,3,4-13C]acetoacetate based on previous reports(Reference Nosadini, Datta and Hodson22, Reference Cobelli, Toffolo and Avogaro23) the day before infusion and stored at − 80°C overnight. Blood samples (9 ml) were collected at 10 min intervals during the last hour of infusion, placed on ice and centrifuged as soon as possible. Appropriate portions of plasma for subsequent analyses were frozen in liquid N2 and stored at − 80 °C. During the last hour of infusion, respiratory gas exchange was measured for 2 × 20 min periods with a 20 min interval in between to allow for the estimation of whole-body VO2 and CO2 production.
Chemical analyses
Plasma glucose concentrations were determined in duplicate using a Konelab 30 selective chemistry analyser (Thermo Scientific), using a standard glucose (hexokinase) assay kit (Thermo 981304, Thermo Scientific), as were weekly 3-OHB concentrations using a published method(Reference Li, Lee and MacGillivray24).
The enrichment of [6,6-2H2]glucose was determined as the penta-acetate derivative using electron-impact GC–MS on a Voyager mass spectrometer coupled to a GC8000 Top gas chromatograph and an AS800 autosampler (Thermo Scientific). To a plasma sample (50 μl), 200 μl of acetonitrile:ethanol mixture (2:1) were added, and the sample was vortex-mixed for 30 s and then centrifuged at 13 000 rpm for 5 min. The supernatant was transferred to a 1 ml reaction vial and evaporated to dryness on a dry block heater at 90°C under a gentle stream of N2. To the dry residue, 75 μl of acetic anhydride:pyridine (2:1) were added, and the penta-acetate derivative was formed on heating at 90°C for 15 min. After cooling, the sample was dried at 90°C under a stream of N2 and then dissolved in 80 μl of ethyl acetate. The separation of the penta-acetate derivative of glucose was carried out on a 30 m × 0·25 mm × 0·25 μm Equity-1701 capillary column (Sigma-Aldrich) under the following conditions: 150°C for 1 min and then 25°C/min to 260°C for 7 min. Injections (1 μl) were made in the split mode with a 40:1 split. Helium at a constant head pressure of 11 psi was used, and the temperatures of the injector and the interface line were 250 and 230°C, respectively. Fragment ions at m/z 200 and 202 were monitored under selective ion monitoring conditions with a 50 ms dwell time on each ion.
Both AcAc and 3-OHB were extracted from the plasma samples and analysed as their tertiary butyldimethylsilyl derivatives on a 5973N MSD GC–MS (Agilent Technologies). To a 0·9 g plasma sample, 0·25 ml of 35 % (w/v) sulphosalicylic acid was added, and the sample was vortex-mixed for 30 s and then centrifuged at 13 000 rpm for 5 min. The supernatant was extracted with 1 × 2 ml ethyl acetate followed by extraction with 2 × 1 ml, and the organic layers were pooled (centrifugation at 2500 rpm for 3 min after each extraction if necessary). The ethyl acetate extract was transferred to a shell vial containing 100 μl dimethylformamide, and its volume was reduced to approximately 1 ml at 45°C under a gentle stream of N. The sample was transferred to a 1 ml reaction vial and its volume was reduced to approximately 50 μl, and then 50 μl of N-tert-butyldimethylsilyl-N-methyltrifluoroacetamide were added, and tertiary butyldimethylsilyl derivatives were formed on heating at 90°C for 15 min. The separation of the tertiary butyldimethylsilyl derivatives of AcAc and 3-OHB was carried out on a 30 m × 0·25 mm × 0·25 μm EC1 capillary column (Grace) under the following conditions: 140°C for 2·5 min and then 10°C/min to 220°C for 4·5 min. Injections (1 μl) were made in the split mode with a 40:1 split. Helium at a constant flow rate of 1 ml/min was used, and the temperatures of the injector and the interface line were 275 and 280°C, respectively. Fragment ions (for both concentration and enrichment) were measured at m/z 159, 160 and 161 for 3-OHB and at m/z 273, 275 and 277 for AcAc with a 50 ms dwell time on each ion. The 3-OHB fragment(Reference Des, Montgomery and Desrochers25) contained only carbons 3 and 4, and thus m/z 160 (m+1) represents 13C from the infusate [2,4-13C]3-hydroxybutyrate, while m/z 161 (m+2) is 3-OHB produced from [1,2,3,4-13C]acetoacetate. In contrast, m/z 277 (m+4) for AcAc represents the dilution of the infusate [1,2,3,4-13C]acetoacetate, while m/z 275 (m+2) is derived from the conversion of [2,4-13C]3-hydroxybutyrate to AcAc. Plasma concentrations were determined using isotope dilution GC–MS after the addition of an internal standard solution containing [1,2,3,4-13C]acetoacetate and [2,4-13C]3-hydroxybutyrate to a separate plasma sample(Reference Calder, Garden and Anderson26). These values are those used for the compartmental model analysis and assessment of chronic (4-week) responses to the weight-loss diets.
Plasma amino acid concentrations were determined in a single analysis using isotope dilution as described previously(Reference Calder, Garden and Anderson26), but with the addition of two components, homocysteine(Reference Wilson, van den Borne and Calder27) and arginine, the latter was monitored at m/z 442 and 448 as a nitrile breakdown product of the derivative that chromatographed between lysine and histidine(Reference Patterson, Carraro and Wolfe28). All GC–MS data and calculations were based on tracer:tracee ratios.
Model structure and statistical analyses
A two-pool accessible model(Reference Cobelli, Nosadini and Toffolo29, Reference Bougneres and Ferre30) was used to describe whole-body ketone body kinetics, including the interconversion of AcAc and 3-OHB (Fig. 3). The nomenclature Fxy represents the flow to pool x from pool y, and the specific pools are defined in Fig. 3. The rate of appearance (Ra) of glucose was calculated as the ratio of 6,6-[2H2]glucose infusion rate to the mean plasma tracer:tracee ratios. For the first four subjects (in the fasted state), Ra was taken to represent endogenous glucose production (EGP). For the remaining eight subjects, the glucose entry rate represented residual EGP plus absorbed glucose; residual EGP will be less than EGP under fasting conditions due to the suppression of gluconeogenesis and glycogenolysis by the increased plasma concentrations of glucose(Reference Ader, Ni and Bergman31) and insulin(Reference Cherrington, Edgerton and Sindelar32). The HPLC and HPMC breakfasts provided 7·5 and 57 g, respectively, of combined starch and total sugars.
Two-compartment model of ketone body metabolism. The nomenclature Fxy represents the flow (F) to pool x from pool y, with all units being μmol/min per kg body weight. Acetoacetate (AcAc) represents the whole-body pool of acetoacetate (a) and 3-hydroxybutyrate (3-OHB) represents the whole-body pool of 3-OHB (b). The interconversions of AcAc to 3-OHB and from 3-OHB to AcAc are given as Fba and Fab, respectively. Fao (and Fbo) represents the inflows of AcAc (or 3-OHB) from body sources (e.g. mobilisation of body fat), while Foa (and Fob) represents the outflows of AcAc (or 3-OHB) for metabolic purposes (e.g. oxidation to provide energy). Total flow (Fa) through the AcAc pool at steady state represents the sum of inflows (Fao+Fab) or outflows (Foa+Fba), with a similar reasoning being used for the total flow (Fb) of 3-OHB.
A composite hunger score(Reference Chaput, Gilbert and Gregersen33) was determined from the psychometric data, based on the following:
 $$\begin{eqnarray} (hunger + desire\ to\ eat + (100 - fullness) + quantity\ able\ to\ eat)/4. \end{eqnarray}$$
The metabolic and kinetic data for the HPLC v. HPMC diets were analysed by ANOVA using Genstat version 13 (VSN International), with subject and order and nutrient intake (fasting or post-breakfast), plus their interactions, within the subjects being treated as random effects and with order, diet and nutrient intake plus their interactions as fixed effects. Where comparisons also included either or both dietary intervention periods at maintenance, the effects of order on both the main diets (HPLC v. HPMC) and maintenance diets (M1 and M2) were determined first. In most cases, these were not significant. and therefore, the data were then re-analysed with subject and nutrient intake within subject as a random effect and with nutrient intake and diet, plus their interactions, as fixed effects. For all the analyses, P< 0·05 was considered to be significant and, where appropriate, post hoc t tests were used. For the composite hunger data, based on hourly measurements taken over 26 d when awake during the HPLC or HPMC dietary intervention periods, the random factors were subject with diet, week and time (of day) and their interactions within subject, while the fixed factors were order plus diet, time and week and their interactions. When only the last week of each dietary intervention period was considered, week was removed from the analysis.
ANOVA was also used to analyse the PET brain data. First, overall responses in all the regions of the brain were compared (with each being given equal weight) with subject plus period, region and side and their interactions within subject as random effects and diet, period, nutrient intake and side plus their interactions as fixed effects. Effects within separate regions of the brain were then compared with subject plus period and side and their interactions within subject as random effects and diet, nutrient intake, period and side plus their interactions as fixed effects. In this case, the diet term consists of HPLC and HPMC, as no measurements were taken during the periods at maintenance. Period, rather than order, was considered as the subjects continued to be in a state of negative energy balance and lost weight between periods 1 and 2. To reduce the likelihood of type 1 or 2 errors, P< 0·001 was taken as the main level of statistical significance. In practice, decreasing the value of P to < 0·01 did not alter the main outcomes.
Results
General responses
The twelve subjects who completed all aspects of the study protocol and for whom kinetic and PET measurements were taken formed part of a slightly larger group (n 16) for whom nutritional and anthropomorphic responses have been described previously(Reference Johnstone, Lobley and Horgan17). The responses of these twelve subjects closely followed the outcomes for the larger group. Briefly, the subjects lost 6·3 and 4·2 kg body weight during each of the 4 weeks in the HPLC and HPMC dietary intervention periods, respectively, of which 4·5 and 3·2 kg lost were fat mass. Much of the additional loss was related to body water, with protein mass remaining unaltered(Reference Johnstone, Lobley and Horgan17). There were improvements (P< 0·001) in homeostatic assessment of insulin resistance (HOMA2-IR) values for both the dietary interventions compared with the values obtained during the baseline M1 dietary intervention period, associated mainly with a 23–35 % decrease in fasting insulin concentrations (P< 0·001) and a smaller decline (3–8 %) in plasma glucose concentrations (P= 0·010). Improvements were also observed for lipaemia in response to the two weight-loss diets with decreased plasma cholesterol (P= 0·022), LDL (P= 0·009) and TAG concentrations (P< 0·001), while both HDL concentrations (P= 0·004) and LDL:HDL ratio (P< 0·001) were improved. In terms of the composite hunger score, over the 4 weeks during each of the HPLC and HPMC dietary intervention periods, there was a diet × week interaction (P= 0·005), and for the last week of each dietary intervention period (the period when the PET scan and ketone tracer kinetic measurements were carried out), the scores were lower for the HPLC dietary intervention than for the HPMC diet (26·8 v. 31·1, sed 1·42, P= 0·013).
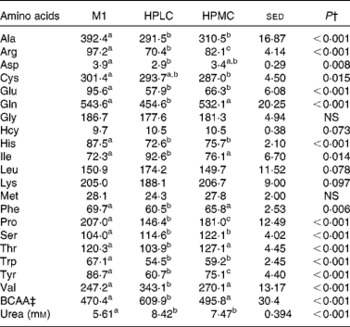
As expected, in the fasted state, both the HP diets led to increased plasma urea concentrations (33–50 %, P< 0·001; Table 2) compared with the M1 diet, although responses for amino acid concentrations varied markedly. For example, among the concentrations of essential amino acids, those of plasma methionine and lysine remained unchanged, while, despite the increased protein intake, those of tryptophan and histidine (P< 0·001) decreased for both the HPLC and HPMC weight-loss dietary interventions. The concentrations of phenylalanine and threonine were lower for the HPLC dietary intervention (P< 0·01), while those of the combined branched-chain amino acids increased (P< 0·001). Among the concentrations of non-essential amino acids, those of alanine, arginine, glutamate, proline and tyrosine decreased for both the HP weight-loss dietary interventions, but often to a greater extent for the HPLC diet, while those of serine increased (P< 0·001). The concentrations of glutamine were lower for the HPLC dietary intervention (P< 0·001), but remained unchanged for the HPMC diet.
Effect of consumption of a maintenance (M1) diet* for 7 d and then either a high-protein, low-carbohydrate (HPLC) or a medium-carbohydrate (HPMC) diet* for 4 weeks on plasma amino acid concentrations (μm) in twelve subjects who fasted overnight
BCAA, branched-chain amino acids.
a,b,cValues within a row with unlike superscript letters were significantly different (P< 0·05).
* The M diet was given at RMR (MJ/d) × 1·6 for the first week, followed by the HPLC and HPMC diets, which were given at a fixed energy intake (8·3 MJ/d), each for 4 weeks with the order being randomised.
† Based on ANOVA with the twelve subjects blocked as random effects. Data were first analysed for the effect of diet order of the HPLC and HPMC diets, with order and diet treatment and their interactions as fixed effects. There were significant order × diet interactions for glutamate ( < 0·001) and homocysteine (0·013). Data were then analysed with maintenance included with diet treatment as a fixed effect with twenty-two residual degrees of freedom. The sed reported is related to the effect of diet.
‡ Sum of BCAA (isoleucine, leucine and valine).
Glucose and ketone body kinetics
On the day of kinetic measurements, fasting glucose concentrations were lower when the subjects were given the HPLC diet than when given the M1 diet (5·57 v. 6·11 mm, P= 0·004), with values for the HPMC dietary intervention being intermediate (5·84 mm, P= 0·028 v. the HPLC dietary intervention). Plasma glucose concentrations were lower for subjects who fasted than for those given a breakfast (5·08 v. 5·89 mm, P< 0·001). For the first four subjects, under fasting conditions, the Ra was equivalent to EGP and was, on average, 13 % greater for the HPMC dietary intervention (P= 0·028; Table 3). For the subjects given a breakfast, glucose Ra (a combination of non-suppressed EGP and absorbed glucose) increased for both the dietary interventions, by 33 % (P= 0·017) for the HPLC diet and by 94 % for the HPMC diet (P< 0·001), compared with that observed in subjects who fasted. In the postprandial condition, Ra for the HPMC dietary intervention was 71 % greater than that for the HPLC diet (P< 0·001).
Effect of a high-protein plus either a low-carbohydrate (HPLC) or a medium-carbohydrate (HPMC) diet* on the glucose entry rate (Ra, rate of appearance) in the twelve subjects, in four of whom measurements were taken after an overnight fast and in eight 4 h after being given a 2·77 MJ breakfast
BW, body weight.
* HPLC and HPMC diets were given at a fixed energy intake (8·3 MJ/d), each for 4 weeks with the order being randomised.
† Based on ANOVA with subject and period within the subjects as random effects and with order and diet, plus their interactions, as fixed effects. For all the subjects who fasted or were given a breakfast, the residual degrees of freedom were 10, 2 and 6, respectively. There were no significant effects of order (i.e. whether the HPLC or the HPMC diet was given first), so the sed and P values are related only to the effect of diet. Comparison of diet and nutrition (fed v. fasted) as a fixed effect showed an increase in Ra when a breakfast was given (1372 v. 827 μmol/min, sed 67·5, P< 0·001), with a diet × nutrition interaction (P< 0·001) being driven by the greater response for the HPMC dietary intervention when a breakfast was given. Similar responses were observed for data expressed per kg BW.
Plasma AcAc and 3-OHB concentrations were greater after an overnight fast (14–18 h) during the HPLC dietary intervention period than during the HPMC diet (by 75 and 170 %, respectively, Table 4). For the four subjects for whom measurements were taken in the fasted state, however, during the last 1 h of tracer kinetic measurement period, the plasma concentrations of both AcAc and 3-OHB increased during four of the eight experimental periods (data not shown). For this reason, the remaining eight subjects were given a breakfast 4 h before the PET scan and kinetic measurements, and this resulted in stable plasma concentrations of both ketones, but which again were greater for the HPLC dietary intervention than for the HPMC diet (by 4- and 6·5-fold for AcAc and 3-OHB, respectively, P< 0·001, Table 4). Whole-body ketone kinetics when fitted to a two-pool model(Reference Cobelli, Nosadini and Toffolo29, Reference Bougneres and Ferre30) allowed for the interconversion of AcAc and 3-OHB (Fig. 3), and these were greater (P< 0·05) in both directions for the HPLC dietary intervention than for the HPMC diet in both the overnight fasting and post-breakfast conditions. For subjects given the HPMC diet, fasting before measurements resulted in greater flows (μmol/min per kg) through the 3-OHB pool for Fb (3·22 v. 0·95, P= 0·013), Fbo (2·4 v. 0·67, P= 0·004) and Fob (1·97 v. 0·57, P= 0·003) than after consumption of a breakfast. In contrast, there were no effects of the fed v. fasted state on total flows through the AcAc pool. Furthermore, the fasted or post-breakfast state had no impact on ketone body parameters when the subjects consumed the HPLC diet. Nonetheless, regardless of the subjects consuming the diets or fasting, the same responses in whole-body ketone kinetics to the HPLC and HPMC dietary interventions were observed (Table 4). Indeed, when data for all the twelve subjects were combined, the calculated flows were greater (P< 0·001) for the HPLC dietary intervention and, as a result, so were the total flows through either the AcAc pool (Fa, 6·65 v. 2·12 μmol/min per kg, P< 0·001) or the 3-OHB pool (Fb, 5·97 v. 1·71 μmol/min per kg, P< 0·001). If Foa and Fob are assumed to represent the complete oxidation of AcAc and 3-OHB, respectively, then, when combined, these would represent 0·16 and 0·45 of whole-body CO2 production for the HPMC and HPLC dietary interventions, respectively, and these differed significantly (P< 0·001). During the period of tracer kinetic measurement, the respiratory quotient (RQ) values were lower for the HPLC dietary intervention than for the HPMC diet (0·78 v. 0·86, sed 0·033, P= 0·031), and this was associated with reduced CO2 production (205 v. 216 ml/min, sed 4·4, P= 0·032), but no change in VO2 was observed. The RQ values did not differ between the fasting and post-breakfast conditions (0·77 v. 0·84, sed 0·041, P= 0·119). These diet-related values were similar (P= 0·203) to those measured early in the final week and immediately after an overnight fast.
Effect of either a high-protein, low-carbohydrate (HPLC) or a high-protein, medium-carbohydrate (HPMC) diet* on plasma concentrations (μm) of acetoacetate (AcAc) and 3-hydroxybutyrate (3-OHB) and compartmental flows† (Fxy, μmol/min per kg body weight) in twelve subjects, in four of whom measurements were taken after an overnight fast and in the remaining eight 4 h after being given a 2·77 MJ breakfast
* HPLC and HPMC diets were given at a fixed energy intake (8·3 MJ/d), each for 4 weeks with the order being randomised.
† Based on the two-compartment model described in Fig. 3, where flow Fxy represents the flow from pool x from pool y. Thus, Fab and Fba represent the interconversions of AcAc and 3-OHB, while Fao and Fbo represent the flows from other body sources into the AcAc and 3-OHB pools, respectively, while Foa and Fob represent the corresponding outflows to other metabolic fates within the body. Data from 2 h infusions of [1,2,3,4-13C]acetoacetate plus [1,2-13C]3-hydroxybutyrate in the twelve subjects (four fasted overnight and eight were given an appropriate breakfast 3 h before the start of the infusions).
‡ Based on ANOVA with subject and order within subject as random effects and with order and diet, plus their interactions, as fixed effects. For subjects who fasted and were given a breakfast, the residual degrees of freedom were 2 and 6, respectively. There were no significant effects of order (i.e. whether the HPLC or HPMC diet was given first), so the sed and P values are related only to the effect of diet. Comparison of diet and nutrition (fed v. fasted, ten residual degrees of freedom) as fixed effects yielded no effect (P>0·05) of nutrition on the concentrations or flows of either AcAc or 3-OHB.
Positron emission tomography scan dynamics
When the global responses of all the fifty-four regions present in both the hemispheres of the brain were considered (Table 5), the fractional influx of 18FDG into the brain from the plasma (k 1) was greater for the HPLC dietary intervention than for the HPMC diet, although this only reached significance for those given a breakfast (46 %, P= 0·004). Furthermore, the overall values for k 1 were lower for subjects who fasted overnight ( − 25 %, P< 0·001). Responses in k 2 were similar to those in k 1, greater for the HPLC dietary intervention than for the HPMC diet, but this effect of diet was only significant following consumption of a breakfast (77 %, P= 0·015), with values being lower in the fasted state ( − 27 %, P= 0·015). The effect of diet (HPLC or HPMC) on K net also varied between the fasted and fed states, being lower for the HPLC dietary intervention in the fasted state (P= 0·09) and greater after consumption of a breakfast (P= 0·049). These differences in K net were reflected in the MRGlc values, which only increased in response to the HPLC dietary intervention for the four subjects for whom measurements were taken in the fasting condition (P= 0·014).
Effect of high-protein diets with either low (HPLC) or moderate (HPMC) carbohydrate supply on parameters from the three-compartment model that describes the rates of glucose (18FDG, 18fluoro-deoxyglucose) transfers across the combined (left and right) regions (n 54) of the brain (excluding the vermis) when the subjects either fasted overnight (n 4) or were given a 2·77 MJ breakfast 4 h (n 8) before the positron emission tomography (PET) scan
k 1, fractional influx of 18FDG into the brain from the plasma; k 2, fractional efflux of 18FDG to the plasma; k 3, rates of conversion of 18FDG to 18FDG-6-phosphate; K net, fractional net transfer; MRGlc, calculation of the glucose metabolic rate.
* Based on ANOVA with subject and order, region and side plus their interactions within subject being treated as random effects and diet, side and order plus their interactions as fixed effects. Data are presented as mean values for diet comparisons with all the regions being given equal weight and when the subjects either fasted overnight (16–18 h) or were given a 2·77 MJ breakfast 4 h before the PET scan. Probabilities (P) for diet (d), side (s) and period (p). When all the data were combined, the effect of intake (either fasted or fed before the PET scan) was included within the fixed effects, and this produced significant effects for k 1 (P< 0·001), k 2 (P= 0·015), K net (P< 0·001) and MRGlc (P< 0·001). Side was not considered for the combined regions of the vermis, but there was an effect of diet on k 1 and K net (both P< 0·01) and MRGlc (P< 0·05), with these three parameters also being affected by intake (all P< 0·001).
† MRGlc rate of glucose uptake by the brain (μmol/min per 100 ml).
If regional data across all the subjects were combined (from Table 5), the fractional influx of 18FDG into the brain from the plasma (k 1) was 27 % greater for the HPLC dietary intervention (P= 0·002) and 1 % higher for the right hemisphere (P= 0·005). There were no effects of any of these parameters on the rates of conversion of 18FDG to 18FDG-6-phosphate (k 3). In contrast, fractional efflux of 18FDG to the plasma (k 2) was 61 % greater for the HPLC dietary intervention (P= 0·008). In terms of K net and MRGlc, there were no overall effects of diet, but values were 1 % higher (P< 0·05) for the right hemisphere. When a similar analysis was carried out for the combined vermis regions, then k 1 was 32 % higher (P= 0·002) for the HPLC dietary intervention, as were K net (11 %, P= 0·001) and MRGlc (6 %, P< 0·05). There were also strong effects of intake (P< 0·001), with k 1 ( − 27 %), K net ( − 42 %) and MRGlc ( − 32 %) being lower for the subjects given a breakfast.
When separate regions of the brain were analysed, the fractional removal of 18FDG (k 1) to the tissue pool from the plasma was greater (P< 0·01) for the HPLC dietary intervention in thirty-seven regions of the fifty-four examined, and this increased to forty-six regions when differences were assessed at P< 0·05. This corresponds to the lower plasma glucose concentrations observed on consumption of the HPLC diet (5·54 v. 5·82 mm, P= 0·003). Among the areas not to show a statistically significant response were three regions of the cerebellum. In contrast, the fractional conversion of 18FDG to 18FDG-6-phosphate in the tissue pool (k 3) was unaffected by diet across all the regions. The fractional efflux of 18FDG from the brain to the plasma (k 2) was also greater for the HPLC dietary intervention than for the HPMC diet for a number of areas within specific regions, including the cerebellum (P< 0·05>0·001), frontal lobe (P< 0·05>0·001), hippocampus (P< 0·05), occipital region (P< 0·01), parahippocampus (P< 0·01), parietal lobe (P< 0·01), temporal lobe (P< 0·01) and the thalamus (P< 0·05). As both influx (k 1) and efflux (k 2) increased on consumption of the HPLC diet, the fractional net uptake (K net) was not significantly different from that observed for the HPMC dietary intervention across any of the regions examined. The level of intake (fasting v. given a breakfast) also had an impact on the rate constants, with k 1, k 2 and K net being greater (P< 0·01) in thirty-six, fourteen and forty-six regions, respectively, for those who fasted. Overall, the higher fractional rate constants for the HPLC dietary intervention were counteracted by the lower plasma glucose concentrations, and therefore, the rate of glucose uptake (MRGlc μmol/min per 100 ml) was similar for the two dietary interventions, except in the case of the angular, paracentral lobe and precuneus regions, where the rate was lower for the HPLC dietary intervention (all P< 0·05).
Discussion
Metabolic responses
In agreement with previous observations(Reference Johnstone, Horgan and Murison7), at the end of each dietary intervention period, the composite hunger score was lower for the HPLC dietary intervention than for the HPMC diet, even though the high protein intake was similar. Furthermore, and as expected, the very-low-carbohydrate diet (HPLC) established a moderate state of ketosis(Reference Johnstone, Horgan and Murison7). During the last week of each dietary treatment period, fasting values of 3-OHB were nearly 4-fold greater on consumption of the HPLC diet than on that of the HPMC diet. This pattern was confirmed on the day of kinetic measurements when the plasma concentrations of AcAc and 3-OHB were 3-fold greater for the HPLC dietary intervention than for the HPMC diet. There was an impact of intake, however, as the subjects on the HPMC diet given a breakfast several hours before the infusion of stable isotopes had lower concentrations of AcAc ( − 57 %) and 3-OHB ( − 75 %) when compared with those who fasted. The ratio of 3-OHB:AcAc plasma concentrations was lower than that normally observed ( ≥ 3:1) for subjects who fasted for 24 h or longer(Reference Balasse18), but this is probably due to the provision of a breakfast for eight of the subjects. Furthermore, the gluconeogenic nature of the high protein supply may also have reduced the impact on ketone concentrations. Nonetheless, regardless of the subjects fasting or being given a breakfast, there was a strong effect of diet, with the dynamic flows of the ketone bodies (Foa and Fob) being 1·6- to 5-fold higher during the HPLC dietary intervention period than during the HPMC diet. Indeed, if the net flows (Foa and Fob) represent the amounts available for complete oxidation, then nearly half of the resting whole-body CO2 production would arise from ketone body metabolism on consumption of the HPLC diet. Therefore, ketone bodies become a more important source of energy on consumption of the HPLC diet, when dietary glucose supply is limited, as is observed in the longer-term fasted state(Reference Balasse18).
Despite only 23 g of carbohydrate being provided daily by the HPLC diet, EGP in the fasted state was maintained at 196 g/d. Indeed, this was just 35 g/d (15 %) less than that observed after an overnight fast for the HPMC dietary intervention where daily carbohydrate intake was 182 g. EGP is normally dominated by liver metabolism(Reference Landau, Wahren and Chandramouli34, Reference Meyer, Stumvoll and Welle35), although during a prolonged fast, the kidney can also provide substantial amounts of glucose(Reference Meyer, Stumvoll and Welle35, Reference Gerich, Meyer and Woerle36). Hepatic release of glucose occurs through gluconeogenesis and glycogenolysis, with each contributing approximately equally to EGP after an overnight fast for subjects fed normal Western diets(Reference Landau, Wahren and Chandramouli34). For the HPLC dietary intervention, however, liver glycogen stores are assumed to be minimal, and therefore, gluconeogenesis becomes predominant, probably from gluconeogenic amino acids, lactate and glycerol. The protein supply from the HPLC diet was 137 g/d, and based on stoichiometric conversions, this could yield an additional 85 g of glucose, but this still would be only 30 % of the measured glucose entry rate, Nonetheless, hepatic conversion of dietary protein to glucose may account for the marked decrease in plasma concentrations of a number of amino acids, in particular, those classified as non-essential (alanine, glutamate and glutamine) considered as important gluconeogenic precursors in other mammals(Reference Wolff and Bergman37). The impact of breakfast type also did not alter glucose production greatly. For example, the HPLC breakfast contained 8 g of carbohydrate and, at the time of measurement (approximately 4 h after consumption of the meal), increased the Ra of glucose by only 2·7 g/h. The HPMC breakfast contained 60 g of carbohydrate, but it increased the Ra by only 9 g/h when measured in the post-absorptive state. The intake of carbohydrate and protein for both the HPLC and HPMC dietary interventions would leave a ‘shortfall’ compared with glucose Ra of 140–180 g/d, with presumably most of this being derived from recycling of three-carbon units. These various metabolic interconversions to maintain the glucose entry rate and provision of glucose as a fuel throughout the day might explain why the respiratory quotient values of subjects who fasted overnight were not as low as would be expected if just fat were oxidised. An alternative explanation would involve non-compliance by the subjects, but this is considered unlikely due to the close supervision involved.
Originally, it was intended to carry out all the measurements in the overnight-fasted state, as has been done for the first four subjects. In practice, the natural delay in synthesising the short-lived radioisotopes for the PET scan meant that the duration of the normal overnight fast of 10–12 h was extended to 15–18 h and some individuals on the HPMC diet experienced ketosis (as assessed by increased plasma 3-OHB concentrations during the period of the PET scans). Following the change from the M1 to the HPLC diet, ketosis occurred within 24–48 h, as assessed by the spot urine samples (for AcAc detection) or raised plasma 3-OHB concentrations. The more rapid ketosis induced with the HPMC diet after an extended overnight fast may indicate that the moderate carbohydrate intake (approximately 180 g/d) for this diet was insufficient to fully maintain body glycogen stores, with more reliance on body fat mobilisation and ketone body production during the extension of the duration of the fast. Alternatively, the fact that the subjects were in a state of negative energy balance throughout both the diet intervention periods meant that they had already mobilised body fat and so were metabolically ‘primed’ to switch to increased ketone body production. Regardless of the reason, this finding necessitated a change in experimental protocol to offer a breakfast meal approximately 4 h before the PET scan.
Use of fuels by the brain
Under normal dietary conditions, the uptake of ketones by the human brain can be less than 1 % of glucose removal(Reference Blomqvist, Thorell and Ingvar15), although after starvation for 6 weeks, less than 30 % of the fuel used by the brain comes from glucose with the majority coming from ketones(Reference Owen, Morgan and Kemp38). This flexible ability to switch from glucose to ketones as the energy source leads to conservation under conditions of low carbohydrate supply (e.g. during prolonged fasting) and limits mobilisation of lean (muscle) tissue to provide amino acids as gluconeogenic substrates. This then raises the issue as to what happens under conditions of moderate (but submaintenance) energy intakes but where carbohydrate supply remains very low. Low-carbohydrate (ketogenic) diets are used extensively in two scenarios: one for the control of epilepsy(Reference Yudkoff, Daikhin and Nissim39), especially in children, and the other for the inhibition of hunger at submaintenance energy intakes(Reference Johnstone, Horgan and Murison7). Indeed, such diets have proved to be an effective route to achieve weight loss under both free-living and laboratory conditions(Reference Weigle, Breen and Matthys4, Reference Foster, Wyatt and Hill5, Reference Johnstone, Horgan and Murison7, Reference Volek, Sharman and Gomez40). Although there is debate as to the importance of protein in the regulation of hunger, which is the (usual) replacement for carbohydrates in such diets(Reference Batterham, Heffron and Kapoor41–Reference Potier, Darcel and Tome43), a very low carbohydrate status does reduce both energy intake (by 0·5 MJ/d) and hunger scores (by 21 %) in addition to any protein-based response(Reference Johnstone, Horgan and Murison7). The latter effect was substantiated in the present study under conditions of a fixed intake. Based on the glucostatic theory of appetite control(Reference Lopez, Tovar and Vazquez44, Reference Solomon, De Fanti and Martinez45), the reduced uptake of glucose by the brain and(or) substitution by ketones may account for both the reduced energy intake and the lower hunger ratings.
In both rodents(Reference LaManna, Salem and Puchowicz46) and humans(Reference Blomqvist, Alvarsson and Grill47), the uptake of ketones by the brain is driven by plasma concentrations of 3-OHB and AcAc. In rats, the use of a ketogenic diet with less than 2 % energy as carbohydrate has been shown to lead to an 8-fold increase in the uptake of ketones by the brain(Reference Bentourkia, Tremblay and Pifferi48), similar to the response observed after a 48 h fast, while a diet with less than 0·1 % of carbohydrate has been shown to suppress glucose consumption by the brain by approximately 10 % for every millimolar increase in plasma 3-OHB concentrations(Reference LaManna, Salem and Puchowicz46). Acute hyperketonaemia in humans subjects, induced by the infusion of 3-OHB into the bloodstream for 3.5 hours, has also been shown to result in a 5-fold increase in the uptake of ketones by the cerebrum and a 33 % decrease in the use of glucose by the brain(Reference Hasselbalch, Madsen and Hageman49). Within the present study, a less pronounced ketotic state occurred than is found in either the prolonged fast or starved situation(Reference Owen, Morgan and Kemp38) or with the ketogenic diets used in the rat(Reference LaManna, Salem and Puchowicz46) or human(Reference Hasselbalch, Madsen and Hageman49) in that combined 3-OHB and AcAc only achieved 1 mm in plasma, compared with >3 mm in those studies with severe dietary restriction and >2 mm for the acute infusion of ketones. In the present study, plasma ketone concentrations were typical of those reported for other HP, low-carbohydrate weight-loss regimens(Reference Veldhorst, Westerterp and van Vught50, Reference Johnston, Tjonn and Swan51) and therefore reflect the practical and chronic situation on using such regimens. Nonetheless, the high dietary protein supply may act as a precursor for glucose synthesis, and this may prevent the development of more severe ketosis. This additional gluconeogenesis may also help provide the brain with sufficient glucose and reduce the need to increase the use of ketones as a cerebral fuel when LC diets in combination with HP intakes are consumed.
The brain has the ability to increase the fractional rate of glucose uptake (k 1) in response to lowered glucose supply, as demonstrated by a 12 % increase after 3·5 d of starvation(Reference Hasselbalch, Knudsen and Jakobsen12) and the 27 % higher rate for the HPLC v. the HPMC dietary intervention in the present study. In the case of subjects who starved, the proportional increase in k 1 was less than the decrease in plasma glucose concentrations and so MRGlc was decreased by 26 %(Reference Hasselbalch, Knudsen and Jakobsen12). This is in contrast to the maintained MRGlc between the HPLC and HPMC dietary interventions observed in the present study. In this respect, the use of very-low-carbohydrate diets does not mimic the effects of starvation, probably related to gluconeogenesis from other metabolites of either a dietary or an endogenous origin. Global responses can be misleading, however, due to the functional heterogeneity of the brain, hence the need to examine changes between specific regions with regard to glucose uptake.
In this regard, and perhaps surprisingly, the hypothalamus did not show any difference between the two dietary interventions, although this has been identified in both rodents(Reference Morton, Cummings and Baskin14) and humans(Reference De Silva, Salem and Matthews52, Reference Lizarbe, Benitez and Sanchez-Montanes53) as an important centre for appetite control. Notably, the hypothalamus is a site of action for a number of hormones, including insulin, leptin and adiponectin, and where anorexigenic and orexigenic peptides are involved in the depression or stimulation of food intake(Reference Ahima and Antwi10, Reference Rosenbaum, Sy and Pavlovich54). In addition, specific areas of the brain, including the hypothalamus, hindbrain and forebrain, have glucose-sensing neurons that participate in mechanisms involved in the control of glucose homeostasis and feeding behaviour(Reference Marty, Dallaporta and Thorens55, Reference Levin, Routh and Kang56). Functional MRI studies with subjects under hyperinsulinaemic conditions and controlled for either euglycaemia or hypoglycaemia have shown an increased activation of the prefrontal cortex and anterior cingulate cortex in the euglycaemic state and the activation of other regions such as the nucleus accumbens, insula, hypothalamus, thalamus, caudate and putamen preferentially under hypoglycaemic conditions, with some responses being greater for obese subjects than for lean subjects(Reference Page, Seo and Belfort-DeAguiar57). Interestingly, obese subjects have lowered prefrontal activity both at rest(Reference Volkow, Wang and Telang58) and following consumption of a meal(Reference Le, Pannacciulli and Chen59), while the postprandial deactivation of hypothalamic activity is also attenuated in subjects with a high BMI(Reference Gautier, Chen and Salbe60). Such reduced activation for both the prefrontal cortex and hypothalamus in their separate responses to feeding and fasting may contribute to poor appetite control, with resultant obesity. Other studies that have shown responses in brain activity have also focused on the transition from the fasted to the fed state, as has been done for the hypothalamus(Reference Batterham, Heffron and Kapoor41) and the prefrontal cortex(Reference Tataranni, Gautier and Chen61). The present study differs from most other reports in that the comparison was made between two different dietary interventions either for the overnight-fasting condition or during the post-absorptive phase and where any differences, if they exist, may be more subtle, particularly with the ability of the body to maintain a glycaemic state within tight bounds even when the carbohydrate supply varies greatly. If obese subjects do show lower sensitivity in terms of either signal recognition or metabolic response, then this may also reduce the magnitude of any diet-based differences. A further consideration is that for both the HPLC and HPMC dietary interventions, the subjects were in a state of negative energy balance for 4 weeks during each dietary intervention period, and this may have had an impact on the regulation of appetite and hunger.
The present study demonstrated the remarkable ability of the body to mitigate the chronic impact of very low carbohydrate supply on plasma glucose concentrations. Furthermore, the brain is able to adjust to the resultant small decrease in glucose concentrations by alteration of the fractional transfer rates of glucose, such that for most regions the net movements are similar, even with a near 10-fold difference in dietary carbohydrate provision. Although the impact of ketosis was determined indirectly, by the measurement of the uptake of glucose by the brain rather than by measuring ketone body metabolism, the overall effects appear small, and this would fit with the difference in intakes of only 0·6 MJ, albeit accompanied with lower hunger scores, between the HPLC and HPMC diets when given ad libitum (Reference Johnstone, Horgan and Murison7) or at fixed intakes as done in the present study. Importantly, under ad libitum conditions, both the dietary interventions led to a decrease greater than 5 MJ compared with the maintenance diet(Reference Johnstone, Horgan and Murison7), and this implies that dietary components independent of those that lead to increased ketogenesis are responsible for the decrease in appetite and improved hunger scores on consuming such HP diets.
Acknowledgements
The authors are grateful to Marion Scott, Jean Bryce, Nina Lanza and Kim Giles for their assistance with the preparation of the diets used in the present study. They are also grateful to Sylvia Stephen and Linda Dewar for their support in the Human Nutrition Unit.
A part of this work was supported by the Chief Scientist's Office of the Scottish Government (grant CZG/1/131), while the remainder was funded as part of the Rural and Environment Science and Analytical Services Division core grant from the Scottish Government to the Rowett Institute of Nutrition and Health, University of Aberdeen. Neither sponsor had any role in the design and analysis of the study or in the writing of this article.
The authors' contributions are as follows: A. M. J., G. E. L., G. W. H., A. W. and I. B. were responsible for study concept and design. A. M. J., G. E. L., D. M. B. and C. F. were responsible for data collection and collation. L. S. synthesised isotopes for PET analysis. Mr A. Graham Calder developed and conducted all the MS analyses. A. M. J., G. E. L., G. W. H., G. H., A. W. and C. F. were responsible for data analysis. A. M. J., G. E. L., G. W. H., G. H., I. B. and A. W. were responsible for the first draft and critical revision of the manuscript for important intellectual content.
None of the authors has any conflicts of interest.


