


1. Introduction
A large segment of the Indian population relies heavily on natural resources for sustenance, leading to concerns over environmental degradation. Elected leaders play a crucial role in this context, as the success and on-ground implementation of environmental policies are largely influenced by their decisions, which are often guided by political incentives. These incentives, such as re-election prospects, are inherently tied to electoral cycles and have critical implications for environmental outcomes like forest fires and deforestation (Pailler, Reference Pailler2018, Balboni et al., Reference Balboni, Burgess, Heil, Old and Olken2021, Reference Balboni, Berman, Burgess and Olken2023, Cisneros et al., Reference Cisneros, Kis-Katos and Nuryartono2021).
Electoral cycles in India have been empirically linked to various non-environmental outcomes, reflecting a pattern of political opportunism in the distribution of resources and policy manipulation. For instance, Fagernäs and Pelkonen Reference Fagernäs and Pelkonen(2020) document a significant increase in the hiring and transfer of teachers in the aftermath of state elections. This phenomenon is hypothesized to be driven by corrupt practices, such as the payment of bribes to political actors in exchange for favourable transfers, or by politicians strategically using these transfers to consolidate political support. The resulting disruptions in staffing are shown to negatively impact student learning outcomes. Similarly, Cole Reference Cole(2009) and Baskaran et al. Reference Baskaran, Min and Uppal(2015) identify electoral cycles manifesting as increased provision of agricultural credit and enhanced electricity services during election years, suggesting that incumbent politicians manipulate public goods distribution to maximize electoral returns.
In a related study, Sukhtankar Reference Sukhtankar(2012) provides evidence of political embezzlement in the agricultural sector, where politically controlled sugarcane mills suppress prices paid to farmers during election years to raise funds for campaign financing. This practice reduces farmer incomes, with compensation typically occurring after the politicians are elected. Furthermore, Dar et al. Reference Dar, Gupta and Verma(2018) examine price manipulation of onions – a politically sensitive commodity in India – finding that onion prices are systematically reduced before elections to sway voter sentiment. Similarly, Basistha et al. Reference Basistha, Dhillon and Chaudhuri(2024) show that incumbents strategically sanction new road construction projects just before elections to signal their competence, leveraging the visible aspects of road building.
This study expands the existing body of literature by examining the role of electoral cycles in influencing environmental outcomes in India. It specifically focuses on key environmental issues, including stubble burning, forest fires, slash-and-burn fires, and tree cover. These environmental outcomes warrant attention as they adversely impact air quality (Jain et al., Reference Jain, Bhatia and Pathak2014) and public health (Rangel and Vogl, Reference Rangel and Vogl2019, Tan-Soo and Pattanayak, Reference Tan-Soo and Pattanayak2019). Despite these public and private costs, farmers continue to burn stubble because it remains the cheapest and quickest method for clearing crop residue. Additionally, both natural factors (such as high temperatures and dry weather leading to wildfires) and human-induced activities (including the use of fire for clearing forests or deforestation to expand agricultural land) contribute to the degradation of forest land. Although many of these human activities are environmentally damaging and illegal, widespread violations of existing bans persist, undermining efforts to curb such practices.
Political incentives form the foundation of political budget cycles. Nordhaus Reference Nordhaus(1975) established the theoretical framework for these cycles based on a few critical assumptions: voters are imperfectly informed and myopic, and political parties prioritize winning elections above all else. In this context, the likelihood of re-election increases when voters’ utility improves ahead of elections. This boost in utility can be achieved through various measures targeting prospective voters. For instance, politicians may enhance the provision of tangible public goods such as roads (Basistha et al., Reference Basistha, Dhillon and Chaudhuri2024), electricity (Baskaran et al., Reference Baskaran, Min and Uppal2015), or healthcare services to improve neonatal mortality (Bhattacharjee, Reference Bhattacharjee2022), thereby signaling their competence to the electorate. Similarly, Vadlamannati Reference Vadlamannati(2015) shows that states with strong governance, where corruption is either low or actively addressed, tend to experience a rise in registered corruption cases during election periods, as political leaders attempt to showcase their commitment to good governance. Furthermore, Chaudhuri et al. Reference Chaudhuri, Schneider and Chattopadhyay(2006) notes that the shadow economy – a proxy for illegal activities – contracts by 4 per cent during election years in India.
Conversely, politicians may also face incentives to engage in corrupt practices (Sukhtankar, Reference Sukhtankar2012), illicit activities like bribing officials for favourable transfers (Fagernäs and Pelkonen, Reference Fagernäs and Pelkonen2020), or neglecting environmental governance (Klopp, Reference Klopp2012, Balboni et al., Reference Balboni, Burgess, Heil, Old and Olken2021). Patronage politics plays a pivotal role in this context, benefiting special interest groups that can reward politicians with campaign contributions or active voter mobilization efforts (Khemani, Reference Khemani2004).
In the environmental domain, politicians aiming to retain power can either invest in protection measures, such as conserving forests and curbing biomass burning, or weaken enforcement efforts, allowing illegal activities like stubble burning, forest fires, or deforestation for resource extraction to continue. In navigating these choices, political parties in India often highlight legitimate public concerns – such as curbing air pollution,Footnote 1 preventing forest degradation, and addressing climate change – in their party manifestos.Footnote 2 However, despite these commitments, many states continue to experience widespread non-enforcement of legal bans aimed at curbing illegal activities like crop burning and deforestation.
The benefits of conserving forests or reducing fire events, such as improved air quality and health outcomes, have several distinct characteristics. First, these benefits are public rather than private, meaning they are broadly shared and non-targeted. In contrast, targeting benefits to special interest groups generates direct and attributable gains, which are more likely to translate into political support (Khemani, Reference Khemani2004, Drazen and Eslava, Reference Drazen and Eslava2010). Second, improvements in forest health are realized only in the medium term, whereas the electoral advantages of allowing forest access for resource extraction are more immediate (Cisneros et al., Reference Cisneros, Kis-Katos and Nuryartono2021, Sanford, Reference Sanford2021). Third, it is difficult to attribute improvements in air quality or forest cover to a particular politician, making it challenging for them to claim credit and signal their effectiveness. Consequently, politicians often adopt strategies that prioritize immediate electoral gains by permitting these illegal activities, thereby appeasing their agriculturally or forest-dependent constituents.
To examine the relationship between election timings and environmental outcomes, this study combines election data with remote sensing data on environmental indicators. India’s state elections are held every five years in assembly constituencies (ACs), where the winners are elected as Members of the Legislative Assembly (MLAs).Footnote 3 The timing of these elections are asynchronous across states, and their timing is predetermined, independent of the socio-economic characteristics of individual ACs. The findings indicate that, for all environmental outcomes (except for slash-and-burn-the estimates) are notably stronger and larger in the pre-election years leading up to elections. This pattern aligns with Reference NordhausNordhaus’s (Reference Nordhaus1975) theory, which suggests that imperfectly informed voters are more likely to emphasize politicians’ recent performance when making decisions, particularly in the years just before elections. This pattern is further influenced by factors like the strength of the incumbent party and the political alignment between ACs and the state government. Notably, electoral cycles are more pronounced when the incumbent’s party wins without a supermajority. Additionally, stubble burning is significantly impacted by the political alignment between local leaders (elected MLAs at the AC level) and the state government. The analysis also suggests that other factors – such as high-yield crop varieties, poverty levels, and the proportion of the Scheduled Tribe population – play a critical role in shaping these environmental outcomes throughout the electoral cycle.
Our work contributes to the political economy literature on environmental degradation, positioned within the broader framework of factors influencing environmental outcomes. National conservation policies, such as the blacklisting of administrative units to curb deforestation in Brazil (Cisneros et al., Reference Cisneros, Zhou and Börner2015, Assunção and Rocha, Reference Assunção and Rocha2019), have proven effective (Wuepper et al., Reference Wuepper, Crowther, Lauber, Routh, Clec’h, Garrett and Börner2024). However, other determinants also play a crucial role. For instance, decentralization through government fragmentation, exemplified by the creation of new administrative units, has been linked to both increased (Burgess et al., Reference Burgess, Hansen, Olken, Potapov and Sieber2012) and temporarily reduced deforestation (Cisneros et al., Reference Cisneros, Kis-Katos and Reiners2023) in Indonesia. Additionally, public discourse whether driven by public attention (Araujo et al., Reference Araujo, Costa and Garg2024) or government rhetoric (Magalhães de Oliveira et al., Reference Magalhães de Oliveira, Sellare, Cisneros and Börner2023) has been identified as a significant factor shaping deforestation patterns.
Our study closely aligns with research investigating local election incentives and other embedded economic factors that influence environmental outcomes over electoral cycles (Pailler, Reference Pailler2018, Balboni et al., Reference Balboni, Burgess, Heil, Old and Olken2021, Cisneros et al., Reference Cisneros, Kis-Katos and Nuryartono2021).Footnote 4 However, this paper expands the scope of environmental outcomes traditionally examined in this literature (primarily deforestation) to include new, contextually significant issues for India, such as crop burning. This is one of the first studies on India to examine political cycles across multiple environmental outcomes including stubble burning, tree cover, slash-and-burn activities, and forest fires yielding consistent results across all these measures. Moreover, unlike prior studies (Baskaran et al., Reference Baskaran, Min and Uppal2015), this research focuses on a more recent period (2008–2019), following the delimitation exercise that finalized AC boundaries. It also analyses environmental outcomes at a more granular level, specifically the AC level, rather than the state level (Khemani, Reference Khemani2004) or district level (Cole, Reference Cole2009). Finally, this study underscores the role of political mechanisms, such as incumbent strength, in shaping the trajectory of environmental outcomes.
This study is organized into six sections. Section 2 outlines the institutional background, while section 3 details the datasets used in the analysis. Section 4 presents the empirical model. Section 5 discusses the main empirical results, explores possible mechanisms, examines heterogeneous effects, and includes several robustness checks. Finally, section 6 concludes the study.
2. Background
2.1. Institutional background
India’s state-level governance is primarily structured around State Legislative Assemblies. These assemblies are composed of representatives, known as MLAs, who are elected through state elections from defined ACs to represent their respective electorates. Elections are held every five years using a first-past-the-post system. The party or coalition that secures a majority of seats in the assembly forms the state government. The size of each legislative assembly, i.e., the total number of ACs, varies across states based on factors such as population and geographical area.Footnote 5
Assembly Constituencies play a vital role in shaping local politics, resource distribution, and policy implementation. Each AC is represented by a single MLA, who wields considerable influence over local governance, resource allocation, and constituency development. These elected representatives serve as crucial intermediaries between the local population and the state government, articulating their constituents’ concerns within the legislative assembly. However, the role of MLAs extends beyond political representation; they are instrumental in directing state resources, executing state-level policies, and overseeing constituency-specific development initiatives. The MLAs do not possess independent legislative powers but are key players in determining how state policies are adapted and enforced at the local level.
In India, the division of responsibilities between the Center and the States is defined by the Constitution through three distinct lists: the Union List, the State List, and the Concurrent List. Subjects under the Union List fall exclusively under central jurisdiction, such as defense, foreign affairs, and atomic energy, while the State List covers areas such as police, public health, and local governance. The Concurrent List includes subjects like environment, education, marriage, and criminal law, where both the Center and States can legislate, but central laws take precedence in case of a conflict. Agriculture is predominantly a state subject, with states having the power to legislate on matters such as crop production, land use, and local agricultural practices. The environment, categorized under the Concurrent List, allows both Central and State governments to legislate on issues related to forests, wildlife, and environmental protection. While states manage local environmental issues and forest resources, the central government sets broader environmental policies, ensuring a unified framework for sustainable development.
The role of MLAs in influencing agricultural activities and environmental outcomes is significant. MLAs, by virtue of their position, have substantial control over agricultural subsidies, crop insurance schemes, and the distribution of inputs like seeds and fertilizers. Additionally, MLAs can impact land-use decisions, forest management, and environmental policy enforcement, making them key players in shaping local agricultural and environmental landscapes.
Monitoring and enforcement at the AC level in India are carried out by a combination of local administrative officers, regulatory agencies, and law enforcement bodies. Key figures include District Collectors, Sub-Divisional Magistrates, and Block Development Officers, who are responsible for enforcing land-use, agricultural, and environmental policies. Forest and environmental officers, such as Divisional Forest Officers and State Pollution Control Board officers, oversee compliance in forested and ecologically sensitive areas, while local police assist in maintaining law and order. Panchayati Raj Institutions, comprising village, block, and district councils, also play an essential role in managing local resources and monitoring compliance, often serving as intermediaries between communities and state officials. MLAs are pivotal to this enforcement framework as they use their political authority to shape the implementation of policies and prioritize issues within their constituencies. Their involvement is crucial for determining resource allocation, influencing local administrative decisions, and ensuring the effective execution of state-level policies.
2.2. Timing of state elections
State elections in India are held every five years, with the first set of elections conducted in 1951 for all existing states at the time. The subsequent varying election timings and cycles across Indian states are largely due to factors that are external but partially influenced by historical and political developments. These factors include the timing of the first elections in newly formed or reorganized states, dissolution of state assemblies due to political crises (early elections also called midterm elections), imposition of President’s Rule, and court rulings. For instance, the state of Chhattisgarh was carved out of Madhya Pradesh in 2000, held its first elections in 2003, and subsequently followed a consistent five-year cycle with elections in 2008, 2013, and 2018. Similarly, the state of Jharkhand was carved out of Bihar in 2000 and held its first state elections in 2005. However, due to political instability and the imposition of President’s Rule, the subsequent elections were held early in 2009, creating a unique election cycle distinct from Bihar, which adheres to a different timeline.
Additionally, logistical considerations such as the availability of security forces and administrative readiness as determined by the Election Commission also contribute to staggered elections across states. While certain factors, like early dissolution of assemblies, are political, the overall timing is primarily shaped by constitutional mandates and external events beyond the control of any single political entity. During the study period (2008–2019), which began with the delimitation exercise that redefined AC boundaries, states entered the analysis sample as their first elections were held post-delimitation. Since the first elections (for each state) following the delimitation exercise, the period has been characterized by relative political stability (i.e., no midterm elections) across all 28 states in the sample (see table 1).
State election years

Notes: A total of 71 elections took place between 2008 and 2019 in 28 major states, covering approximately 3800 ACs in India. The scheduled elections in Jammu and Kashmir that were supposed to be held in 2013 were delayed until 2014 due to factors like security concerns and administrative reasons.
3. Data
This study uses data on pre-determined election timings from the Election Commission of India and supplemented it with data from Agarwal et al. Reference Agarwal, Agrawal, Bhogale, Hangal, Jensenius, Kumar, Narayan, Nissa, Trivedi and Verniers(2021) on each AC’s winning margins and party affiliation.Footnote 6 The boundaries of ACs are determined by the Indian Delimitation Commission based on census information.Footnote 7 The most recent delimitation exercise was completed in 2008; it finalized new AC boundaries.Footnote 8 Consequently, the analysis includes all 71 state elections held between 2008 and 2019 (pre-COVID-19). The new boundaries became effective from the first state assembly elections held after the delimitation orders were officially published. During the study period, elections were held in 29 states and 2 Union Territories (Delhi and Puducherry). The focus is on 28 major states, excluding Union Territories and the newly formed state of Telangana, which has had a shorter four-year election cycle since its inception in 2014. The sample comprises approximately 3800 ACs, which serve as the primary units of analysis.
Next, election information was combined with environmental outcomes’ remote sensing data to create an AC-year level panel dataset, capturing environmental degradation through multiple outcomes. The first set of outcomes focused on biomass burning activities, including crop, forest, and slash and burn fires. The first outcome variable, crop fires, refers to intentional crop residue burning; these are the fire events that occur in croplands. Sixty percent of land in India is under agricultural production and over the past few decades Indian agriculture has been marked with expansion of irrigation facilities, adoption of high yield variety seeds, labour exits and increased mechanization (such as use of the combine harvester). A combination of these factors led to adoption of multi-cropping system by farmers which leaves little time in between the harvest of one crop and the sowing of another. In this scenario, crop residue burning thus emerged as the quickest and cheapest way to get the farm ready for the next crop. Although legal bans have been put in place to curb crop residue burning (Bhuvaneshwari et al., Reference Bhuvaneshwari, Hettiarachchi and Meegoda2019), on the ground they have little impact. Additionally, stubble burning is regularly highlighted as a cause for seasonal deterioration in air quality (Kaskaoutis et al., Reference Kaskaoutis, Kumar, Sharma, Singh, Kharol, Sharma, Singh, Singh, Singh and Singh2014, Bikkina et al., Reference Bikkina, Andersson, Kirillova, Holmstrand, Tiwari, Srivastava, Bisht and Gustafsson2019, Sahu et al., Reference Sahu, Mangaraj, Beig, Samal, Pradhan, Dash and Tyagi2021).
Around a quarter of the total population (350–400 million people as of year 2009) living in India rely partly or fully on forests for their livelihoods (MoEF, 2009, Schmerbeck and Kraus, Reference Schmerbeck, Kraus, JF and D2015). Greater reliance on forests puts forest property at risk due to potential resource over exploitation. Additionally, close to 41 per cent of forests in India are degraded which is a source of dry raw material for wildfires (MoEF, 2009, Srivastava and Garg, Reference Srivastava and Garg2013). The Ministry of Environment, Forest and Climate Change is the central body responsible for making laws and formulating policies related to forests in India, however the state government is responsible for implementation of these laws and monitoring of various policies. The analysis focuses on forest fires, which can be either unintentional (spontaneous combustion of dry vegetation during peak summers) or intentional (burned to clear land for agricultural production), and refers to fire incidents in forestland. Finally, an outcome measuring slash-and-burn activities is also assessed (similar to the outcome variable considered in Balboni et al. Reference Balboni, Burgess, Heil, Old and Olken(2021)). This aims to capture fire events occurring in previously deforested land that is burned consistently over two years. This activity is primarily concentrated in Northeastern Indian states. The data on various kinds of fire activities is obtained from NASA’s Fire Information for Resource Management System (FIRMS), a geocoded dataset that captures real-time active fire locations (i.e., fire pixels) across the globe at 1km*1km resolution.Footnote 9 Fire pixels from the FIRMS dataset are projected onto India’s land mask cover to identify the land type where these fire incidents occur and help us in classifying fires into crop or forest fire category. The fire pixel data are aggregated at the AC level for each year, which serves as the unit of analysis. Specifically, the number of fire pixels occurring within the boundaries of each AC is counted.
Beyond biomass burning measures, forest health is assessed using tree canopy cover statistics. As discussed by Asher et al. Reference Asher, Garg and Novosad(2020), a binary measure of deforestation from the Global Forest Change (GFC) dataset is more appropriate for tracking forest health in countries like Brazil and Indonesia, where deforestation is often substantial. In contrast, India frequently experiences partial forest loss rather than the extensive loss required to be classified as deforested in the GFC dataset. Therefore, the Vegetation Continuous Fields data is utilized (with a 250m resolution), the same dataset recommended by Asher et al. Reference Asher, Garg and Novosad(2020), to obtain a more accurate measurement of forest cover. Each pixel in this dataset provides information on the percentage of pixels which is covered by tree canopy. The tree cover is derived from a machine learning algorithm which classifies tree cover based on the amount of light reaching the ground, i.e., denser forest will have a lesser amount of light reaching the ground due to crown area of the trees and will get assigned a higher tree cover percentage.Footnote 10 For the analysis, all pixels (within an AC boundary) for which canopy cover is greater than 10 per cent are counted.Footnote 11 A change in tree cover can be induced by both deforestation or any other activity which reduces tree crown area (leaf area) like forest fires. Literature in this domain (Coop et al., Reference Parks, Stevens-Rumann, Crausbay, Higuera, Hurteau, Tepley, Whitman, Assal, Collins, Davis, Dobrowski, Falk, Fornwalt, Fulé, Harvey, Kane, Littlefield, Margolis, North, Parisien, Prichard and Rodman2020) suggests that fires have a direct impact on forest dynamics, i.e., they change trees and other vegetation to shrubs.
To summarize, all outcome variables are constructed as total count of pixels lying inside the boundary of an AC for each year. Table 2 provides further details on all outcome and control variables used in the analysis.
Variables description: assembly constituency-year level data compilation

4. Model specification
The empirical estimation relies on a Poisson model to analyze count variables. The following equation is estimated:
 \begin{equation}
\begin{aligned}
E\big[y_{it}\big] & = \gamma_{i} exp \Big(\alpha_{-2} Election_{i,t-2} + \alpha_{-1} Election_{i,t-1} + \alpha_{1} Election_{i,t+1} \\ & \quad + \alpha_{2} Election_{i,t+2} + \delta_{t} + \rho X_{it} \Big),
\end{aligned}
\end{equation}
\begin{equation}
\begin{aligned}
E\big[y_{it}\big] & = \gamma_{i} exp \Big(\alpha_{-2} Election_{i,t-2} + \alpha_{-1} Election_{i,t-1} + \alpha_{1} Election_{i,t+1} \\ & \quad + \alpha_{2} Election_{i,t+2} + \delta_{t} + \rho X_{it} \Big),
\end{aligned}
\end{equation} where yit is the count of outcome variable (total number of pixels for crop fires, forest fires, slash and burn fires or tree cover) in AC i in year t. The concept of electoral cycle is introduced using a set of four dummy variables with the dummy for election year being used as the omitted category. Together, these dummy variables capture a complete five-year election period and represent the AC-year position in the electoral cycle. For example, if a state had elections in 2015, then the observation for an AC belonging to this state in 2014 will have the  $Election_{t-1}$ dummy turned on while all other dummy variables will be turned off. Several studies have employed similar estimation specifications to assess electoral cycles in various domains, such as Cole (Reference Cole2009), Pailler (Reference Pailler2018), Balboni et al. (Reference Balboni, Burgess, Heil, Old and Olken2021), and Bhattacharjee Reference Bhattacharjee(2022). Time-invariant factors, such as geography, are accounted for using AC-level fixed effects (γi)Footnote 12 and capture annual shocks common for all ACs by using year fixed effects (δt). Additional variables are also controlled for (Xit) which can potentially impact outcome variables. These include a proxy for development or income by using nightlights, an agricultural productivity proxy (i.e., net primary productivity, see Zaveri et al. Reference Zaveri, Russ and Damania(2020) for reference), and precipitation. The coefficients of interest are α −2, α −1, α 1 and α 2, which represent the difference in the level of outcome variables in non-election years relative to the base category, i.e., election year.
5. Results
5.1. Main results
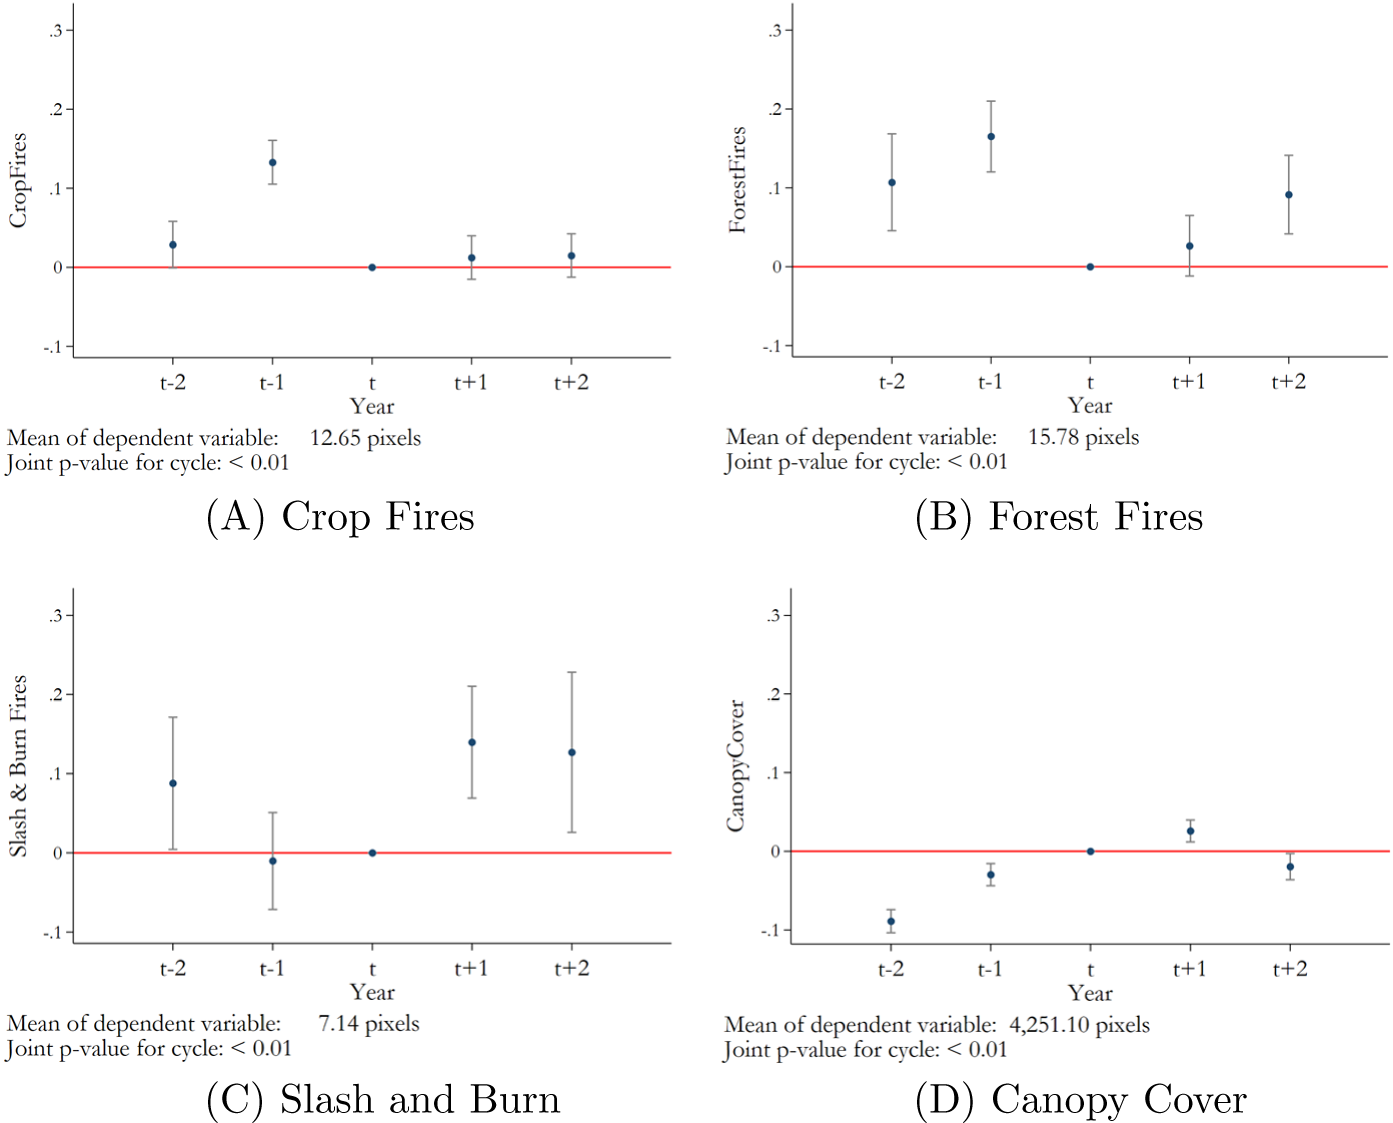
The results are presented graphically in figure 1, where estimates for α −2, α −1, α 1 and α 2 are plotted for each of the four environmental outcomes (coefficients are provided in table 5, columns (1)–(4) as well). For crop fires (figure 1, panel A), the coefficients for all non-election years are positive, signifying higher crop fire levels in non-election years relative to the election year. The crop burning level is dramatically higher by 14 per cent ( $[e^{0.133}-1]*100$) just before the election year. The results for forest fires (in figure 1, panel B) are similar to crop fires, where non-election years observe higher forest fire activity levels (in the range of 9.6–18 per cent, except t+1 year). The effect sizes are relatively small compared to the Indonesian study (Balboni et al., Reference Balboni, Burgess, Heil, Old and Olken2021), which found that forest fire ignitions rise by 57 per cent in the post-election year versus the election year. Slash and burn activity, which combines the concept of deforestation and forest fires and is mostly concentrated in northeastern Indian states (see figure 1 notes), witnesses a 9.2–15 per cent increase in levels during non-election years (except t-1 year) compared to an election year (figure 1, panel C). This pattern suggests that elected leaders allow more resource extraction in non-election years but possibly invest more in fire management and suppression strategies during elections. Next, the analysis focuses on forests by examining canopy cover (i.e., count of pixels in an AC with > 10 per cent canopy cover). The results in figure 1, panel D reveal that canopy cover is lower during most non-election years by 2–9.3 per cent compared to election years.Footnote 13 Lastly, the results for the presence of any electoral cycle are reported by testing for the joint significance of all election dummies against the null hypothesis of no electoral cycle. For all outcomes, the null hypothesis of no electoral cycle is rejected (p-value < 0.01). Overall, it is observed that for all environmental outcomes (except slash-and-burn), the estimates are stronger and larger for pre-election years – those leading up to elections – supporting Nordhaus’s (Reference Nordhaus1975) theory that imperfectly informed voters tend to place greater weight on politicians’ recent past performance when making decisions, particularly in the years immediately preceding elections.
Electoral cycles and environmental outcomes.

5.2. Role of incumbent strength and political alignment
Elected members of parliament can influence the strictness of enforcement or advocate for relaxed regulations depending on local needs or political considerations. In this context, incumbents may behave differently depending on whether their party holds a supermajority (more than two-thirds of the seats in the local state parliament) or not. The absence of a supermajority weakens the ruling party’s political control, creating an incentive for elected politicians to tolerate more illegal activities as a strategy to secure political backing and consolidate their influence. Such activities often serve as “political currency” to maintain local support and prevent opposition leaders from gaining traction.
Numerous studies (Van der Ploeg, Reference Van der Ploeg2018, Balboni et al., Reference Balboni, Berman, Burgess and Olken2023) have emphasized that incumbents facing a significant threat of losing power tend to engage in extensive resource extraction. This concept has been further explored in political economy studies focusing on India (Baskaran et al., Reference Baskaran, Min and Uppal2015, Dar et al., Reference Dar, Gupta and Verma2018). The present study builds on this framework by linking its findings to the role of incumbent strength in shaping environmental outcomes. Specifically, a variable called Low Incumbent Strength is defined, which takes the value of 1 when incumbents win without a supermajority (i.e., less than two-thirds of the seats at the state level)Footnote 14 and 0 otherwise. This variable is then interacted with electoral cycle dummies to explore how low-strength incumbents behave throughout the electoral cycle. For simplicity, pre-election dummies –  $Election_{t-1}$ and $Election_{t-2}$ – are combined into a single variable labeled $Pre Election$ (similarly for post-election dummies).
Table 3 (panel A) presents these results. It is found that ACs with incumbents who won with low strength (i.e., without a supermajority) experience significantly higher levels of stubble burning, showing an additional increase of approximately 1 per centFootnote 15 during the post-election period. Furthermore, these constituencies see an additional increase in forest fires by 2.5 per cent and a reduction in forest cover by 0.7 per cent.Footnote 16
Role of incumbent strength and political alignment

Notes: Standard errors in parentheses are clustered by AC. Regression includes other controls for nightlights, total rainfall and net primary productivity. Fixed effects Poisson regression drops those ACs from estimation for which the dependent variable takes value 0 for all years, i.e., no variation is observed in the analysis period. The number of ACs in the estimation sample is 3032 for crop fires, 2229 for forest fires, 948 for slash and burn fires and 3863 for canopy cover.
Next, the analysis tests whether the level of these environmentally harmful activities disproportionately changes in non-election years when an AC is politically aligned with the state government (same party rules an AC and the state government with potentially less chances of a crackdown due to aligned interests). No such effects are present for almost all outcome variables, except for crop fires (table 3, panel B). During pre-election years, ACs on average witness 5.86 per cent higher crop fire levels, which further increases to 9.01 per cent when ACs are aligned with the state government.
5.3. Heterogeneity analysis
In this section, the heterogeneity of the results is explored by focusing on specific characteristics that influence the environmental outcomes of interest. For instance, the use of high-yield crop varieties in agriculture (as discussed in section 3) is associated with increased crop burning activity. This is due to the fact that high-yield varieties for rice produce a larger volume of crop residue (rice straw), which is frequently burned to expedite field preparation for the next planting cycle (Huang et al., Reference Huang, Ma, Song, Ling, Macdonald, Gao, Tao, Shen, Zhao, Liu, Tian, Li, Jia, Lian and Mao2022). To conduct this analysis, district-level rice yield data from before the start of the analysis period (2007–08) is utilized, as reported by the Directorate of Economics and Statistics, Department of Agriculture and Cooperation, Ministry of Agriculture, Government of India.Footnote 17 Based on the distribution of rice yields at the district level, a variable ( $High Rice Yield$) is constructed to identify districts in the top quintile of the yield distribution. This variable is then interacted with pre-election and post-election indicators to assess whether crop-burning activity varied between ACs in high- and low-yield districts across the electoral cycle. The findings (in table 4, column (1)) suggest that districts with high rice yields experience a higher incidence of crop burning during non-election years, supporting the hypothesis that political actors may tolerate illegal activities, such as crop burning, outside election periods to maintain the satisfaction of their agriculturally reliant constituencies. This result is similar in spirit to the results in Cisneros and Kis-Katos Reference Cisneros and Kis-Katos(2024) who find that high dependency on farming interacts with embedded political incentives and leads to greater environmental degradation.
Heterogeneity analysis

Notes: Standard errors in parentheses are clustered by AC. Additional controls include nightlights, precipitation and net primary productivity. Rice yield data has been sourced from Directorate of Economics and Statistics Department of Agriculture and Farmers Welfare for year 2007–08 (just before the start of the analysis period spanning 2008–2019). Caste background data, i.e., proportion of scheduled tribe population data, has been constructed at the district level using 2001 census of India (574 districts matched to the estimation analysis. Source of data: Socioeconomic High-resolution Rural-Urban Geographic Platform for India (SHRUG)). “High” refers to the top quintile in the distribution of rice yield or ST population proportion (at the district level). “Low Development” variable has been constructed using nightlights for the year 2008, the bottom-most quintile in the distribution of nightlights (at AC level) has been tagged as low development.
The next heterogeneity analysis examines fires occurring in forested areas. An in-depth report on the causes and patterns of forest fires in India (Dogra et al., Reference Dogra, Mitchell, Narain, Sall, Smith and Suresh2018), which draws on interviews with forest officers, found that over 75 per cent of forest fires within their jurisdiction are human-induced. Local communities utilize fire for various purposes, such as promoting the growth of new grass or tendu leaves, facilitating the collection of honey, sal seeds, mahua, and chiraunji, and preparing land for shifting cultivation. The report also highlighted a connection between poverty and the occurrence of forest fires.
To further explore this relationship, levels of development are examined using nightlight intensity as a proxy, which is inversely related to poverty (Chen, Reference Chen2015). Specifically, the distribution of nightlights for ACs in 2008, the initial year of the study, is used to create a variable ( $Low Development$) that identifies constituencies in the bottom quintile of the distribution.Footnote 18 This variable is interacted with pre-election and post-election indicators, and the findings are presented in columns (2) and (3) of table 4. The hypothesis is that environmentally harmful activities are more prevalent in less developed areas (where people are more reliant on forest resources) during non-election years. The results confirm this expectation, showing that forest fires are 16 per cent higher in less developed areas during post-election years, while the coefficient for pre-election years is insignificant. Although the estimates for slash-and-burn activity are also positive, they are not statistically significant. This may be because slash-and-burn activity is primarily concentrated in the northeastern region of India, leading to insufficient data variation to fully capture the effect of low development.
Lastly, forest cover is examined in relation to the caste composition of the population, with a specific focus on Scheduled Tribes (STs).Footnote 19 STs hold a unique connection to forests and play a crucial role in their protection and conservation. As indigenous communities traditionally reliant on forests for their livelihoods, they possess deep-rooted ties to the natural environment. Their traditional knowledge and practices have contributed to the sustainable management of forest ecosystems for generations.Footnote 20
In this context, the hypothesis is that areas with a higher proportion of the ST population will experience less degradation and tree cover loss compared to areas with a lower proportion of the ST population. In table 4, column (4), this hypothesis is tested by interacting pre- and post-election dummies with an indicator for a high ST population proportion.Footnote 21 The findings support the hypothesis, showing that areas with a higher proportion of the ST population maintain greater tree cover in both pre- and post-election periods compared to areas with a low ST population proportion.
5.4. Robustness checks
A series of tests were performed to assess the robustness of the results, described in greater detail below:
(1) First, existing pre-trends in the environmental outcomes studied can be a real concern, as they influence the evolution of these outcomes over time. To account for this, a subsequent analysis was performed that incorporated state-level trends, and the results remain unchanged (see online appendix, figure A1).
(2) Inverse hyperbolic sine transformation (Bellemare and Wichman, Reference Bellemare and Wichman2020) was also performed, which provides an alternative method for measuring the outcome variables used to model extreme values or zero values. The results were found to be robust to this transformation.Footnote 22
(3) Spillover effects are a concern as fires can spread from one area to another, which might imply presence of spatially correlated errors. To address this concern, two additional analyses have been conducted:
(a) Spatial correlation of errors is accounted for by employing Conley’s standard errors. The results are presented in table 5. Columns (1)–(4) show the original results, while columns (5)–(8) display the results with spatially clustered errors. While some estimates lose statistical significance, many of the key estimates across the four outcome variables retain their significance. For instance, crop fires are more prevalent in the year preceding an election, and forest fires increase during pre-election periods. Slash-and-burn activity, concentrated largely in the northeastern states, tends to rise just after elections; however, due to the relatively smaller number of observations and spatial clustering, the estimates may contain more noise, rendering them insignificant. Finally, forest cover tends to decrease during pre-election years, with a slight but statistically insignificant increase observed in the post-election period. Overall, even with spatially clustered errors, the results convey a consistent narrative: environmental degradation tends to be greater during non-election years, particularly in the pre-election period, compared to election years.
Table 5.Spatial clustering

Notes: In columns (1)–(4), standard errors in parentheses are clustered by AC. In columns (5)–(8), standard errors are spatially clustered. Regression includes other controls for nightlights, total rainfall and net primary productivity. Fixed effects Poisson regression drops those ACs from estimation for which the dependent variable takes value 0 for all years, i.e., no variation is observed in the analysis period.
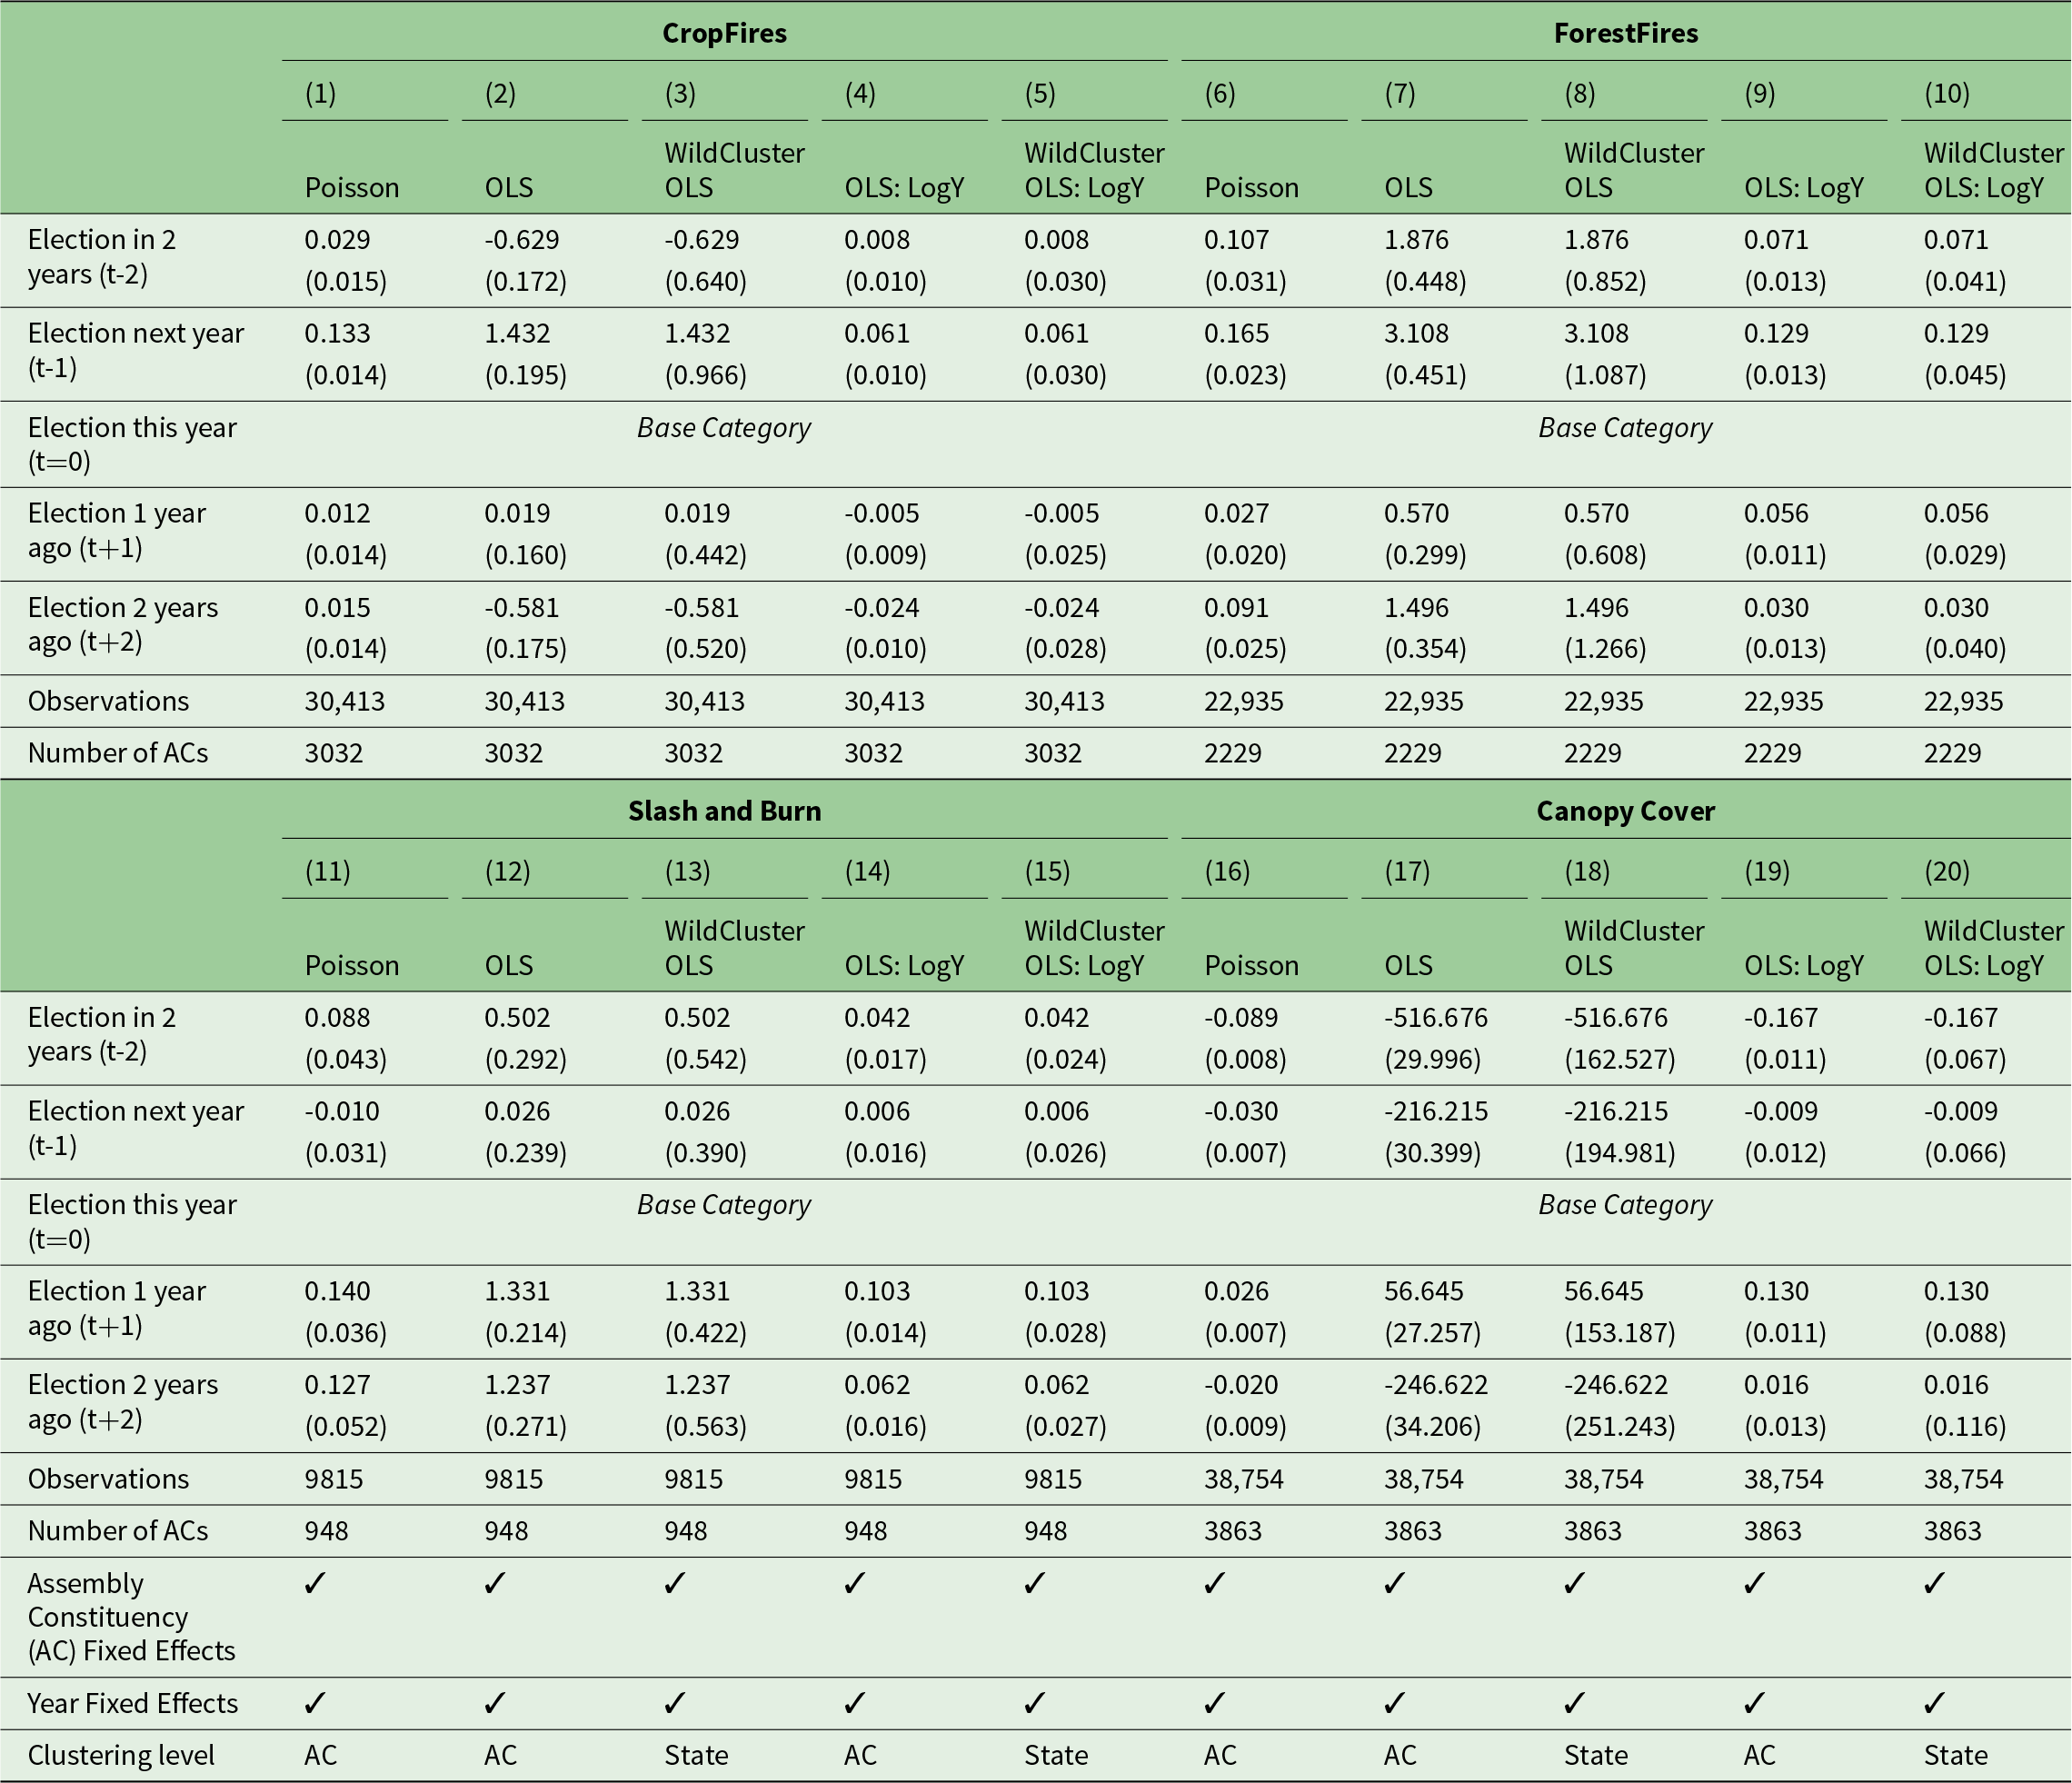
An alternative analysis is conducted in which standard errors are clustered at the state level instead of the AC level. This approach allows for correlation of errors over a larger geographic area (i.e., across ACs), while states are treated as being independent of one another in the error structure. The results of this analysis are presented in table 6. Clustering at the state level, however, poses challenges due to the small number of clusters (i.e., fewer than 30). In such cases, traditional cluster-robust standard errors may be unreliable, and Wild cluster bootstrapping provides a more accurate method for inference. Unfortunately, Wild cluster bootstrapping is not applicable for non-linear models, such as the Poisson models used in the analysis for modeling the dependent variable, which is a count variable. As a result, linear models are used.Footnote 23
Table 6.Clustering at state level
Notes: Standard errors in parentheses are clustered by AC or State level. Additional controls include state level trends, nightlights, precipitation and net primary productivity.
Table 6 presents the results for various outcome variables. For each outcome, the first column replicates the original results from the Poisson model, while the second column provides results using an OLS model with the original clustering at the AC level. The third column presents OLS results with Wild-cluster bootstrapping, accounting for the small number of clusters at the state level in the sample. The fourth column shows results from an alternative OLS model where the dependent variable is the logarithm of Y, with clustering at the AC level. Finally, the fifth column displays results for the logarithm of Y with Wild-cluster bootstrapping at the state level. The results obtained with Wild-cluster bootstrapping (3rd and 5th column for each outcome variable) show patterns similar to those found with spatial clustering. Specifically, crop fires are more prevalent in the year preceding an election, and forest fires increase during pre-election periods. Slash-and-burn activity, concentrated primarily in the northeastern states, tends to rise just after elections. Additionally, forest cover decreases during pre-election years, with a slight but statistically insignificant increase in the post-election period.
Overall, even when clustering is performed at a broader level (i.e., state), the results support a consistent narrative: environmental degradation is more pronounced during non-election years, particularly in the pre-election period, compared to election years.
(4) The sensitivity of the results to different choices of base category in the analysis was also evaluated. In online appendix table A1, we present an alternative specification that focuses on election years, with non-election years serving as the base (i.e., omitted category). The results indicate that election years are associated with lower levels of environmental degradation, or conversely, that non-election years exhibit higher levels of environmental degradation. This analysis reinforces our original findings by demonstrating that the results are not driven by the choice of a specific base category. It also underscores the main takeaway: non-election years are marked by higher levels of resource extraction and environmental degradation.Footnote 24
(5) Alternative measures (or definitions) for capturing the outcome variables were also employed to test the robustness of the results against these different way of measurements. In table 7, columns (1)–(3), a stricter definition for fire events was employed; only high-quality fire events with confidence values (a measure of the quality of observation taken by a satellite) are considered, i.e., those fires with greater than 70 per cent confidence level were counted. The results largely remained unchanged. For canopy cover, a stricter definition was applied by selecting a higher threshold (more than 20 per cent of the pixel must be under canopy cover) for counting tree cover pixels. Although the estimates reduced in magnitude due to a lower number of pixels satisfying this criterion, overall they reflected a similar pattern to the original results.
Table 7.Robustness checks
Notes: Standard errors in parentheses are clustered by AC. Fixed effects Poisson regression drops those ACs from estimation for which the dependent variable takes value 0 for all years, i.e., no variation is observed in dependent variable in the analysis period.
Additional analysis was also conducted using the proportion of an AC covered by forest as the dependent variable instead of counting pixels (with canopy cover exceeding 10 per cent) to capture the extent of tree cover within an AC. The results are presented in online appendix table A2. Columns (1) and (3) reproduce the original results under different model specifications: column (1) represents the 5-year electoral cycle with four yearly dummy variables, while column (3) combines pre- and post-election dummy variables into single dummy variables. In these columns, the dependent variable is the count of forest pixels within an AC (with canopy cover exceeding 10 per cent). Columns (2) and (4) present results for similar specifications, but the dependent variable is the proportion of an AC covered by forest. Both sets of results – those using the original dependent variable and those using the proportion – exhibit a similar pattern: pre-election years overall show a decline in forest cover (column (4)), while post-election years demonstrate a small but positive increase in forest cover.


6. Conclusion
This study highlights how electoral cycles influence environmental outcomes in India, showing that harmful practices such as crop fires, forest fires, slash-and-burn agriculture, and reduced tree cover are more prevalent in non-election years (especially pre-election years which lead up to an election). The findings indicate that political incentives can prompt leaders to permit environmentally damaging activities to secure the support of resource-dependent communities, especially in areas where the incumbent’s political party’s strength is weak. Additionally, stubble burning appears to be shaped by the political alignment between local leaders and the state government, highlighting how local and state-level political dynamics affect environmental policy enforcement. Socio-economic factors, including high-yield crop adoption, poverty levels, and the proportion of ST populations, also play a crucial role in moderating these outcomes. This study underscores the importance of considering local political contexts when formulating environmental policies, as electoral strategies can often overshadow long-term sustainability goals.
Supplementary material
The supplementary material for this article can be found at https://doi.org/10.1017/S1355770X25000221.
Acknowledgements
I am grateful to Dr. Soham Sahoo for his valuable support throughout the process of developing this work. I would also like to thank the Editor and Associate Editor for their valuable support and insightful comments on the paper.
Competing interests
The author declares none.


 Open access