


Introduction
Short-time work (STW) schemes in the European Union (EU) helped to maintain many employment relationships that, without this type of public aid programme, would have been lost in the complicated moments of the economic crisis caused by the COVID pandemic. Although these schemes had advantages for all countries that opted for this type of practice, those that usually have higher unemployment rates, such as Spain, benefited more from the application of these measures.
STW schemes in Spain, called temporary labour adjustment plans (TLAPs) (Expedientes de Regulación Temporal de Empleo), have played a relevant role in modifying the labour market. Traditionally, the labour markets in many European countries – and Spain here is a clear example – have adapted to economic crises by terminating labour contracts, using dismissal as the main method of adjustment. The TLAP scheme means that this process is slower in Spain, which has made it possible to prevent the effects of a crisis being transmitted to workers with permanent contracts. The effect of STW on temporary contracts in Spain, however, has not been as positive, despite them being included in the TLAP scheme since 2020. Considering the results in Spain and taking into account the experience in other countries, the aim of this article is to carry out a policy watch analysis and provide a set of recommendations to improve the functioning of STW in Spain.Footnote 1
To carry out this exercise, an analysis will be made of the main results at the European level, but the aim will always be to focus on the Spanish case as the fundamental axis of this research.
The structure of this paper reflects a very similar scheme to that of other research (Boeri & Bruecker, Reference Boeri and Bruecker2011; Casey & Mayhew, Reference Casey and Mayhew2023; Elia & Becker, Reference Elia and Bekker2023), which takes a more general perspective first, before focusing on the Spanish case. Therefore, this article is structured as follows: the second section examines STW models for some EU countries. This is followed by the results of empirical work for these countries and then a discussion of the benefits and costs of STW in the EU. The fifth section focuses the study on the Spanish case after which, based on the European evidence, recommendations are formulated on the functioning of STW in Spain, with a view to improving its performance; these recommendations can also be applied to other countries. Finally, conclusions are drawn.
Models of short-time work schemes in the EU
STW schemes can be defined as programmes of a public nature that allow companies facing some kind of economic problem to opt for a reduction in their workers’ working hours by guaranteeing financial assistance from the state for the time not worked. Therefore, the aim of STW is to encourage companies facing an adverse situation to adjust their workforce by reducing the number of hours worked as opposed to laying off workers (Boeri & Bruecker Reference Boeri and Bruecker2011).
STW was used in all European countries during the COVID pandemic, albeit with varying intensity, and significantly curbed the negative effects of the pandemic on employment: (see Giupponi et al (Reference Giupponi, Landais and Lapeyre2022) for several countries; Brey and Hertweck (Reference Brey and Hertweck2020) for European countries; Kopp and Siegenthaler (Reference Kopp and Siegenthaler2021) for Switzerland; Izquierdo et al (Reference Izquierdo, Puente and Regil2021, Reference Izquierdo, Puente and Auciello2022), García-Serrano (Reference García-Serrano2022), Díaz et al (Reference Diaz, Dolado, Jañez and Wellschimied2023), García-Clemente et al (Reference Garcia-Clemente, Rubino and Congregado2023), Osuna and García-Pérez (Reference Osuna and García Pérez2022), and Carrasco et al (Reference Carrasco, Hernanz and Jimeno2024) for Spain; Bellmann et al (Reference Bellmann, Bellmann and Hübler2023) for Germany; Meriküll and Paulus (Reference Meriküll and Paulus2023) for Estonia; and Bělín and Veselkova (Reference Bělín and Veselkova2024) for Slovakia.Footnote 2 However, the implementation of STW can have negative effects (see Giupponi et al (Reference Giupponi, Landais and Lapeyre2022) for Italy, Díaz et al (Reference Diaz, Dolado, Jañez and Wellschimied2023) for Spain, and Bellmann et al (Reference Bellmann, Bellmann and Hübler2023) for Germany).
The following is a description of the most relevant elements of the STW schemes in a number of European countries. The choice of this set of countries is based on the list of studies used in the following section of this article, which focuses on the impact of STW in the EU.
Austria (Kurzarbeitsbeihilfe). In order to be eligible for STW-COVID, it was necessary for a company to justify its economic need and apply for financial support from the Public Employment Service. The STW-COVID did not cover workers with a mini-job or public employees.
Before the pandemic, Kurzarbeitsbeihilfe guaranteed 55% of the net salary, including social security contributions, for hours not worked. During the pandemic, the STW-COVID replacement rate was between 70% and 90% of the net salary, although workers with an apprenticeship contract were guaranteed 100% (Tamesberger & Moser Reference Tamesberger, Moser, Drahokoupil and Müller2021; Tamesberger & Theurl Reference Tamesberger and Theurl2021).Footnote 3 The cost of the programme was fully covered by the state. The maximum duration of the programme was 17 months (it ended on 31 December 2021), and the employer bore the labour cost corresponding to the hours actually worked. In addition, STW-COVID established the need for workers to undertake training activities offered by their employers, although employers were not obliged to offer such training. Finally, although it was not necessary to have trade unions involved in the design and implementation of STW-COVID, a certain degree of negotiation was sought in the measures to be applied.
In addition, since 1 June 2022, the Kurzarbeitsbeihilfe has been available in two ways.Footnote 4 The first has a high level of funding and is aimed at companies that have been hit hard by the pandemic. The second, applicable to all other companies, is a less generous model. During the implementation of the Kurzarbeitsbeihilfe, the unemployment rate did not exceed 6.2% (in 2021) compared to 4.5% in 2019, while the decline in GDP from 2019 to 2020 was 6.6% (€16,258 million). Moreover, as in the German case, Austria did not request financial support from the European Commission for the implementation of the programme.
Estonia (Töötasu hüvitis – Wage subsidy). To be eligible for STW-COVID, at least two of the following three requirements had to be met: a decrease in turnover or income of 30% or more; not being able to guarantee work for at least 30% of the employees on the payroll; and having to reduce the wages of at least 30% of the workers by at least 30%. During the pandemic, no groups were excluded from the programme, with a replacement rate of between 50% and 70% of the total workforce previous average gross monthly wage but limited to €1,000 per month and with a minimum of €584 per month. The aid was paid in full by the state, for a maximum duration of 14 months. In addition, the employer’s contributions of €150 or more were paid by the public unemployment protection system. The need for training courses was not envisaged, and collective bargaining played virtually no role in the design and implementation of the STW-COVID scheme. The maximum number of beneficiary workers was more than 120,000, and the number of companies covered by the system reached 16,000 (Kallaste Reference Kallaste, Drahokoupil and Müller2021). The unemployment rate rose from 4.4% in 2019 to 6.9% in 2020, while GDP registered a decline of 1.0% (€521 million).
France (Chômage partiel). The French government has a partial unemployment scheme, known as the chômage partiel or STW scheme (European Trade Union Confederation 2020). Because of the effects of the pandemic, the scope of application was extended to almost all categories of employees, although the self-employed continued to be excluded. The STW-COVID replacement rate was 80% (100% for apprentices); from 1 April 2021 it was reduced to 60%.Footnote 5. As a result of the pandemic, the initial duration of six months (Vicent Reference Vicent, Drahokoupil and Müller2021) was extended, with the programme ending on 31 December 2022 (maximum duration 21 months). The compensation payment was 100% and was paid by the state. Companies were allowed to offer training and, if training was offered, the workers benefiting from the programme were obliged to undertake it. Finally, although it was not compulsory to have the trade unions’ agreement to the STW-COVID scheme, an important part of the content of the programme was negotiated with them.
The number of beneficiaries in the labour market at the height of the pandemic crisis reached 8.6 million (Müller & Schulten Reference Müller and Schulten2020), and the unemployment rate did not exceed 8% during the pandemic, which was a similar figure to that obtained in 2019. The decline in GDP from 2019 to 2020 was 10.4% (€109,272 million).
Germany (Kurzarbeit). The Kurzarbeit is the workers’ compensation system that operates in Germany as an STW scheme. This German programme is designed to provide aid for overcoming particular crises. The regulation covering the Kurzarbeit dates back to 1927Footnote 6 and is one of the oldest in the world, although it has undergone several modifications since 1927 (Brecht-Heitzmann Reference Brecht-Heitzman2019; European Trade Union Confederation 2020; International Monetary Fund 2020a). Its main objectives are to mitigate job destruction and to prevent companies from losing qualified personnel. The Federal Employment Agency (Bundesagentur für Arbeit) pays an amount up to 66% of each employee’s salary in order to avoid mass lay-offs in times of severe economic crisis (Müller Reference Müller, Drahokoupil and Müller2021; Müller & Schulten Reference Müller and Schulten2020). The preconditions are that the employer has experienced economic difficulties and can prove a drop in production, irrespective of previous profits. Before the pandemic, it was necessary that the temporary reduction in employment had affected one-third of the workforce, but because of the pandemic this requirement was reduced to 10%.Footnote 7 In addition, during the time of the health emergency, some groups that were initially excluded were also included as beneficiaries – for example, the self-employed and those with a mini-job.Footnote 8
STW-COVID had an initial maximum duration of 12 months, and this was then extended to 21 months, ending on 31 December 2021. The programme was 100% state funded. On 23 April 2020, the German executive branch approved a reform that increased the amount of the benefit according to its duration.Footnote 9 In addition, social contributions, which until the reform had been paid by the employer were paid by the Federal Employment Agency. An attempt was made to encourage the beneficiaries of STW-COVID to take up placements in training programmes by requiring the company to pay part of the employee’s social security contributions if the company did not offer training. The role of trade unions was also relevant in the design and implementation of the programme.
The number of STW beneficiaries reached its maximum of 5.4 million in June 2020. During the implementation of the Kurzarbeit, the number of people unemployed in Germany did not exceed 3 million, which meant that the unemployment rate did not rise above 5.9% during the worst months of the pandemic in 2020, while the unemployment rate had been 5.0% in 2019. Between these two years, a decline of 3.8% in GDP was registered.Footnote 10 Moreover, the financing of this measure did not depend on EU aid, as Germany did not make use of the financial support approved by the European Commission for maintaining employment.
Italy (Cassa integrazione guadagni straordinaria). The Cassa integrazione guadagni straordinaria was the name given to the STW in Italy (European Trade Union Confederation 2020). The scheme was intended for those companies which, for reasons arising from COVID, had to require the suspension or reduction of working hours, and this made it possible for companies to take advantage of these measures without having to agree the reductions with the trade union representatives.
The amount received by workers in this situation reached 80% of their previous gross salary, with a maximum duration of 12 months (until March 2021). The Italian government also prohibited dismissal for economic reasons linked to the pandemic. This programme initially did not entail any cost for employers, as all benefits were paid out of state funds (Faioli & Bologna Reference Faioli, Bologna, Drahokoupil and Müller2021), although co-financing by employers was subsequently considered. Moreover, no legislative provisions were adopted that linked the STW-COVID benefits to training, retraining, or reorientation. As regards the role of trade unions, it was necessary to negotiate the conditions of application at company level for entities with more than five employees. Between 2019 and 2020, GDP in Italy fell by the significant percentage of 9.9% (€135,409 million), while the unemployment rate recorded a slight increase, from 9.2% in 2019 to 10% in 2020.
Netherlands (Werktijdverkorting). The STW scheme in the Netherlands, called the werktijdverkorting, is a programme that applies in situations other than normal business risk, such as fires, epidemics and floods.Footnote 11 To be eligible for the programme, companies were required to prove that the reduction in working hours was at least 20% over a period of between 2 and 24 weeks (Cremers Reference Cremers, Drahokoupil and Müller2021). Moreover, there were no exceptions for qualifying for this programme, as long as the worker’s hours had been reduced by at least the minimum.
The compensation available under the STW scheme depended on the economic loss experienced by the business: if the business profit was reduced by 100%, 50%, or 25%, the compensation granted was 90%, 45%, or 22.5%, respectively. During the pandemic, state funds covered 30% of pension contributions and employee bonuses, and, in the case of the self-employed, a special allowance of €1,050 (per month) was created for three months. The STW-COVID scheme started on 17 March 2020 and extended until December 2021 (21 months). In addition, the entire subsidy – including social contributions – was financed by the state. While, in the early months of the pandemic, no obligations were placed on workers benefiting from the STW, when restrictions on mobility began to be relaxed, it was recommended that workers be trained and retrained. Employers were required to maintain the wage bill and to continue to employ the beneficiaries. It was also recommended that they offer training and, if a worker were dismissed, they had to help the worker to look for a job. Finally, despite the urgency of implementation, it was possible for trade unions to negotiate some elements of the programme.
During the implementation of the werktijdverkorting, the unemployment rate did not exceed 4.9% in 2020, compared to 3.4% in 2019; over these two years, GDP fell by 3.9% (€13,304 million). The Netherlands also did not request financial assistance from the European Commission for the implementation of its STW.
Slovakia (First Aid). First Aid was the employment preservation scheme set up in Slovakia in March 2020 with the aim of supporting businesses, securing employment for workers and enabling some remuneration during the pandemic (Kováčová Reference Kováčová, Drahokoupil and Müller2021). To be eligible for this programme, workers were required to be unable to continue working or to have had their working time reduced by an administrative decision. STW-COVID left outside its protection temporary workers and public employees. The replacement rate was 80% of gross salary. The maximum amount per beneficiary ranged from €540 to €810 per month. The maximum duration of the programme was 16 months. The number of beneficiaries reached 33% of all workers (European Trade Union Confederation 2020). During STW-COVID, employers were required to continue paying social security and health insurance contributions for their workers. In addition, employers were entitled to an allowance if the worker remained in employment for at least three months, and STW beneficiaries could not be dismissed until at least one month after the end of the payment of benefits. For the implementation of STW-COVID, the authorisation of the union representatives was required. Although GDP decreased by 3.3% (€980 million) from 2019 to 2020, the unemployment rate in this period increased only slightly (from 5.8% to 6.7%).
Spain (Expediente de Regulación Temporal de Empleo- ERTE). In Spain, COVID TLAPs or ERTE made it possible for companies to suspend employment contracts for workers who had been linked to the company for a certain period of time, without the need to pay any remuneration. The STW-COVID scheme applied to all businesses (and self-employed people) that were forced to close by an administrative decision. The catering, transport, leisure, tourism, and commercial sectors benefited the most; moreover, no collective was excluded. The replacement rate was 70% of the previous gross salary for the first six months, then 50% from the seventh month onwards, with 100% of the benefit being paid out of state funds. In addition, new hiring or outsourcing was prohibited as long as the STW was applicable, and there was a 100% or 90% rebate, respectively, on employer social security contributions for companies with fewer than 50 or more than 50 workers (Izquierdo et al Reference Izquierdo, Puente and Regil2021, Reference Izquierdo, Puente and Auciello2022). The beneficiary workers were considered as a priority group for training, with a focus on digital skills courses, as well as the implementation of sectoral and cross-sectoral training plans. The dismissal of workers was prohibited for at least six months after the end of the TLAP; in addition, no overtime could be worked, nor could activities carried out by workers on the STW-COVID scheme be contracted out or subcontracted. As COVID was a force majeure event, no agreement between the worker and the employer was necessary (Cruces Reference Cruces, Drahokoupil and Müller2021; Izquierdo et al Reference Izquierdo, Puente and Regil2021, Reference Izquierdo, Puente and Auciello2022), although some elements of STW-COVID were, in practice, negotiated. Between 2019 and 2020 the unemployment rate increased from 13.8% to 16.3%, while a decline of 11.2% in GDP (€126,503 million) was recorded.
Switzerland (Kurzarbeitsentschädigung). Switzerland, Germany, and Austria were among the first countries to opt for the application of STW as a measure to contain unemployment and maintain employment during a crisis. The main objective of STW in Switzerland is to prevent workers from having to be dismissed, in exchange for which a reduction in working time is made possible. STW is reserved for situations involving a temporary cessation or reduction of a company’s operations for extraordinary reasons. The beneficiaries of STW-COVID were employees who had experienced a reduction of at least 10% of their working time for economic reasons. STW-COVID also included self-employed workers and those on temporary contracts.
The programme made it possible for workers to receive 80% of their previous income during the pandemic (Baumann Reference Baumann2021). The applicable Swiss canton paid this compensation to the employer and the employer passed it on to the worker. This programme was in place during the pandemic for 18 months, until 31 December 2021. The employer was obliged to pay full social security contributions into the STW-COVID programme, with no further obligations in respect of the beneficiaries; in addition, trade union representatives were able to negotiate some elements of the programme. The maximum number of workers benefiting from this programme was 1,300,000, in April 2020. GDP declined by 2.1% from 2019 to 2020, and the unemployment rate picked up from 6.8% to 8.5%.
United Kingdom (Coronavirus Job Retention Scheme). The Coronavirus Job Retention Scheme (CJRS) was the temporary programme designed to address the impact of COVID on the UK labour market.Footnote 12 It was approved on 20 March 2020 and was extended several times until 30 September 2021. While initially only workers who experienced a 100% reduction of their working time for at least 3 weeks were eligible for this programme, from 1 July 2020, the eligibility criteria were relaxed. The programme sought to ensure that workers maintained their wages and employment, while at the same time enabling businesses to maintain their human capital and avoid an increase in unemployment and a lack of worker protection (Eurofound 2020). Through this programme, the employee could receive up to 80% of their salary through state aid, with a limit of €2,800 per month for a maximum period of two years (Fulton Reference Fulton, Drahokoupil and Müller2021). Payment of the benefit was fully covered by the state. In addition, the replacement rate was reduced to 60% in the last months of the programme. During the entire time the CJRS was in place, the companies stopped paying social security contributions for their workers. There was no obligation on the part of the worker to undergo training, although the state authorities encouraged this practice. Finally, although agreement with the trade unions was not required for the implementation of STW-COVID, it was possible to negotiate an important part of the programme.
In the months when the effects of COVID on the labour market were most intense, the number of beneficiaries of the CJRS reached 9 million and the unemployment rate did not rise above 4.8% in 2021, compared to 3.8% in 2019. GDP in 2020 showed a decrease of 9.0% on the 2019 figure (€135,409 million). Table 1 summarises this information for all the countries analysed.
Implementation of STW-COVID in some European countries

Source: European Trade Union Institute (2021) and Eurofound (2023)
The impact of short-time work schemes in the EU
In the last two decades, the world’s economies have faced two major crises, which have had different repercussions for the labour market. The first, known as the Great Recession (2007–2013), originated in the construction sector and its complementary activities, where there was uncontrolled growth as a result of recourse to easy credit. This was a consequence of the generosity of financial institutions in granting loans to both individuals and companies (International Monetary Fund (2020b) at international level, Alcalá (Reference Alcala2020) for Spain). This speculative spiral ended with the abrupt slowdown experienced by the construction sector, which was immediately transferred to the financial sector, causing numerous closures of companies due to their high level of indebtedness and the significant levels of default of those families exposed to credit (BBVA Research 2020 for Spain). Subsequently, the effects were transferred through the entire economy, especially to consumers (see Alcalá Reference Alcala2020 for Spain).
However, the COVID crisis (2020–2022) was due to the inability of workers to go to their workplaces, and the limitations placed on how consumers could buy goods and receive services. The severe restrictions imposed by governments initially brought economic activity to a near standstill. Although these restrictions were later relaxed, the measures slowed down the economy, especially in commercial activities, tourism, restaurants, and transportation (Alcalá (Reference Alcala2020) for Spain). Consequently, the COVID crisis was not of a financial nature – as the Great Recession had been – but rather, was the result of administratively imposed health restrictions. Therefore, the origins of the crises are totally different (International Monetary Fund (2020b) at international level); something similar can be noted for the economic policy measures taken to mitigate the effects of the two crises (Ingham (2022) at international level Torres and Fernández (Reference Torres and Fernández2022) and Revista de la Seguridad Social (2020) for Spain).
Various studies have assessed the role of STW in economic crises, both the crisis arising from financial issues in 2008 and the crisis caused by the 2020 pandemic. Studies analysing STW from an economic perspective during the Great Recession tend to point to its positive effects, albeit that they are rather limited. Hijzen and Venn (Reference Hijzen and Venn2011) used cross-country data from 19 OECD countries to analyse the impact of STW schemes during the 2008–2009 crisis, and found that these schemes can create jobs even in situations of job destruction. In a subsequent article, Hijzen and Martín (Reference Hijzen and Martin2013) reported for 23 EU countries that STW schemes have a positive impact on the elasticity of hours to GDP, but a negative effect on the elasticity of employment.Footnote 13 Boeri and Bruecker (Reference Boeri and Bruecker2011), based on a sample of 21 EU countries, concluded that the effects of STW are improved if other measures are applied, such as hiring subsidies, establishing mechanisms of co-participation in the financing of the programme and allowing access to workers with temporary contracts. In addition, the use of these programmes is particularly recommended for jobs with high productivity. It seems that the effectiveness of such measures is much higher in the short term than in the medium and, especially, the long term (Giupponi & Landais (Reference Giupponi and Landais2023) for Italy). Finally, on the firm side, STW also enables higher survival rates (Cahuc et al (Reference Cahuc, Kramarz and Nevoux2018) for France), especially for companies with higher levels of human capital and higher firing costs, with the effects being more concentrated in manufacturing and construction, a result obtained from a sample of 20 EU countries (Lydon et al Reference Lydon, Mathä and Millard2019).
As has been pointed out, during the pandemic, most European countries activated their employment protection mechanisms with programmes that sought to allow companies to temporarily suspend contracts and/or reduce the working time of part or all of their workforce through an STW scheme. Müller and Schulten (Reference Müller and Schulten2020) note that, as of April 2020, more than 42 million workers in the EU-27 (27% of all employed persons) were protected by STW.Footnote 14 By country, the impact was very uneven, and depended on the degree of generosity and the speed at which new measures were applied, or the adequacy of existing measures. In Switzerland, France, Italy, and Luxembourg, STW protected between 40% and 50% of workers. In Spain, the percentage reached 24%,Footnote 15 while in Germany, the UK, and the Netherlands, it was 27%.
Regarding the economic results of the application of STW-COVID schemes, most studies point out the good effect of these instruments (as reformed at the beginning of the pandemic) on employment and unemployment (Kopp and Siegenthaler (Reference Kopp and Siegenthaler2021) for Switzerland; García-Serrano (Reference García-Serrano2022), Díaz et al (Reference Diaz, Dolado, Jañez and Wellschimied2023), Osuna and García-Pérez (Reference Osuna and García Pérez2022) and Carrasco et al (Reference Carrasco, Hernanz and Jimeno2024) for Spain; Meriküll and Paulus (Reference Meriküll and Paulus2023) for Estonia). Brey and Hertweck (Reference Brey and Hertweck2020), on the basis of an analysis for several European countries, point out that the effectiveness of an STW scheme is greater in the early stages since its results are lost as the measure is extended over time; this result was confirmed for Spain in the work of Izquierdo et al (Reference Izquierdo, Puente and Regil2021, Reference Izquierdo, Puente and Auciello2022).
However, not everything related to STW schemes is positive. As a subsidy, there are also undesirable effects typical of this type of aid, notably deadweightFootnote 16 and displacement effects.
Footnote 17Moreover, STW can delay the recovery of employment and the mobility of workers to more productive enterprises. Thus, Giupponi et al (Reference Giupponi, Landais and Lapeyre2022), based on an analysis of several EU countries, point out that those programmes that combine STW with unemployment insurance can affect the reallocation of labour resources, so that STW should be used together with other measures such as hiring subsidies. Díaz et al (Reference Diaz, Dolado, Jañez and Wellschimied2023), for the Spanish case, point out the advantage of avoiding the application of an STW scheme to all types of jobs, as this avoids problems of reallocation and the hoarding of labour in those sectors or activities where it is not efficient, in order to ensure employment. A similar result is obtained by Bellmann et al (Reference Bellmann, Bellmann and Hübler2023) for Germany. The drawbacks do not end there, as these protective measures may result in the survival of firms that would have had to close down in the absence of the aid, which are often labelled zombie firms (Banerjee & Hofmann Reference Banerjee and Hoffman2018).Footnote 18
A very important question to consider is whether the resources used for the temporary maintenance of employment have had an adequate impact and, especially, whether it is necessary to rely on high economic stimuli. Based on the work of Bělín and Veselkova (Reference Bělín and Veselkova2024) for Slovakia, it can be noted that in Slovakia, despite the relatively low expenditure compared to the significant investments in other countries, the results were very positive. Thus, the programme allowed the survival of enterprises, the recovery of jobs and the protection of workers’ incomes. Moreover, the strong targeting of particular sectors made it possible to focus on the cases that needed it most. The positive effects were much greater as COVID cases increased, so the employment maintenance scheme helped to save jobs at risk. Askenazy et al (Reference Askenazy, Brébion, Courtioux, Erhel and Mofakhami2024) identify a number of strategies that could have been implemented in the workplace to mitigate the effects of the pandemic and ameliorate the effects of STW. Askenazy points to the need to implement integrated programmes and not just focus public action on temporary income maintenance subsidies. Finally, empirical evidence shows that STW is only effective in a severe economic downturn, so that it is necessary to limit its use in milder recessions and during recovery phases; in other words, it is necessary to de-escalate the protection measures when the economic situation improves (García Clemente et al (Reference Garcia-Clemente, Rubino and Congregado2023) for Spain). Table 2 summarises the main results of these studies.
Some results for STW schemes in the financial crisis and COVID crisis

Source: own elaboration based on the referenced studies.
The costs and benefits of short-time work schemes in the EU
With STW schemes, employers limit their loss of income in the short term, while the effects of the crisis on the capital and labour market are reduced in the medium and long term (Alujas Ruiz, Reference Alujas Ruiz2022). Moreover, by retaining skilled workers, companies avoid redundancy costs, which can be a significant outlay for long-serving permanent workers because of the level of compensation to be paid. At the same time, STW allows them to sidestep the costs of hiring new (or the same) workers and subsequently training them once the temporary crisis situation has subsided. STW schemes can thus help to achieve economic recovery in a shorter period of time (Albertini et al Reference Albertini, Fairise, Poirier and Terriau2022).
The decision of governments to intervene to prevent massive job losses during the COVID crisis was a milestone in EU employment policy (European Commission 2023); it was only possible because of the significant funding commitments made by the EU when the pandemic started. By 2020, more than 40 million workers were supported by employment protection. Although the interventions to safeguard employment were very costly for public budgets, they were less costly than the payment of unemployment benefits and the other investments needed to return to normality.
The costs of mass unemployment, both economic and non-economic, are very high. The economic costs include the payment of unemployment benefits, the loss of skill among the labour force due to not being able to work, a slower recovery after the crisis as labour is not immediately available, a fall in the purchasing power of both workers themselves and companies due to a lower demand for their products, and the cost of reintegrating unemployed workers. Other costs are of a social nature, such as the foreseeable increase in the number of families falling into poverty, the decrease in welfare levels and the increase in social exclusion (Alujas Ruiz, Reference Alujas Ruiz2022). All of these repercussions, and not just the immediate economic costs of the programme, must be considered when evaluating STW schemes as a whole.
Because of the high costs, the EU offered Member States significant assistance through the Support mitigating Unemployment Risks in Emergency (SURE) instrument, which ran from 2020 to 2022. SURE was the European Commission’s temporary support instrument to mitigate unemployment risks in the face of the pandemic,Footnote 19 and it had a budget of €100,000 million, one of the highest investments in employment protection in the EU. The total number of beneficiaries in the EU under this income and employment maintenance programme was 31.5 million employed and self-employed persons, and it reached more than 2.5 million enterprises. SURE made it possible for Member States to avail themselves of an alternative to reduced working time schemes for several months. It also supported the NextGenerationEU recovery plan.
Table 3 summarises the main actions carried out between 2020 and 2022. Half of the budget went to finance working time reduction schemes for employees, while 33% went to similar measures for the self-employed. Wage subsidy schemes accounted for 12% and the remaining 5% went to health-related measures.

Footnote 20Moreover, according to European Commission estimates, Member States saved approximately €9 billion in interest payments by resorting to SURE, thanks to the EU’s high credit rating, as the bonds were issued at a very low interest rate (European Commission 2023).
In Spain, SURE helped to limit the effects of the restrictions on economic activity resulting from the March 2020 state of alert, which allowed the decline in GDP (of over 10%) to be accompanied by a much smaller reduction in employment than in previous crises, in terms of both duration and the number of unemployed. Thus, the unemployment rate in Spain during the 2008–2013 financial crisis reached 26.1% in 2013, from 8.2% in 2008, while during the 2020–2022 pandemic crisis, the unemployment rate rose from 14.1% in 2019 to 15.5% in 2020. This was possible because of the internal flexibility granted by the TLAP scheme following the 2020 regulatory changes, which made it possible to sustain employment in many non-core sectors and those affected by restrictions and without teleworking potential (Ruesga & Viñas Reference Ruesga and Viñas2021, Reference Ruesga and Viñas2022).
Footnote 21The changes introduced in 2020 on the functioning of TLAPs in Spain also made it possible to overcome the limited results demonstrated by previous studies (Arranz et al Reference Arranz, García-Serrano and Hernanz2015), where the estimates obtained suggested that such programmes had limited use before the reform.Footnote 22 The positive results of STW-COVID in Spain have also been pointed out by García-Serrano (Reference García-Serrano2022), who indicated how TLAPs – together with other measures such as teleworking – enabled a reduction of the negative effects of the pandemic in labour matters. Osuna and García-Pérez (Reference Osuna and García Pérez2022) point out that the potential unemployment rate would have shot up if the labour adjustment had only been carried out by means of lay-offs. Carrasco et al (Reference Carrasco, Hernanz and Jimeno2024) report that the probability of not losing their jobs was much higher for STW-COVID beneficiaries than for those who did not benefit from this programme, whether they were on permanent or temporary contracts.
Consequently, the modifications approved after the early stages of the pandemic contributed greatly to the success of TLAPs in Spain, especially when the duration of coverage was short (Izquierdo et al Reference Izquierdo, Puente and Regil2021, Reference Izquierdo, Puente and Auciello2022; García-Clemente et al Reference Garcia-Clemente, Rubino and Congregado2023). This issue, as we shall see, suggests the establishment of certain limitations on the extent of TLAP schemes, especially if we consider that Spain allocated more resources and applied TLAPs for longer (25 months) than most other EU countries. Specifically, in 2020, the allocation amounted to 1.8% of GDP (Drahokoupil & Müller Reference Drahokoupil and Müller2021). Moreover, it is not possible to ignore the existence of certain negative effects of the programme application, as pointed out by Díaz et al (Reference Diaz, Dolado, Jañez and Wellschimied2023), among others, who argue that, although the TLAPs allowed unemployment in Spain to be contained, they may also have generated a ‘hoarding effect’ on the labour force, limiting the reallocation of workers to those sectors or activities not particularly affected by the recession.Footnote 23
Temporary labour adjustment plans (TLAPs) in SpainFootnote 24
A TLAP is an administrative procedure that allows a firm to temporarily suspend or reduce its employment relationship with its workers if the company can demonstrate an economic need to do so. TLAPs did not just appear at the time of the 2020 pandemic in Spain: they first appeared in the 1980 Workers’ StatuteFootnote 25 and were maintained after the 1995Footnote 26 amendment of that statute. However, the use of TLAPs before 2020 was very limited (Lahera Reference Lahera, Gregoraci and Velasco2021). By way of example, in 2009, because of the financial crisis, the number of TLAPs was slightly over 13,300 and covered 465,600 workers (Méndez & Sánchez-Moral, Reference Méndez and Sánchez-Moral2023), which accounts for only 0.5% of all employees between 2009 and 2012 (Izquierdo et al Reference Izquierdo, Puente and Regil2021).Footnote 27
As a result of the powerful impact of the COVID pandemic on the Spanish labour market, seven extensions of the STW scheme were approved, extending the coverage for two years. The latest extension, through Royal Decree-Law 2/2022, of 22 February 2022,Footnote 28 made it possible to extend a TLAP until 31 March 2022, with the extension period being intended as a transition period towards the full recovery of economic activity. With this latest regulatory change, neither TLAP ETOP (for Economic, Technical, Organisational or Productive reasons) nor force majeure TLAP was abolished, but the administrative conditions for applying for them were modified. In addition, new types of TLAP were created based on the RED mechanismFootnote 29 to cover situations of general or sectoral crisis under two modalities, cyclical and sectoral, to address exceptional needs (García-Serrano Reference García-Serrano2022). The former refers to situations of cyclical economic crisis requiring labour flexibility measures, with a maximum duration of one year. The sectoral type is reserved for when a given sector undergoes permanent changes that require the retraining or professional transition of workers.Footnote 30 The maximum duration of a sectoral TLAP is one year – the same as for the cyclical modality – but with the possibility of two extensions of six months each; such TLAPs also require a retraining plan for the persons concerned. With the 2022 reform, the administrative procedures for requesting a TLAP were simplified, and the processing times were reduced (Ramírez Reference Ramírez2023).Footnote 31 As a result, after the pandemic, the labour measures would continue to reinforce the number of TLAPs as STW schemes in Spain and try to discourage the use of TLAP.
After outlining the main regulatory changes adopted for TLAPs in Spain, the next step is to describe how these changes have affected unemployment, unemployment rates, and employment – both for workers with permanent and those with temporary contracts – during the last two major economic crises: the financial crisis and the COVID crisis.
Figure 1 shows the changing number of TLAPs between March 2020 and February 2022 and their relationship with social security enrolment. The peak of the series appeared in April 2020, when almost 3.6 million workers were under a TLAP. Of these, most (3.2 million) were in the category of total suspension of their activity, while more than 405,000 were under partial suspension. If we add the 800,000 people who lost their jobs (most of whom were on temporary contracts) to the 3.6 million workers under TLAPs, the number of workers who stopped working was 4.4 million.
Evolution of temporary labour adjustment plans, TLAPs (March 2020 – February 2022). Source: Labour Force Survey. National Statistics Institute (various years).

The incidence of TLAPs shows a downward trend as the confinement measures were relaxed and the economy reactivated. The number of workers reached a figure slightly above 115,000 and has been stable at that figure since March 2022. As for the distribution by type of TLAP suspension, there has been hardly any difference between total and partial suspensions since March 2022. This translates into a situation of clear stability in terms of the employment of the TLAP scheme.
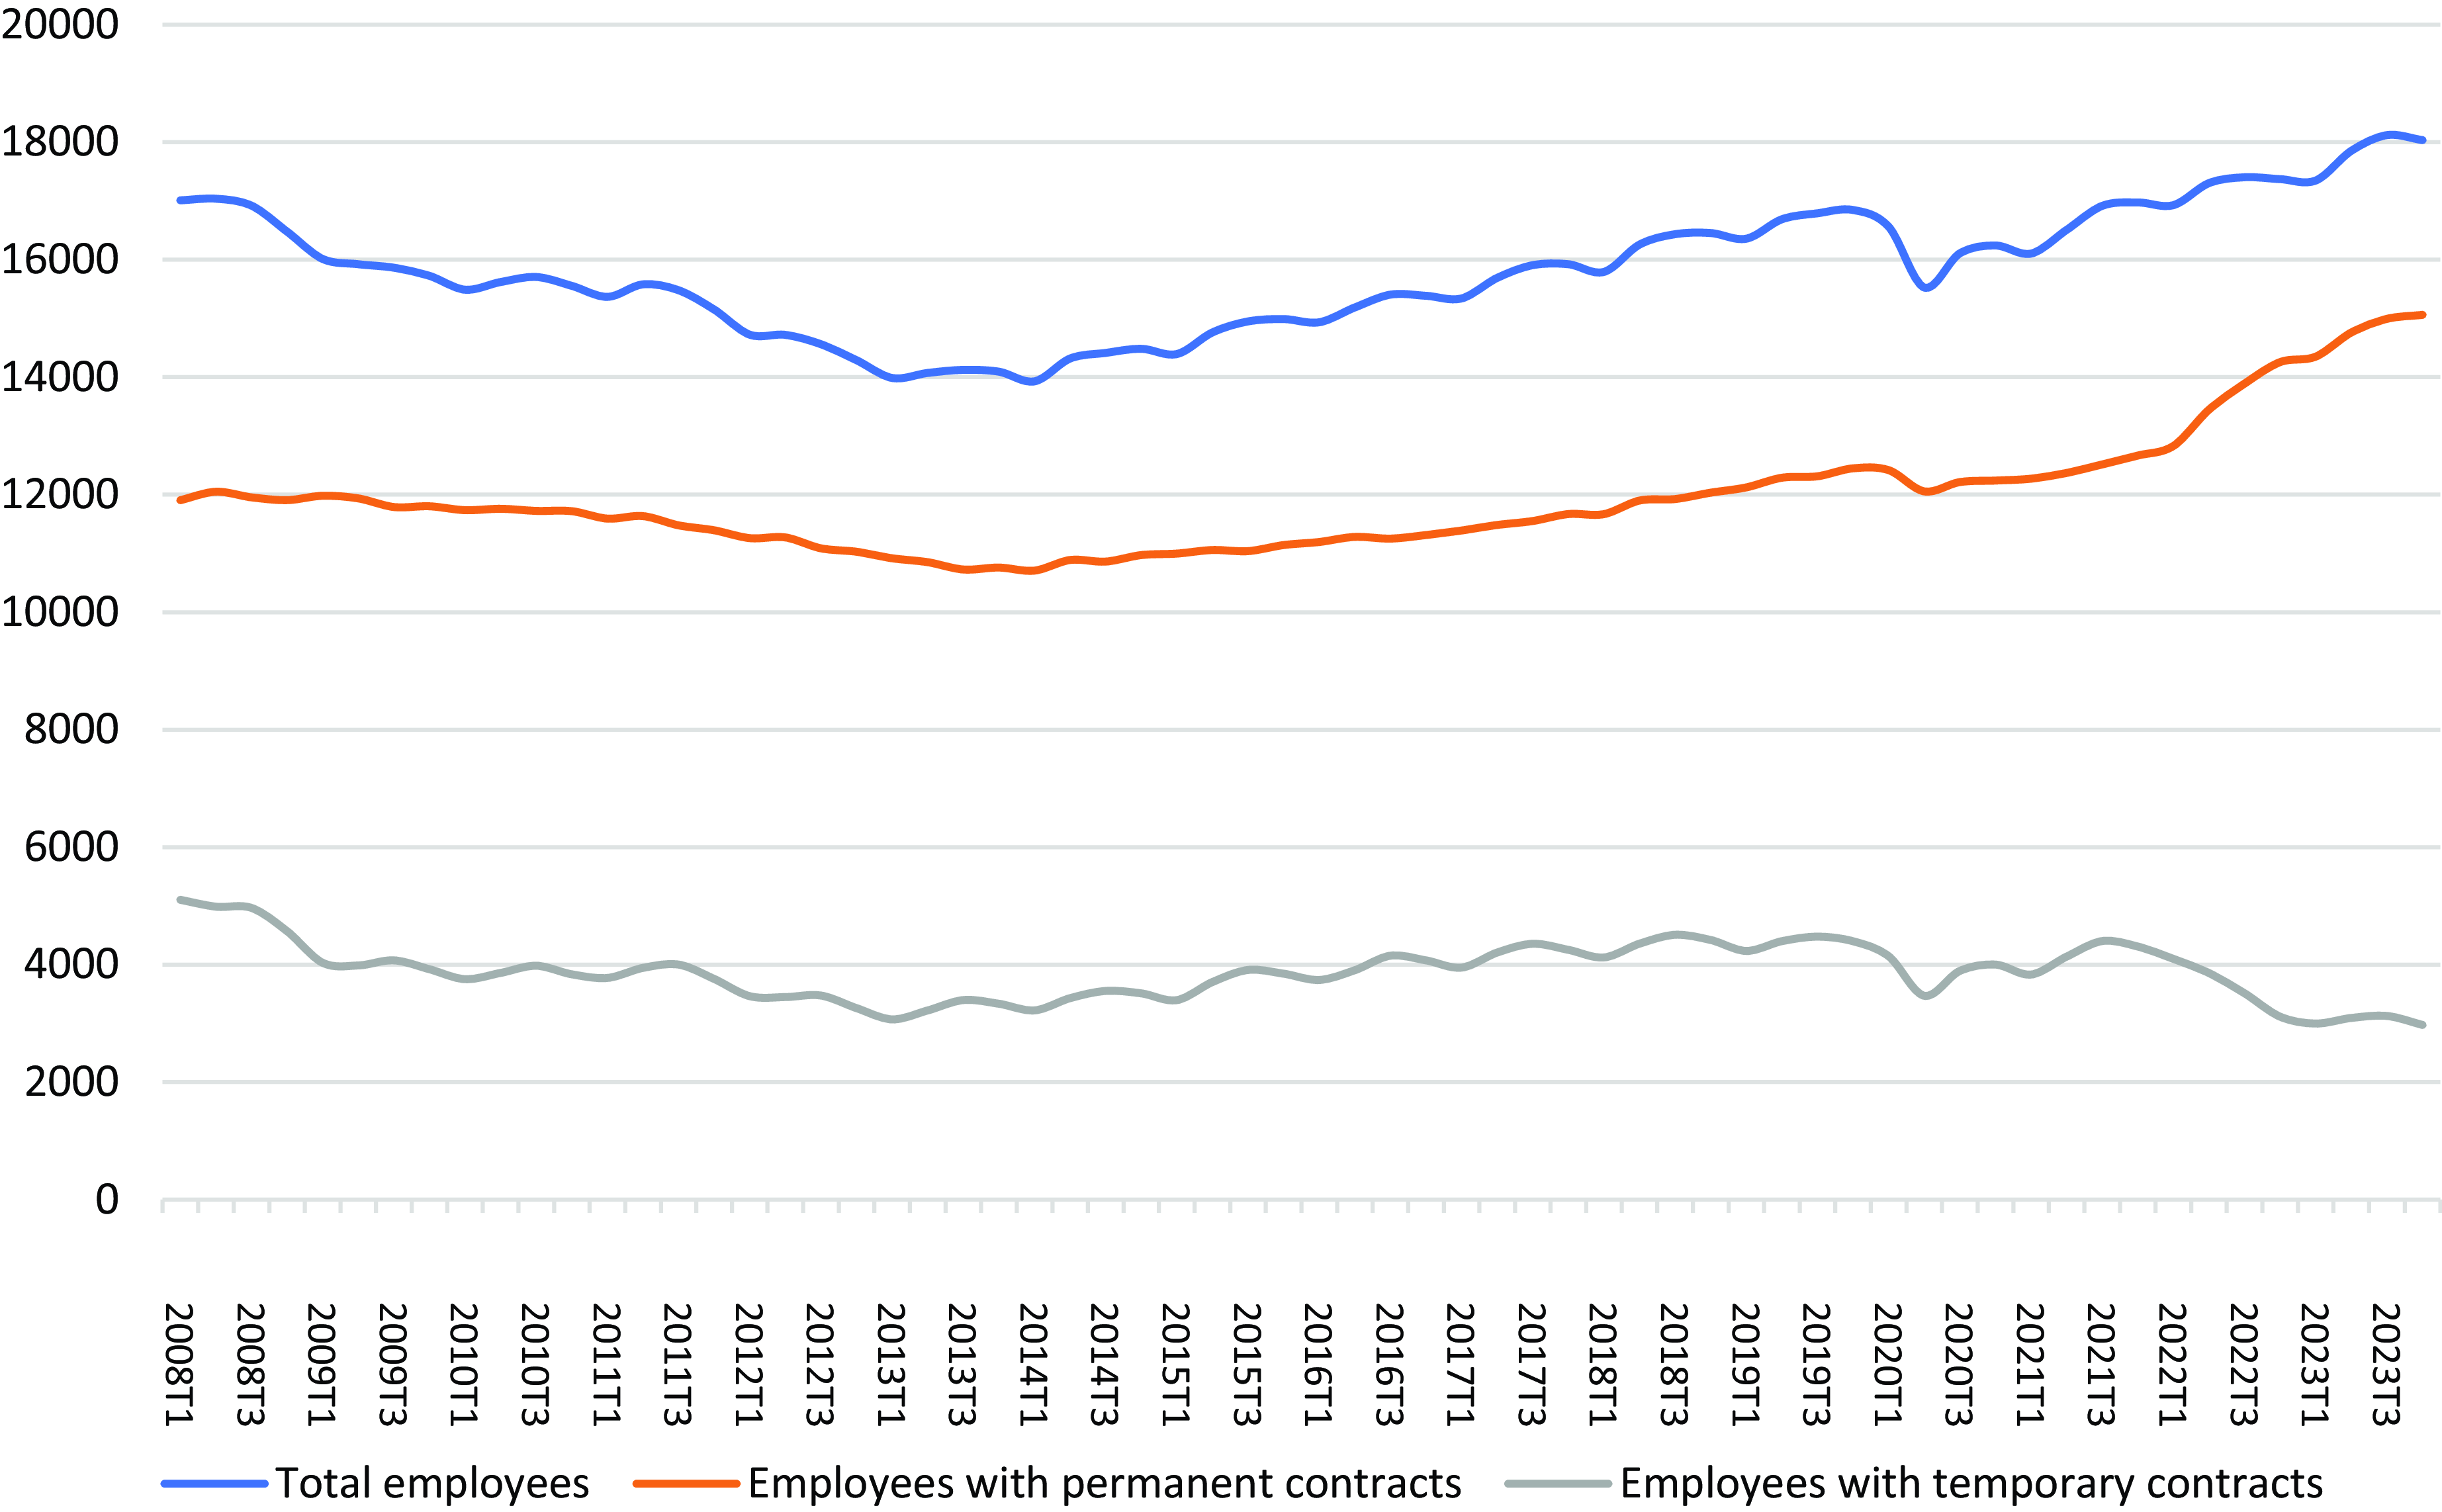
Figure 2 compares the total number of people with permanent and temporary employment contracts between 2008 and 2023, to determine how the labour adjustment occurred, comparing the 2008 crisis with the 2020 pandemic. There was a significant decline in the number of employees, from more than 17 million in the first quarter of 2008 to 13.9 million in the first quarter of 2013; this meant a loss of more than three million employees. Most of these were on temporary contracts – just over two million compared with one million workers on permanent contracts (Figure 3).
Evolution of total number of employees with permanent and temporary contracts (January 2008 – March 2023), in thousands.Source: Labour Force Survey. National Statistics Institute (various years).
Evolution of temporary labour adjustment plans (TLAPs) for employees with permanent and temporary contracts (March 2020 – November 2023). Source: Labour Force Survey. National Statistics Institute (various years).

By contrast, the figures for employees during the pandemic were completely different, with a maximum reduction of 742,000 jobs between the fourth quarter of 2019 and the first quarter of 2021; of this decline, 565,800 of the jobs lost were for employees on temporary contracts and 176,200 for workers on permanent contracts. By the end of 2023, the number of employees exceeded 18 million, of which just over 15 million were on permanent contracts and almost 3 million on temporary contracts. García-Serrano (Reference García-Serrano2022), Díaz et al (Reference Diaz, Dolado, Jañez and Wellschimied2023), García-Clemente et al (Reference Garcia-Clemente, Rubino and Congregado2023), Osuna and García-Pérez (Reference Osuna and García Pérez2022) and Carrasco et al (Reference Carrasco, Hernanz and Jimeno2024) point out that the use of TLAPs thus made it possible to maintain employment for a large proportion of employees in Spain who would otherwise have lost their jobs. However, as previously pointed out, we cannot ignore certain negative effects of the application of TLAPs on the reallocation of the labour force (Díaz et al Reference Diaz, Dolado, Jañez and Wellschimied2023), or that its usefulness in relation to job permanence is diluted as the protection programme is extended over time (Izquierdo et al Reference Izquierdo, Puente and Regil2021, Reference Izquierdo, Puente and Auciello2022; García-Clemente et al Reference Garcia-Clemente, Rubino and Congregado2023).
Figure 4 compares the evolution of the unemployment rate and the number of people unemployed during the last two economic crises. During the period 2008–2013, the number of unemployed and the unemployment rate both continued to rise despite TLAPs. However, during the pandemic, TLAPs made it possible to smooth out the growth of both the unemployment rate and the number of people unemployed, despite the decline in GDP in 2020 of 11.2%, a figure even higher than the decline of 8.0% between 2008 and 2013.
Evolution of the unemployment rate and number of people unemployed (first quarter 2008 – last quarter 2023). Source: Labour Force Survey. National Statistics Institute (various years).

There are also important differences between the profiles of TLAP beneficiaries during the two crisis periods. Among the smaller number of workers benefiting from a TLAP after the 2008 crisis, the dominant profile was a relatively senior man in a job linked to construction and its related industries or to commerce; the profile corresponding to the COVID crisis, however, turned out to be very different. In December 2020, the presence of women was slightly higher than that of men, and this difference was accentuated in December 2021 (53.5%). Another significant difference corresponds to the beneficiaries by type of contract: 90% of beneficiaries during the pandemic were workers with permanent contracts. By level of education, the 2008 crisis meant that many TLAPs applied to people with a university education, but during COVID most beneficiaries had lower levels of education. With regard to age profile, a considerable proportion of beneficiaries during the financial crisis were workers aged 55–64 years, which was not the case during the pandemic, which affected workers of all ages (Felgueroso & De la Fuente Reference Felgueroso and De la Fuente2021; Izquierdo et al Reference Izquierdo, Puente and Regil2021, Reference Izquierdo, Puente and Auciello2022). These differences may be at least partially due to the very uneven presence of TLAPs by sector, especially the service sector, which was one of the sectors most affected by the confinement measures. Another major difference is that, because of COVID, the extraordinary severance benefit for self-employed workers who were severely affected by the pandemic was approved. In fact, during the financial crisis of 2008, these workers had no severance pay until it was approved in 2010. Moreover, with this measure, only those self-employed workers who voluntarily paid contributions for this concept were entitled to the 2010 protection, which meant a reduced number of beneficiaries. From 2019, this contribution was compulsory (Revista de la Seguridad Social 2020). Table 4 summarises this information.
Profile of beneficiaries of temporary labour adjustment plans (TLAPs) (Financial Crisis and COVID Crisis)

Source: Izquierdo et al (Reference Izquierdo, Puente and Regil2021, Reference Izquierdo, Puente and Auciello2022).
What can be done to improve the functioning of short-time work schemes?
The response to solving economic crises from the perspective of labour market adjustment follows two fundamental routes. The first is through mechanisms of external flexibility that favour dismissal, with an immediate increase in unemployment rates: the lower the firing costs, the greater the use of this first channel. At the same time, if the cost of hiring and training is low, the lay-offs have greater intensity, as the cost of replacing human capital is lower. The second path is through internal flexibility and the modification of working conditions and working time while sustaining employment levels. This requires public subsidies to maintain jobs (Ruesga & Viñas Reference Ruesga and Viñas2021). This second path is the one that has been followed in, for example, Germany or Austria for many years with the Kurzarbeit schemes. In recent years, other European countries have also tried to opt for the second path, based on the flexicurity argument (Mandl et al Reference Mandl, Hurley, Mascherini, Storrie, Broughton, Owczarzak, Riso and Salvatore2010), as in the case of the Netherlands. In these countries, a flexible labour market, a high level of unemployment protection and a strong commitment to active training policies have been the approaches adopted.
As has been indicated, in Spain, there have been STW schemes (TLAPs) for more than four decades, although until the pandemic they had little practical applicability. In Spain, force majeure TLAPs helped to cushion the effects of the COVID crisis and were demonstrated to be effective in mitigating loss of employment and income. These good results make it advisable to continue these programmes for future critical situations. However, it is necessary to improve their functioning for future crisis situations. The aim of this section is to make a series of economic policy recommendations for the Spanish case based on the comparative study. Moreover, since the functioning of STW schemes is broadly similar in most European countries, we believe that this exercise has a much wider scope.
1. Limit the duration of STW schemes. Empirical studies tend to agree that STW is useful and has a positive effect in maintaining employment during a recession if the lack of work is transitory. If the recession is prolonged, however, this effect is exhausted (Bělín & Veselkova Reference Bělín and Veselkova2024; Boeri & Bruecker Reference Boeri and Bruecker2011; Stuart et al Reference Stuart, Spencer, McLachlan and Forde2021). That is, if there are permanent mismatches between labour supply and demand, structural transformation becomes necessary. If this is not done, STW only prolongs the need, but at a high, unproductive cost. Hijzen and Martín (Reference Hijzen and Martin2013) found that, while STW had a positive effect during the 2008 crisis, its continued use during the recovery had a negative influence on employment. The net effect on employment fell and STW even generated more costs than benefits, although STW schemes have proved to be suitable for transient situations (Malo Reference Malo2021). Econometric studies for Spain (García-Clemente et al Reference Garcia-Clemente, Rubino and Congregado2023; Izquierdo et al Reference Izquierdo, Puente and Regil2021, Reference Izquierdo, Puente and Auciello2022) have also shown that STW schemes are appropriate for protecting labour relations, and that their effectiveness is higher for short periods. Moreover, if the employer estimates that the mismatch situation is short-lived, they will try not to do without labour, by internalising the potential effect, thus reducing the need for STW (Díaz et al Reference Diaz, Dolado, Jañez and Wellschimied2023; Brey & Hertweck Reference Brey and Hertweck2020; Izquierdo et al Reference Izquierdo, Puente and Regil2021, Reference Izquierdo, Puente and Auciello2022).
2. Find a mechanism that favours the flexibility of STW schemes. In order for a programme to function properly and to perform in the desired way, it needs to be continuously adapted to the economic situation of the company, through flexible and simple procedures of varying intensity depending on the degree of need for the insurance instrument. Therefore, the operation of the programme must be free from rigid mechanisms (Felgueroso & Jansen Reference Felgueroso and Jansen2020; Panayiotis & Bekker Reference Panayiotis and Bekker2023). Contributory unemployment benefits, which seek to guarantee a certain income while an individual is searching for a job, provide for a gradual reduction of aid to avoid excessive dependence and incentivise the search process, and similar mechanisms should be chosen for STW.
3. Incentivise the reincorporation of workers benefiting from STW schemes. An STW scheme must have sufficient incentives to encourage the reincorporation of workers at a pace in line with the performance of the economy. As can be seen, the programme worked very well in the early stages of the economic crisis, but as the duration of the programme was extended, the effects diminished (Boeri & Bruecker Reference Boeri and Bruecker2011; Izquierdo et al Reference Izquierdo, Puente and Regil2021, Reference Izquierdo, Puente and Auciello2022; Stuart et al Reference Stuart, Spencer, McLachlan and Forde2021). Improvements to the design are therefore needed. One possibility would be to narrow the eligibility requirements, such as by requiring a company to demonstrate much greater economic need, or to add conditions for the receipt of benefits by firms and workers, such as searching for a job and/or taking part in training while participating in the programme (Hijzen & Venn Reference Hijzen and Venn2011). Another option would be the inclusion of a certain penalty for abuse of the STW; for example, employers who systematically used this type of instrument would have to bear higher costs in their unemployment contributions (Arpaia et al Reference Arpaia, Curci, Mejermans, Peschner and Pierini2010). Another possibility would be to target STW on jobs with high productivity and not to extend the scheme to all types of jobs. At the same time, increasing the cost of STW for employers – for example through a co-payment system – could be considered so that it would only be profitable for high productivity jobs (Díaz et al Reference Diaz, Dolado, Jañez and Wellschimied2023).
4. Improve incentives for the training and re-skilling of workers. Although this should be a general policy, it should have greater intensity in those sectors or activities where worker reincorporation is more difficult. This is the case in markets where there are serious problems for the mobility of workers between sectors and even activities, but the benefits of active labour market policies are severely limited when they are not complemented by other active employment policies (Brey & Hertweck Reference Brey and Hertweck2020; Kopp & Siegenthaler, Reference Kopp and Siegenthaler2021; Müller & Schulten Reference Müller and Schulten2020). Incentives for training and re-skilling could be provided by, for example, improving STW conditions with lower social contributions after the end of the programme if firms offer training to their employees during the time they are out of work. At the same time, it is necessary to make working conditions more flexible for STW to function in situations of severe economic crisis and to improve the survival rates of firms (Askenazy et al Reference Askenazy, Brébion, Courtioux, Erhel and Mofakhami2024). However, the comparison shows that most countries have considered training as optional from both the employer’s and the employee’s point of view. Although, in general, the STW-COVID schemes allowed a containment of unemployment rates, especially considering – as has been pointed out – the sharp declines in GDP between 2019 and 2020, it is none the less true that it is necessary to complement STW schemes with other measures such as distance working, to improve their results (García-Serrano Reference García-Serrano2022).
5. Improve the impact of STW on workers with temporary contracts. STW schemes usually benefit workers with stable contracts (permanent contracts), but they are not always extended to those with temporary contracts, who are precisely the people who have the greatest difficulty in re-entering the labour market (Boeri & Bruecker Reference Boeri and Bruecker2011; Cahuc & Carcillo Reference Cahuc and Carcillo2011; Hijzen & Venn Reference Hijzen and Venn2011). This may be because firms use the available flexibility tools (and STW is one of them) to protect the ‘most valuable’ workers in particular, and these workers also tend to be those with a permanent employment contract and more experience (Crimmann et al Reference Crimman, WieBner and Bellmann2012). This fact calls for the inclusion of measures to improve the situation of temporary workers during future economic downturns, which would prevent the entire adjustment from being borne by such temporary workers. Although in some countries, such as Spain,Footnote 32 this group was included among the beneficiaries of public aid, an adjustment was then made for workers with temporary contracts.Footnote 33 Indeed, a recent paper by Carrasco et al (Reference Carrasco, Hernanz and Jimeno2024) points out the benefits of STW for workers with temporary contracts in Spain, since this type of worker benefited more from these employment maintenance programmes, both in terms of the probability of being employed and in terms of wage improvements.
6. Extend STW schemes to the self-employed. Some countries – such as Spain or Germany – have extended their STW schemes to workers on temporary contracts and provided substantial support to the self-employed, and STW schemes in other countries should also be extended to the self-employed (Casey & Mayhew Reference Casey and Mayhew2023; Elia & Bekker Reference Elia and Bekker2023; Izquierdo et al Reference Izquierdo, Puente and Regil2021). The comparison exercise carried out in this research for a group of European countries shows that most of them do not consider self-employed workers as a group eligible for protection, but who have also suffered greatly from the effects of the pandemic, hence the need to include them.
7. Make companies at least partially responsible for STW schemes. To try to limit the abuse of STW schemes, it is necessary for companies to incur costs. To avoid abuse, the subsidy could be converted into a credit – at no interest or a very low interest rate – to be repaid when the programme ends (Boeri & Bruecker Reference Boeri and Bruecker2011; Felgueroso & Jansen Reference Felgueroso and Jansen2020; Stuart et al Reference Stuart, Spencer, McLachlan and Forde2021). In this way, only firms truly facing a temporary shock and without access to liquidity to cover the cost would apply to participate in the programme. A second possibility would be for companies in difficulty to bear the cost, but to repay it through delayed social security contributions, as is the case in the Netherlands. Finally, a co-payment system could also be considered, to introduce co-responsibility for the STW, as was proposed in Estonia, with a minimum payment for each worker benefiting from the STW, in Switzerland, where employers bore part of the social costs; or in Italy, where employers were obliged to contribute part of the subsidy after a certain period of time from the granting of the aid.
8. Evaluate the results of STW schemes. The high financial cost involved in the programme implies a very considerable increase in public expenditure, both through increased unemployment benefits for workers and through subsidies for the employers’ contributions. If sustained over long periods of time, this would generate high deficit levels. The allocation of aid granted should thus be assessed over time, always verifying the appropriateness of this action (Bělín & Veselkova Reference Bělín and Veselkova2024; Stuart et al Reference Stuart, Spencer, McLachlan and Forde2021). One of the pending issues at the labour level – at least in Spain – is the need to improve the measurement of the results of active policies in general (AIREF 2019; Arranz & García-Serrano, Reference Arranz and García-Serrano2022; Rebollo-Sanz & García-Pérez, Reference Rebollo-Sanz and García-Pérez2021), something that should be done for the TLAPs.
9. Avoid improvisation in taking measures. Some European countries used existing instruments to try to solve labour imbalances, as was the case in Spain, but others, such as the United Kingdom, had to create new schemes through very generous labour subsidies. The pandemic thus revealed the advisability of having the necessary instruments in place, provided they are negotiated with trade unions and employers. The ideal would be to have prior tripartite agreements to anticipate possible crises. The comparative analysis by country included in this research shows that in most cases – possibly due to the urgency of implementing the measures – it was not initially envisaged that trade unions or business organisations should be involved, although in practice they were involved in the design of the STW. It is therefore advisable always to include social partners in order to improve the approach.
10. Ensure the financing of STW schemes. It is necessary to have a fiscal space that allows for the availability of economic resources in the event of a generalised crisis. It would thus be advisable for the European Commission to consider this possibility in its budgets for when an economic recession, such as the one suffered during the pandemic, occurs again in the future. As has been pointed out, some countries – especially Italy and Spain – allocated a large amount of resources from European funds to finance the STW. This strong demand for resources from the European Commission contrasts with the absence of a request for European resources from Germany or France. This result highlights the different economic situation of the countries when facing this type of actions, and hence the need to foresee the creation of special funds for their implementation, especially considering that the implementation of the STW benefits workers and employers (Bělín & Veselkova Reference Bělín and Veselkova2024; Meriküll & Paulus Reference Meriküll and Paulus2023).
Conclusion
As noted above, STW schemes can be effective in mitigating the negative effects of a crisis, if they are temporary. All the studies analysed show that if the shock is temporary, the schemes can not only generally maintain employment but also seem to go towards avoiding an increase in unemployment (OECD 2020). STW schemes at the European level – like the TLAP in Spain – were one of the most widely used instruments in most European countries for dealing with the economic effects of the pandemic and especially for protecting employment. Although force majeure STW schemes have existed in Spain for more than four decades, they underwent major changes during the pandemic, operating from March 2020 until the first quarter of 2022. During the time the STW schemes were in use, the effects of COVID on the labour market were notably smaller than would have been expected for a severe crisis. Thus, data indicate that the expected growth of the unemployment rate, especially considering the significant decline in GDP, was contained. The good performance of this employment maintenance programme reveals it as an option to be considered for situations that may lead to a significant number of redundancies, although there is always room for improvement. The current design of the STW scheme has clearly been oriented towards the specific needs of the pandemic, and it is necessary to extrapolate what has been learned for future crises to improve the programme and increase its potential.
This article has analysed the role of STW schemes in several countries, and from this concludes, as stated in a series of previous investigations, that they can be useful as a temporary mechanism to avoid important increases in unemployment rates, although at the same time, they have a high cost and lose their effectiveness as their duration increases. In addition, the application of STW can generate a ‘hoarding effect’ or ‘lock-in effect’ in the allocation of human capital, due to certain types of employment in certain activities or sectors being overprotected when the employees should be transferred because of the crisis. At the same time, the effectiveness of STW is greater in the short term, since, as public aid is extended over time, the probability of returning to employment decreases. Finally, it would be advisable to be somewhat more selective in the application of the programmes and not to make them more general, unless there is an economic crisis that affects all types of sectors and activities.
Consequently, it seems reasonable to limit the operation of STW programmes to generalised economic crises and for short periods of time. Although this action applies generally to all the countries analysed, it is more relevant in those countries with high unemployment rates and where spending on unemployment benefits is already high, as is the case in Spain. For this reason, a series of economic policy recommendations have been established to improve the application of the STW for those countries that have been using this instrument, but particularly for cases such as Spain.
As the European economy is slowing down and, in some countries, even stagnating, the time is ripe to apply the lessons learned and to put in place an STW system that can be implemented when needed. European governments must learn from their best practices and have the necessary tools to cope with a sudden rise in unemployment.
Finally, it should be noted that the Spanish case provides ample support – but not strictly causal evidence – of the success of the COVID-19 STW programs in Spain. Consequently, the recommendations set out above are useful for improving the design of these programs – but always bearing in mind that they refer to potential lines of improvement of the STW program in Spain and/or to the special characteristics of the Spanish labour market – and, therefore, that they could be addressed in future reforms of this line of action.
Funding statement
Funding for open access charge Universidade de Vigo/CISUG. The author would like to acknowledge the funding received from the project ‘Adaptation and maintenance of employment in the new productive ecosystem’ of the Ministry of Science and Innovation of Spain (2022–2025).
Competing interests
There are no potential or perceived conflicts of interest.
Ethical standards
Data collection was carried out and stored in accordance with the ethical procedures of the respective universities and the funding institutions. The manuscript has not been published previously and is not currently under consideration for publication elsewhere.
Alberto Vaquero García has been professor at the Carlos III University of Madrid and Specialized Advisor to the Study Cabinet of the Economic and Social Council of the Kingdom of Spain and Advisor to the Study Cabinet of the Ministry of Education and Science. Currently associate professor and researcher in the Department of Applied Economics of the Faculty of Business Sciences and Tourism of the University of Vigo (ECOBAS-GEN research group). He has published several research articles in indexed international journals and different international ebook chapters. His main lines of research are: Education Economics, Labor Economics, Public Economics and Regional Economics.


 Open access