

A recent report concluded that households in remote rural Scotland require higher incomes to attain the same minimum acceptable living standard as those living elsewhere in the UK( Reference Hirsch, Byran and Davis 1 ). This was, in part, due to the higher cost of certain types of products and services including food. In support of this, Dawson et al.( Reference Dawson, Marshall and Taylor 2 ) reported that the average price of a basket of thirty-five ‘healthy’ products including fruits, vegetables, low-fat dairy products, and high-carbohydrate and high-protein items across Scotland was highest in rural compared with urban areas. Higher purchase costs are often reported as a perceived barrier to adopting healthier diets( Reference Drewnowski and Darmon 3 ). Healthier diets do tend to be more expensive than less healthy diets( Reference Rao, Afshin and Singh 4 ), partly because fresh fruits and vegetables (F&V), which comprise a large component of a healthy diet, are expensive compared with energy-dense, highly processed foods( Reference Maillot, Darmon and Vieux 5 ).
In addition, the availability of healthy foods may be fundamental to adopting healthier diets by consumer groups. The term ‘food deserts’ refers to areas of the country where consumers have limited access to healthier food choices( Reference Cummins, Findlay and Higgins 6 ). Although their existence in the UK has been disputed, spatial variations in access to healthy foods in terms of availability of products as well as price do exist( Reference Dawson, Marshall and Taylor 2 ). This appears to be especially true for rural areas, where the absence of retail provision can create significant difficulties for consumers to access healthy foods. In rural areas, the distance that householders have to travel for food retail shopping is greater than in urban areas( Reference McEachern and Warnaby 7 ); therefore, most rural households use their closest major supermarket to shop once weekly or once monthly, whereas local convenience stores and small shops are often considered a source of secondary shopping( Reference Scarpello, Poland and Lambert 8 ). However, access to supermarkets does generally improve the availability of healthy foods, in addition to lowering prices( Reference Cummins, Findlay and Higgins 6 , Reference Cummins, Findlay and Petticrew 9 ).
Fresh foods are defined as those that have not undergone any processing and are therefore in their raw state. Assessing access to and average prices of fresh foods is important considering that they are perceived as a healthier option compared with processed or preserved foods for a number of reasons. These include lower salt levels and potentially higher nutrient levels. Indeed, processed red meats may contain up to four times more salt than fresh meats( Reference Micha, Wallace and Mozaffarian 10 ), perhaps explaining why fresh meat consumption has a low correlation with the incidence of CVD whereas consumption of processed meat is positively linked to CVD( Reference Rohrmann, Overvad and Bueno-de-Mesquita 11 ). In addition, consumption of fresh and frozen F&V is linked to reduced risk of mortality, CVD( Reference Oyebode, Gordon-Dseagu and Walker 12 ) and cancers of the pharynx, lung, mouth, stomach and oesophagus( 13 ). Also, consumption of fish products and the marine fatty acids EPA and DHA is associated with a lower risk of CVD( Reference de Roos, Mavrommatis and Brouwer 14 ).
In the present study, therefore, we examined whether there are differences in expenditure on fresh food products generally, or on F&V and fish specifically, between urban and rural areas of Scotland. Note that, in defining fresh foods, some ‘fresh to frozen’ foods were also included where freezing was considered an essential part of harvesting and where the nutritional quality of these foods is considered similar to the unfrozen equivalent. Furthermore, we investigated whether purchasing behaviour differed according to outlet type or differences in household income or other socio-economic factors across regions.
Methods
Data from Kantar Worldpanel (KWP; www.kantarworldpanel.com/en) were used for the present investigation. The KWP includes about 3000 households in Scotland, who report food and drink purchases brought into the home. Purchases that were reported between 26 December 2011 and 23 December 2012 (364 d) were included in the analyses. Information recorded on products included barcode data, purchaser (household) code, store and product price. Data on non-barcoded items such as fresh foods were collected using barcoded show cards (photographs) and questions. Data were not included for foods consumed outside the home (such as dining out), home-grown food and food items received as gifts. UK census data and the Broadcasters’ Audience Research Panel Establishment Survey were used to define and predict demographic targets and to monitor the national representativeness of KWP. Compliance with scanning was encouraged by frequent postal, email or telephone reminders.
For each household, data on household composition, income band (sum of family income before tax), urban–rural classification (UR6) and degree of the area’s deprivation using the Scottish Index of Multiple Deprivation (SIMD) were available, with the latter two based on the households’ postcodes. The present investigation focused on entries from all Scottish households of the KWP for which an urban–rural classification was available (2576 households and 6733 people, adults plus children). Only purchases of fresh food items, which included fresh fruits, vegetables (including pre-packed salads), eggs, meats and fish, and excluded any items that were processed, tinned, bottled, smoked, salted, breaded or cooked, were selected. Some ‘fresh to frozen’ items were included if freezing was an essential part of harvesting, as were some fish and vegetable products. These included, for example, frozen prawns and fish fillets, and frozen vegetables such as peas, sweetcorn and carrots. The data set of fresh food products purchased had a total of 577 382 entries. Within this data set, 476 712 entries (83 %) related to purchases of F&V and 17 065 entries (3 %) related to purchases of fresh fish products.
Household composition within KWP varies by the number of people and their ages; therefore the amount of food needed to be bought each week will also vary. To account for this, expenditure, amount and number of packs of fresh produce were scaled by the estimated energy requirements of the household members to give equivalized values. These were estimated from the sex and age of each individual, and linked to the Dietary Reference Values for Energy( 15 ). The total estimated energy requirement for each household was calculated from the sum of the individual values per household, divided by 10·45 MJ (2500 kcal) to give an adult equivalent value.
Household location was assessed using the Scottish Government’s 6-Fold Urban–Rural Classification (UR6 1–6; Table 1). Ninety-five per cent of Scottish geographical areas are defined as rural, housing almost 19 % (13·1 % accessible rural, 5·6 % remote rural) of the population. Based on this, Scotland is classified as a mostly rural country. Annual household income was coded into categories as follows: £0–£9999 (Band 1), £10 000–£19 999 (Band 2), £20 000–£29 999 (Band 3), £30 000–£39 999 (Band 4), £40 000–£49 999 (Band 5), £50 000–£59 999 (Band 6), £60 000–£69 999 (Band 7) and £70 000+ (Band 8). The SIMD combines twenty-seven indicators across seven domains (income, employment, health, education, skills and training, housing, geographic access and crime). The overall index is a weighted sum of the seven domain scores. The domain weightings used in SIMD 2012, expressed as a percentage of the overall weight, are: current income (28 %), employment (28 %), health (14 %), education (14 %), geographic access (9 %), crime (5 %) and housing (2 %). It collects data from 6505 small areas (data zones) that cover Scotland and classifies them as most deprived (ranked 1) to least deprived (ranked 6505). In the current study, households were grouped based on their home postcode into deciles of deprivation, with those least deprived ranked 10. Life stage included: (i) household with no children; (ii) family with children aged 0–4 years; (iii) family with children aged 5–9 years; (iv) family with children aged 10+ years; (v) family with older dependants; (vi) household where all children had left recently; and (vii) retired people.
Scottish Government’s 6-Fold Urban–Rural Classification
Statistical analyses were conducted using the statistical software package IBM SPSS Statistics Version 23.0. ANOVA was used to test for differences in demographic characteristics, expenditure and amounts of foods purchased by urban–rural area classification. Kruskal–Wallis tests were used to compare the distribution of life stage, and income band, across UR6 groupings. Simple linear regression was used to test for associations between expenditure, amounts of foods and number of packs purchased as outcome variables, with urban–rural classification as the predictor variable. Microsoft® Excel 2010 pivot tables were used for descriptive data analysis. In the calculations, the total number of individuals in a household was defined as the number of adults (aged 18 years or above) plus the number of children (aged 17 years or below). Seasons were classified as winter (26 December 2011–25 March 2012), spring (26 March 2012–24 June 2012), summer (25 June 2012–23 September 2012) and autumn (24 September 2012–23 December 2012). Shopping venues were classified into major supermarket brands (ASDA, Co-op, Morrisons, Marks and Spencer, Sainsbury’s, Tesco and Waitrose), Internet (major supermarket brands), discount supermarkets (Aldi, Costco, Lidl and Iceland), corner shops and other local shops (Best One, Budgens, Costcutter, FarmFoods, Londis, Mace, Nisa Today, newsagents, off-licence shops, butchers, bakeries, fishmongers, One Stop, Premier Stores, Tesco Metro and Tesco Express, Sainsbury’s Local, market stalls and Spar) and other shops (all stores that sell non-food as a main product).
Results
Most of the reporting households (69 %) were located in urban areas (UR6 1 and UR6 2), while 12 % of households were in small towns (UR6 3 and UR6 4) and 19 % were in rural areas (UR6 5 and UR6 6; Table 2). Ten per cent of reporting households were in remote areas and had to drive for 30 min or more to a settlement of >10 000 people. UR6 1 (large urban) had the lowest number of people per household and the lowest number of children per household, whereas UR6 4 (remote small towns) had the highest number of people and children per household. The distribution of life stage was not significantly different across UR6 groups (P=0·169) or between urban and rural households (P=0·081). There was a higher proportion of households within lower income bands in rural than in more urban areas (P=0·003). On average, households in UR6 3 (accessible small towns) and UR6 5 (accessible rural areas) lived in less deprived areas, whereas households in UR6 1 (large urban) lived in more deprived areas (Table 2).
Household composition and deprivation status across urban–rural classification (UR6 1–6) among 2576 Scottish households of the Kantar Worldpanel, 26 December 2011–23 December 2012
SIMD, Scottish Index of Multiple Deprivation (1=most deprived; 10=least deprived).
Across the urban–rural categories from UR6 1 through to UR6 6, there was a significant linear increase in both weekly expenditure (in £) and amounts (in kg) of total fresh foods and F&V bought per adult equivalent (Table 3). Consequently, rural households (UR6 5 or UR6 6) recorded the highest expenditure, and bought the most amounts, of these products. Overall, expenditure on vegetables was approximately 20 % higher than that spent on fruits. Household expenditure on fish, and amount bought, were more variable and did not differ greatly between UR6 categories. This variability probably originates from the fact that not all households purchased fish products; only 68, 66, 68, 65, 73 and 74 % of households reported any fish purchases throughout the year in UR6 1 to UR6 6, respectively. Across UR6 categories, expenditure was highest on oily fish, but in general greater amounts of white fish were purchased, especially in rural households (Table 3).
Average weekly expenditure on freshFootnote * foods, fruits and vegetables (F&V) and fish, and amount and number of packs of fresh foods, F&V and fish bought, per adult equivalent, according to urban–rural classification (UR6 1–6), by 2576 Scottish households of the Kantar Worldpanel, 26 December 2011–23 December 2012
* Some ‘fresh to frozen’ products were included in the analysis where freezing was considered an essential part of harvesting and where the nutritional quality of these foods is considered similar to the unfrozen equivalent.
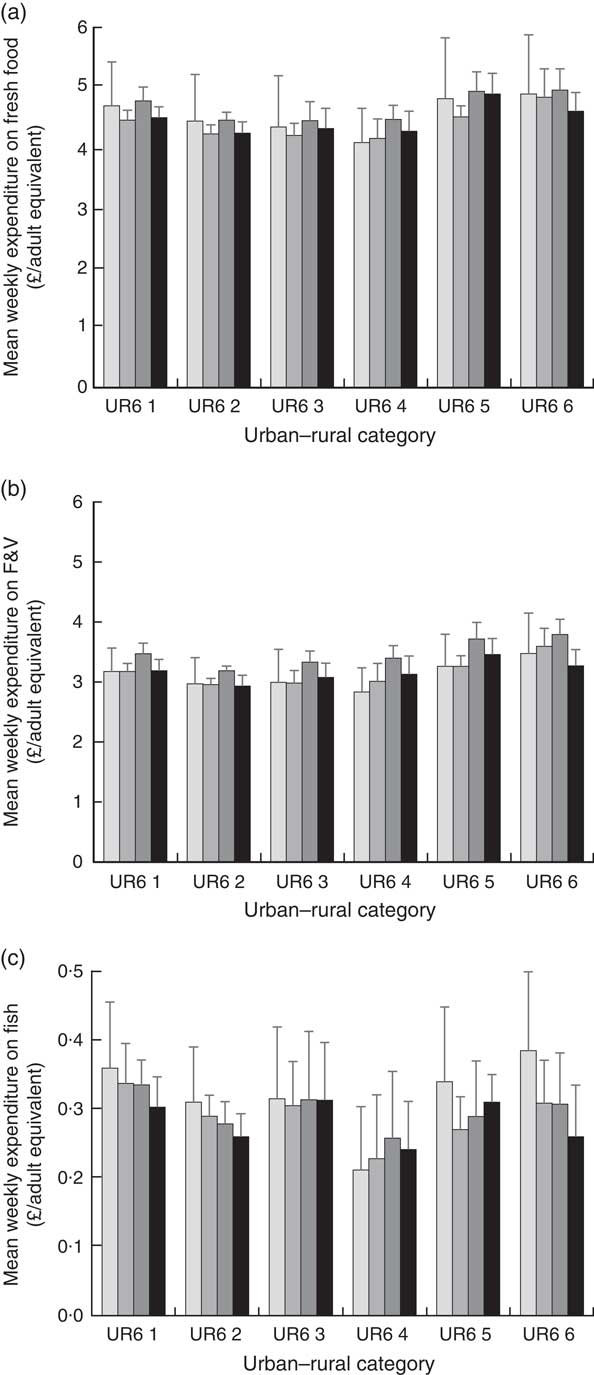
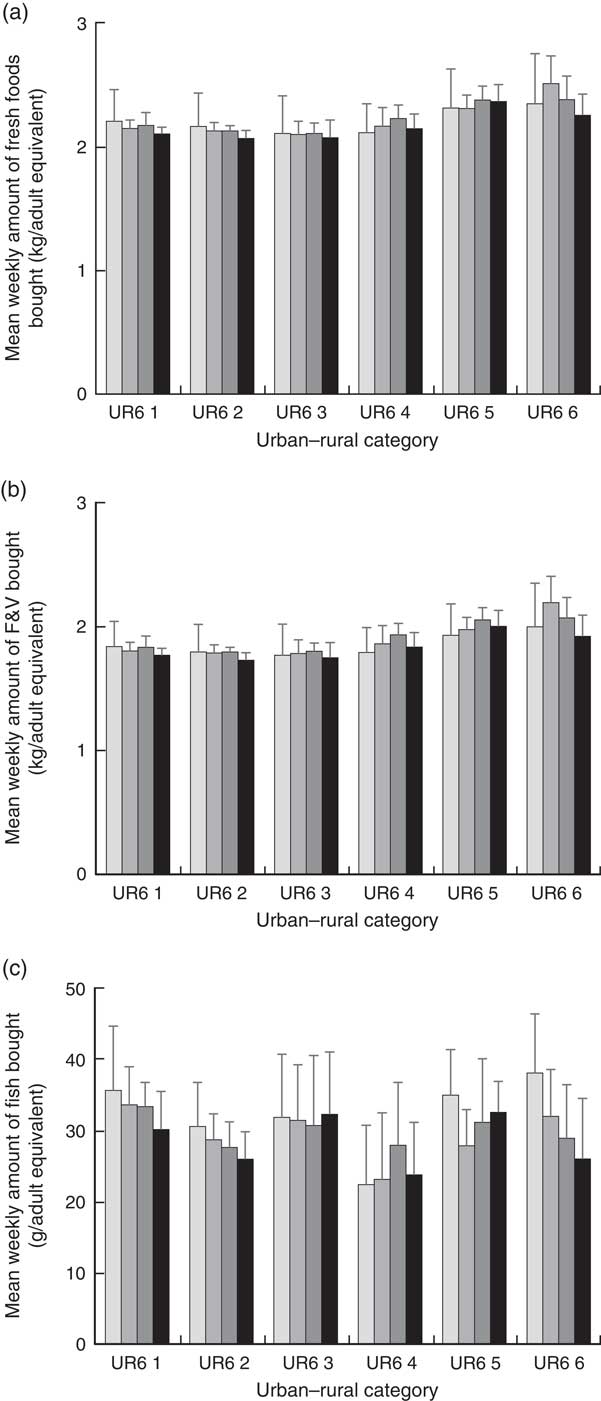
Mean per adult equivalent weekly expenditure on fresh foods, F&V and fish differed across the seasons (P=0·003, P<0·001 and P=0·011, respectively), but there was no significant interaction between season and UR6 (Fig. 1). A similar pattern was also seen for the amounts of fresh foods, F&V and fish bought (P=0·136, P=0·005 and P=0·009, respectively; Fig. 2). For the amount of fish bought there was a significant interaction between season and UR6 (P=0·036).
Average weekly expenditure (£ per adult equivalent) on fresh foods (a), fruits and vegetables (F&V) (b) and fish (c) during winter (![]() ), spring (
), spring (![]() ), summer (
), summer (![]() ) and autumn (
) and autumn (![]() ), according to urban–rural classification, by 2576 Scottish households of the Kantar Worldpanel, 26 December 2011–23 December 2012. Values are means with their standard deviations represented by vertical bars (UR6 1–6, Scottish Government’s 6-Fold Urban–Rural Classification; see Table 1 for categories)
), according to urban–rural classification, by 2576 Scottish households of the Kantar Worldpanel, 26 December 2011–23 December 2012. Values are means with their standard deviations represented by vertical bars (UR6 1–6, Scottish Government’s 6-Fold Urban–Rural Classification; see Table 1 for categories)
Average weekly amount (kilograms or grams per adult equivalent) of fresh foods (a), fruits and vegetables (F&V) (b) and fish (c) bought during winter (![]() ), spring (
), spring (![]() ), summer (
), summer (![]() ) and autumn (
) and autumn (![]() ), according to urban–rural classification, by 2576 Scottish households of the Kantar Worldpanel, 26 December 2011–23 December 2012. Values are means with their standard deviations represented by vertical bars (UR6 1–6, Scottish Government’s 6-Fold Urban–Rural Classification; see Table 1 for categories)
), according to urban–rural classification, by 2576 Scottish households of the Kantar Worldpanel, 26 December 2011–23 December 2012. Values are means with their standard deviations represented by vertical bars (UR6 1–6, Scottish Government’s 6-Fold Urban–Rural Classification; see Table 1 for categories)
Expenditure per kilogram and per item were both significantly different (P<0·001) across UR6 categories, and there were significant linear trends for decreasing expenditure per kilogram and increasing expenditure per item from large urban to remote rural areas (P<0·001). The differences were, however, quantitatively small (Table 4).
Average expenditure per kilogram and per item of freshFootnote * food, fruits and vegetables (F&V) and fish, according to urban–rural classification (UR6 1–6), by 2576 Scottish households of the Kantar Worldpanel, 26 December 2011–23 December 2012

* Some ‘fresh to frozen’ products were included in the analysis where freezing was considered an essential part of harvesting and where the nutritional quality of these foods is considered similar to the unfrozen equivalent.
The majority of fresh food, F&V and fish purchases were carried out in major supermarkets, even by households in remote rural locations (Table 5). Only the proportions of expenditure through online shopping on fresh foods and F&V differed significantly by location, with the proportion of expenditure increasing linearly from large urban to remote rural areas (P<0·001 for both). Online expenditure was quantitatively small, even by remote rural households.
Expenditure on freshFootnote * foods, fruits and vegetables (F&V) and fish per shop type, according to urban–rural classification (UR6 1–6), by 2576 Scottish households of the Kantar Worldpanel, 26 December 2011–23 December 2012
Major supermarket brands (ASDA, Co-op, Morrisons, Marks and Spencer, Sainsbury’s, Tesco and Waitrose), Internet (major supermarket brands), discount supermarkets (Aldi, Costco, Lidl and Iceland), corner shops and other local shops (Best One, Budgens, Costcutter, FarmFoods, Londis, Mace, Nisa Today, newsagents, off-licence shops, butchers, bakeries, fishmongers, One Stop, Premier Stores, Tesco Metro and Tesco Express, Sainsbury’s Local, market stalls and Spar) and other shops (all stores that sell non-food as a main product).
* Some ‘fresh to frozen’ products were included in the analysis where freezing was considered an essential part of harvesting and where the nutritional quality of these foods is considered similar to the unfrozen equivalent.
Discussion
The main finding of the current study was that households in rural areas (UR6 5 and UR6 6) reported the highest expenditure on fresh foods and F&V, compared with other regions. Purchasing patterns of fish were more variable, mainly due to smaller sample sizes as a consequence of only a subset of consumers buying fish; and therefore no clear differences in fish purchasing patterns between urban and rural areas were found. Overall, these findings are in agreement with those reported by Wrieden et al.( Reference Wrieden, Barton and Amstrong 16 ), who found a higher mean consumption of fresh F&V, oily and white fish, and fresh potatoes in individuals living in remote small towns/rural/very remote rural areas compared with more urban areas, based on expenditure and food survey data. Similarly, Levin et al.( Reference Levin, Dundas and Miller 17 ) showed that young people from rural areas reported the highest weekly intake of F&V across Scotland.
Although we found that expenditure on all fresh foods and on F&V in rural areas (UR6 5 and UR6 6) was higher compared with urban areas (UR6 1–4), this appeared to be a result of purchasing more of these food items, rather than paying more per item. Average prices per pack or average prices per kilogram across fresh food, F&V and fish purchases were quantitatively similar, although differences were statistically significant across all UR6 categories, with decreasing cost per kilogram in more rural areas (Table 4). This disagrees with findings in some previous studies. Indeed, Dawson et al.( Reference Dawson, Marshall and Taylor 2 ) found that the cost of a basket of healthy products including fruits, vegetables and fish was highest in rural v. urban locations, with costs of £46·68 and £43·60 in affluent rural and affluent urban, and £52·75 and £43·87 in deprived rural and deprived urban areas, respectively (late 2005/early 2006 prices). The discrepancy may be explained by different foods being bought by urban and rural households in the current study, which did not include a direct like-for-like price comparison. Additionally, Hirsh et al.( Reference Hirsch, Byran and Davis 1 ) recently reported that food prices were about 10 % higher in supermarkets in remote rural Scotland and considerably more than this in local stores, although this was in comparison to prices for a rural English town. The latter study also reported that remote rural households mixed supermarket shopping with local top-ups, spending 10–20 % more on a food basket compared with urban British households, while in the most remote island communities, reliance only on local stores could add over 50 % to the total food budget( Reference Hirsch, Byran and Davis 1 ). The difference between the current study and some of the older studies may be explained by the fact that most rural households now have easier access to large supermarkets, either directly or through Internet shopping, as supported by the current findings that similar levels of relative spend on fresh food items were reported in rural and urban locations. The growth of online retailing has had a profound effect on island residents in improving access to goods( Reference Freathy and Calderwood 18 ), and presumably also had a similar effect on remote rural mainland households. Indeed, 99 % of both rural and urban households in the present study reported at least some expenditure in major supermarket outlets and the percentage of shopping carried out through the Internet was two to three times higher in rural v. urban areas (Table 5). We did find, however, that rural households reported a higher amount of purchases from local shops compared with urban households, but this did not result in major differences in the average price per kilogram of fresh food bought across UR6 categories. Both the retail market and food marketing have changed significantly over the last 10 years, with an increasing number of larger supermarkets opening in various locations including out of town, making them readily available to the population, a phenomenon also reported by Clarke and Banga( Reference Clarke and Banga 19 ). This generally leads to greater price competition with lower prices, wider choices and better quality across retail outlets( Reference Cummins, Findlay and Higgins 6 , Reference Cummins, Findlay and Petticrew 9 ). Therefore, the current findings provide evidence that differences in spatial access to healthy foods, at least those concerning fresh food purchases, may have become less prevalent throughout Scotland.
We considered expenditure based on season, as availability and price may vary over a year. Indeed, many different fruits and vegetables are harvested at different times of the year( Reference Hospido, Mila and McLaren 20 ), but modern storage and transport systems now allow an almost continuous flow of produce throughout the year, at least for products such as apples, onions and lettuce( Reference Dolan and Humphrey 21 ). Other items, such as berries, are more readily available and cheaper in season( Reference Tabart, Kevers and Pincemail 22 ). Slightly higher expenditure on all fresh foods and F&V was evident in summer, across all UR6 categories, and a similar difference was also seen in greater amounts of these foods being bought during summer.
Our data do not explain why, in general, households in rural communities buy more fresh foods compared with those in urban communities. Households in urban areas tend to eat out (e.g. in restaurants or takeaway food) more than do rural households( 23 ), which is not captured in the data used in the current analyses. Therefore, rural households may be more likely to report higher amounts of foods and drinks brought into the home than urban households, even if total consumption is similar. Furthermore, a study by Sayer( Reference Sayer 24 ) indicated that an older population in rural areas has a higher consumption of fresh products as well as having more time for cooking, which may contribute towards a higher household expenditure for fresh foods. However, in the current study, the distribution of household life stage was not greatly different in the rural v. the other UR6 categories. There may be differences between urban and rural households in the contribution of home-grown fresh food to the diet, although in the UK, in 2012, this together with all other sources of free food (such as gifts) averaged only 2·7 % of all fresh F&V entering the home. Free eggs contributed 5·0 % of the total amount of eggs( 23 ).
There was a higher proportion of households within lower income bands in rural than more urban areas, yet expenditure on fresh foods and F&V was higher per person in rural areas. This is in contrast to the observation of Pateman( Reference Pateman 25 ) that high-income households residing in rural Britain spent the most on fresh healthy foods, and other studies reporting a positive correlation between higher socio-economic background and highest expenditure on fresh foods( Reference French, Wall and Mitchell 26 ). However, comparisons between studies should be based on the use of equivalized income values (i.e. household incomes that are adjusted for household size and composition), rather than income bands as used by KWP. Indeed, a higher household income band recorded by KWP does not necessarily mean more money being available per person for buying food. Multiple studies have investigated how deprivation shapes accessibility, availability and affordability of F&V( Reference Ball, Timperio and Crawford 27 – Reference Pearce, Hiscock and Blakely 30 ). Cummins and Macintyre( Reference Cummins and Macintyre 31 ) pioneered research into deprivation and food accessibility in Scotland and since then a growing body of literature has supported the correlation between deprivation and food accessibility( Reference Morland, Wing and Diez 32 , Reference Shohaimi, Welch and Bingham 33 ), although some other studies have found the opposite trend, i.e. greater healthy food availability in more deprived areas( Reference Black, Ntani and Kenny 28 , Reference Sauveplane-Stirling, Crichton and Tessier 34 ). The most recent estimation of food intake from food purchase data in Scotland (2010–2012)( Reference Wrieden and Barton 35 ) shows a clear gradient in F&V consumption by SIMD quintile: in the most deprived quintile, mean daily consumption was 205 g/d compared with 311 g/d in the least deprived quintile across 2010 to 2012. Consumption of oil-rich fish was also highest in the least deprived quintile with mean consumption of 39·2 g/week compared with 19·0 g/week in the most deprived. However, this difference was due to fewer consumers of oil-rich fish in the most deprived quintile, rather than lower intakes by consumers( Reference Wrieden and Barton 35 ). Our data indicate that the majority of consumers have access to fresh foods generally, and to F&V and fish specifically. Therefore, lower purchasing levels may be determined more by food choice (including differences in the amount of food eaten outside the home) and affordability (as lower-income households spend a greater proportion of their income on food than do more affluent households), than by availability and differences in price faced by consumers.
Limitations
The present study is subject to a number of limitations. The KWP may differ to some extent from the general population as they report lower household incomes, are more likely to be middle-aged and have a greater proportion of multiple-adult households compared with households participating in the Living Costs and Food Survey( 36 ). Also, there is evidence that not all food purchases that are brought into the home are recorded by panel members, with fruit and fish the food groups appearing to be particularly affected, when compared with reporting in the Living Costs and Food Survey( 36 ). Therefore, the amounts of produce reported are likely to be underestimates across the UR6 categories.
Conclusions
In conclusion, the current study showed that access to, and average price of, fresh foods in general, and of fruits, vegetables and fish in particular, are broadly similar between households living in urban and rural areas. It was found that households in rural areas (UR6 5 and UR6 6) spent the most and bought the most amounts of fresh food products, among which are F&V and fish. Intervention policies to increase consumption of fresh foods should therefore be targeted mostly at large urban areas and accessible small towns (UR6 1 and UR6 3), where the lowest purchases of fresh food products occur.
Acknowledgements
Financial support: This work was supported by the Scottish Government’s Rural and Environment Science and Analytical Services (RESAS) Division. RESAS had no role in the design, analysis or writing of this article. Conflict of interest: The authors declare that they have no conflicts of interest. Kantar Worldpanel had no role in study design or data analysis. Authorship: All authors contributed to the coding of the database. B.d.R., F.B. and S.W. contributed to the analyses in SPSS and Excel. All authors contributed to the writing of the manuscript. Ethics of human subject participation: Not applicable.


