


1 Introduction
Laser-driven ion acceleration has achieved substantial advancements over the last two decades with the development of ultra-intense ultra-fast lasers based on chirped-pulse amplification technology[ Reference Strickland and Mourou1– Reference Danson, Haefner, Bromage, Butcher, Chanteloup, Chowdhury, Galvanauskas, Gizzi, Hein, Hillier, Hopps, Kato, Khazanov, Kodama, Korn, Li, Li, Limpert, Ma, Nam, Neely, Papadopoulos, Penman, Qian, Rocca, Shaykin, Siders, Spindloe, Szatmári, Trines, Zhu, Zhu and Zuegel4]. Utilizing PW-class laser facilities, high-energy proton beams with energies up to 150 MeV have been generated[ Reference Ziegler, Göthel, Assenbaum, Bernert, Brack, Cowan, Dover, Gaus, Kluge, Kraft, Kroll, Metzkes-Ng, Nishiuchi, Prencipe, Püschel, Rehwald, Reimold, Schlenvoigt, Umlandt, Vescovi, Schramm and Zeil5] via relativistically induced transparency (RIT). Compared with the traditional accelerator, the intense lasers can accelerate high-flux and ultra-fast ion sources at a high acceleration gradient, which has wide application prospects in, for example, medical therapy[ Reference Malka, Fritzler, Lefebvre, d'Humières, Ferrand, Grillon, Albaret, Meyroneinc, Chambaret, Antonetti and Hulin6, Reference Bulanov, Wilkens, Esirkepov, Korn, Kraft, Kraft, Molls and Khoroshkov7], proton imaging[ Reference Borghesi, Campbell, Schiavi, Haines, Willi, MacKinnon, Patel, Gizzi, Galimberti, Clarke, Pegoraro, Ruhl and Bulanov8], nuclear physics[ Reference Tabak, Hammer, Glinsky, Kruer, Wilks, Woodworth, Campbell, Perry and Mason9, Reference Roth, Cowan, Key, Hatchett, Brown, Fountain, Johnson, Pennington, Snavely, Wilks, Yasuike, Ruhl, Pegoraro, Bulanov, Campbell, Perry and Powell10] and laboratory astrophysics[ Reference Huntington, Fiuza, Ross, Zylstra, Drake, Froula, Gregori, Kugland, Kuranz, Levy, Li, Meinecke, Morita, Petrasso, Plechaty, Remington, Ryutov, Sakawa, Spitkovsky, Takabe and Park11]. Many of these applications require high-quality ion beams, which the ion sources obtained in experiments still cannot meet.
Several laser-proton acceleration schemes have been proposed to produce high-quality ion sources, including target normal sheath acceleration (TNSA)[ Reference Wilks, Langdon, Cowan, Roth, Singh, Hatchett, Key, Pennington, MacKinnon and Snavely12], radiation pressure acceleration (RPA)[ Reference Shen and Xu13, Reference Esirkepov, Borghesi, Bulanov, Mourou and Tajima14], collisionless electrostatic shock acceleration[ Reference Silva, Marti, Davies, Fonseca, Ren, Tsung and Mori15, Reference Zhang, Shen, Wang, Zhai, Li, Lu, Li, Xu, Wang, Liang, Leng, Li and Xu16] and Coulomb explosion[ Reference Krushelnick, Clark, Najmudin, Salvati, Santala, Tatarakis, Dangor, Malka, Neely, Allott and Danson17]. Among these, TNSA is the most extensively studied scheme[ Reference Dover, Nishiuchi, Sakaki, Kondo, Lowe, Alkhimova, Ditter, Ettlinger, Faenov, Hata, Hicks, Iwata, Kiriyama, Koga, Miyahara, Najmudin, Pikuz, Pirozhkov, Sagisaka, Schramm, Sentoku, Watanabe, Ziegler, Zeil, Kando and Kondo18], where the laser energy is first absorbed by front-side electrons; relativistic electrons then penetrate through the target and form the TV/m electrostatic field at the rear side, which finally accelerates protons and ions. Compared with other advanced schemes, such as RPA requiring extreme laser and target conditions, TNSA is much easier to implement and can provide a more robust proton source. Meanwhile, PW and even 10 PW laser facilities, for example, ELI[ Reference Lureau, Laux, Casagrande, Chalus, Pellegrina, Matras, Radier, Rey, Ricaud, Herriot, Jougla, Charbonneau, Duvochelle and Simon-Boisson19] and Shanghai Superintense Ultrafast Laser Facility (SULF)[ Reference Li, Gan, Yu, Wang, Liu, Guo, Xu, Xu, Hang, Xu, Wang, Huang, Cao, Yao, Zhang, Chen, Tang, Li, Liu, Li, He, Yin, Liang, Leng, Li and Xu20], exist all around the world. Therefore, combining the TNSA regime with the multi-PW laser may pave a potential way for future application of the laser-driven proton source.
In TNSA, the laser prepulse plays an important role in ion acceleration[ Reference Neely, Foster, Robinson, Lindau, Lundh, Persson, Wahlström and McKenna21– Reference Gizzi, Boella, Labate, Baffigi, Bilbao, Brandi, Cristoforetti, Fazzi, Fulgentini, Giove, Koester, Palla and Tomassini34]. In physical essence, the prepulse will significantly influence the preplasma distribution at the target surfaces and in turn determine the physical process of ion acceleration. Many works investigating the prepulse effect on TNSA have been reported. At the early stage, it is popularly believed that the intense prepulse[ Reference Neely, Foster, Robinson, Lindau, Lundh, Persson, Wahlström and McKenna21, Reference Kaluza, Schreiber, Santala, Tsakiris, Eidmann, Meyer-ter-Vehn and Witte22, Reference Wang, Shen, Zhang, Xu, Li, Lu, Wang, Liu, Lu, Shi, Leng, Liang, Li, Wang and Xu25] is adverse for ion acceleration, since large rear preplasma would smooth the amplitude of the sheath field[ Reference Levy, Nuter, Ceccotti, Combis, Drouin, Gremillet, Monot, Popescu, Reau, Lefebvre and Martin30] and obstruct particle transmission[ Reference Lundh, Lindau, Persson, Wahlstrom, McKenna and Batani31]. For example, Kaluza et al. [ Reference Kaluza, Schreiber, Santala, Tsakiris, Eidmann, Meyer-ter-Vehn and Witte22] utilized 5 TW lasers with different prepulse durations irradiating micrometre-thick targets at the intensity of 1019 W/cm2, and found that the optimal target thickness strongly depended on the prepulse duration, attributed to the effect induced by rear preplasma. As understanding deepens, it is experimentally demonstrated that the small prepulse should be beneficial considering that the front preplasma would increase the laser absorption[ Reference Antici, Fuchs, d’Humières, Robiche, Brambrink, Atzeni, Schiavi, Sentoku, Audebert and Pepin28], induce the self-focusing effect of the laser beam[ Reference McKenna, Carroll, Lundh, Nurnberg, Markey, Bandyopadhyay, Batani, Evans, Jafer, Kar, Neely, Pepler, Quinn, Redaelli, Roth, Wahlstrom, Yuan and Zepf32] and enhance hot electron generation[ Reference Seo, Yoo and Hahn29, Reference Gizzi, Boella, Labate, Baffigi, Bilbao, Brandi, Cristoforetti, Fazzi, Fulgentini, Giove, Koester, Palla and Tomassini34]. For example, Mckenna et al. [ Reference McKenna, Carroll, Lundh, Nurnberg, Markey, Bandyopadhyay, Batani, Evans, Jafer, Kar, Neely, Pepler, Quinn, Redaelli, Roth, Wahlstrom, Yuan and Zepf32] employed a 100 TW main laser with intensity of 3 × 10²⁰ W/cm2 and an ‘ablation’ laser as a prepulse to study the effect of the front preplasma, and found that a prepulse with intensity of 0.5 TW/cm2 would generate the optimal front preplasma for proton acceleration. Schollmeier et al.[ Reference Schollmeier, Sefkow, Geissel, Arefiev, Flippo, Gaillard, Johnson, Kimmel, Offermann, Rambo, Schwarz and Shimada33] investigated the effect of ps-scale prepulses by using two separate laser facilities with peak power of around a 100 TW laser and intensity of 2 × 10²⁰ W/cm2, and found that the maximum energy of protons can vary from 45 to 75 MeV due to ps-scale prepulse variations. However, the previous studies mentioned above were conducted with lasers of peak power below PW and intensity of much less than 1021 W/cm2. Whether the concept of the prepulse effect on TNSA can be applied to multi-PW lasers with intensity exceeding 1021 W/cm2 remains unknown. Therefore, for future applications of TNSA-driven proton sources, a systematic experimental research on the effect of prepulses utilizing multi-PW lasers with higher intensity is essential.
Here, we present an experimental study on the effect of preplasma on laser-driven proton acceleration at the SULF facility[ Reference Li, Gan, Yu, Wang, Liu, Guo, Xu, Xu, Hang, Xu, Wang, Huang, Cao, Yao, Zhang, Chen, Tang, Li, Liu, Li, He, Yin, Liang, Leng, Li and Xu20]. The peak laser intensity on target is 1.2 × 10²¹ W/cm2 when the SULF laser interacts with micrometre-thick copper foils, while the parameters of the laser prepulse are varied with three different cases of low-contrast ratio, moderate-contrast ratio and high-contrast ratio. For the 4-μm copper foil, the different laser prepulse cases result in proton cutoff energies of 23.6, 58.9 and 43.2 MeV, respectively. One-dimensional (1D) hydrodynamic simulation and two-dimensional (2D) particle-in-cell (PIC) simulations are carried out to explain the experimental results, and show that the front preplasma induced by the laser prepulse enhances electron acceleration and in turn improves proton acceleration, while the rear preplasma weakens the sheath field and is unfavourable for ion acceleration. The moderate-contrast laser can generate a strong sheath field due to high-temperature electrons and the small influence of the rear preplasma. This work fills the knowledge gap of the physical mechanism of preplasma effects on TNSA driven by multi-PW, 1021 W/cm2 lasers. Meanwhile, this work also gives a concrete map showing both saturation of the beneficial effect from the front preplasma and monotonic penalty from the rear preplasma, which sheds light on the effect of preplasma and is practical for other TNSA experiments at the PW scale to accelerate high-energy protons. These results show that the prepulse effect on TNSA has been experimentally demonstrated by using a multi-PW femtosecond laser with intensity exceeding 1021 W/cm2, which is important for future applications.
2 Experiment and results
The experiment is carried out on SULF lasers with a central wavelength of 800 nm, on-target laser energy of 63 ± 5 J and pulse duration of 30 fs (full width at half maximum, FWHM). The p-polarized laser pulse is focused onto targets via an f/4 off-axis parabola mirror at an incident angle of 15°. The FWHM size of the focal spot is 7.38 μm × 6.27 μm, containing 21% of the total laser energy. The focused peak laser intensity reaches 1.2 × 10²¹ W/cm2. A schematic of the experimental setup is shown in Figure 1(a). The targets used in the experiment are copper foils with thicknesses from 1 to 30 μm. The accelerated protons are detected at the target normal direction with stacks of radiochromic film (RCF) and a Thomson parabola (TP) spectrometer in sequence. The RCF stacks of 50 mm × 50 mm with a 3-mm-diameter hole in the centre to let protons pass through are placed 5.5 cm away from the target and enwrapped by a 15-μm-thickness Al foil to shield debris. Aluminium sheets of different thicknesses are inserted between RCFs to attenuate proton energies. The TP is composed of a 5-cm-length permanent magnet and a pair of 15-cm-length electrodes, supplying a magnetic field of 1 T and a voltage of 10 kV, respectively. A pinhole with a diameter of 150 μm is placed in front of the TP spectrometer, corresponding to a solid angle of 2.3 × 10⁻⁸ sr. The energy resolution for protons is 0.4 MeV at 100 MeV, with a lower detection threshold of 3.5 MeV.
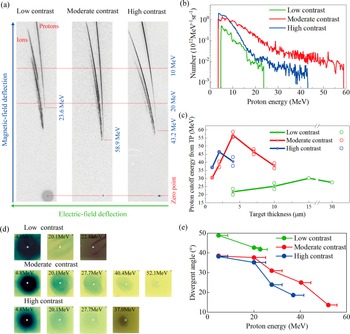
(a) Schematic of the experimental setup. In the target normal direction, RCF stacks and a TP spectrometer are used to detect both profiles and energy spectra of the laser-accelerated protons. A plasma mirror is optional in the moderate-contrast case, which can further improve the temporal contrast to achieve the high-contrast case. The temporal contrast ratios of the nanosecond (b) and picosecond (c) scales are measured by a photodiode and a third-order cross-correlator, respectively. Green and red lines represent the low-contrast and moderate-contrast cases, respectively. The background is about 10–11 with the fluctuation from 3 × 10–12 to 7 × 10–11, which is framed by the dotted box in (c); the peak beyond this value region is considered as a prepulse.
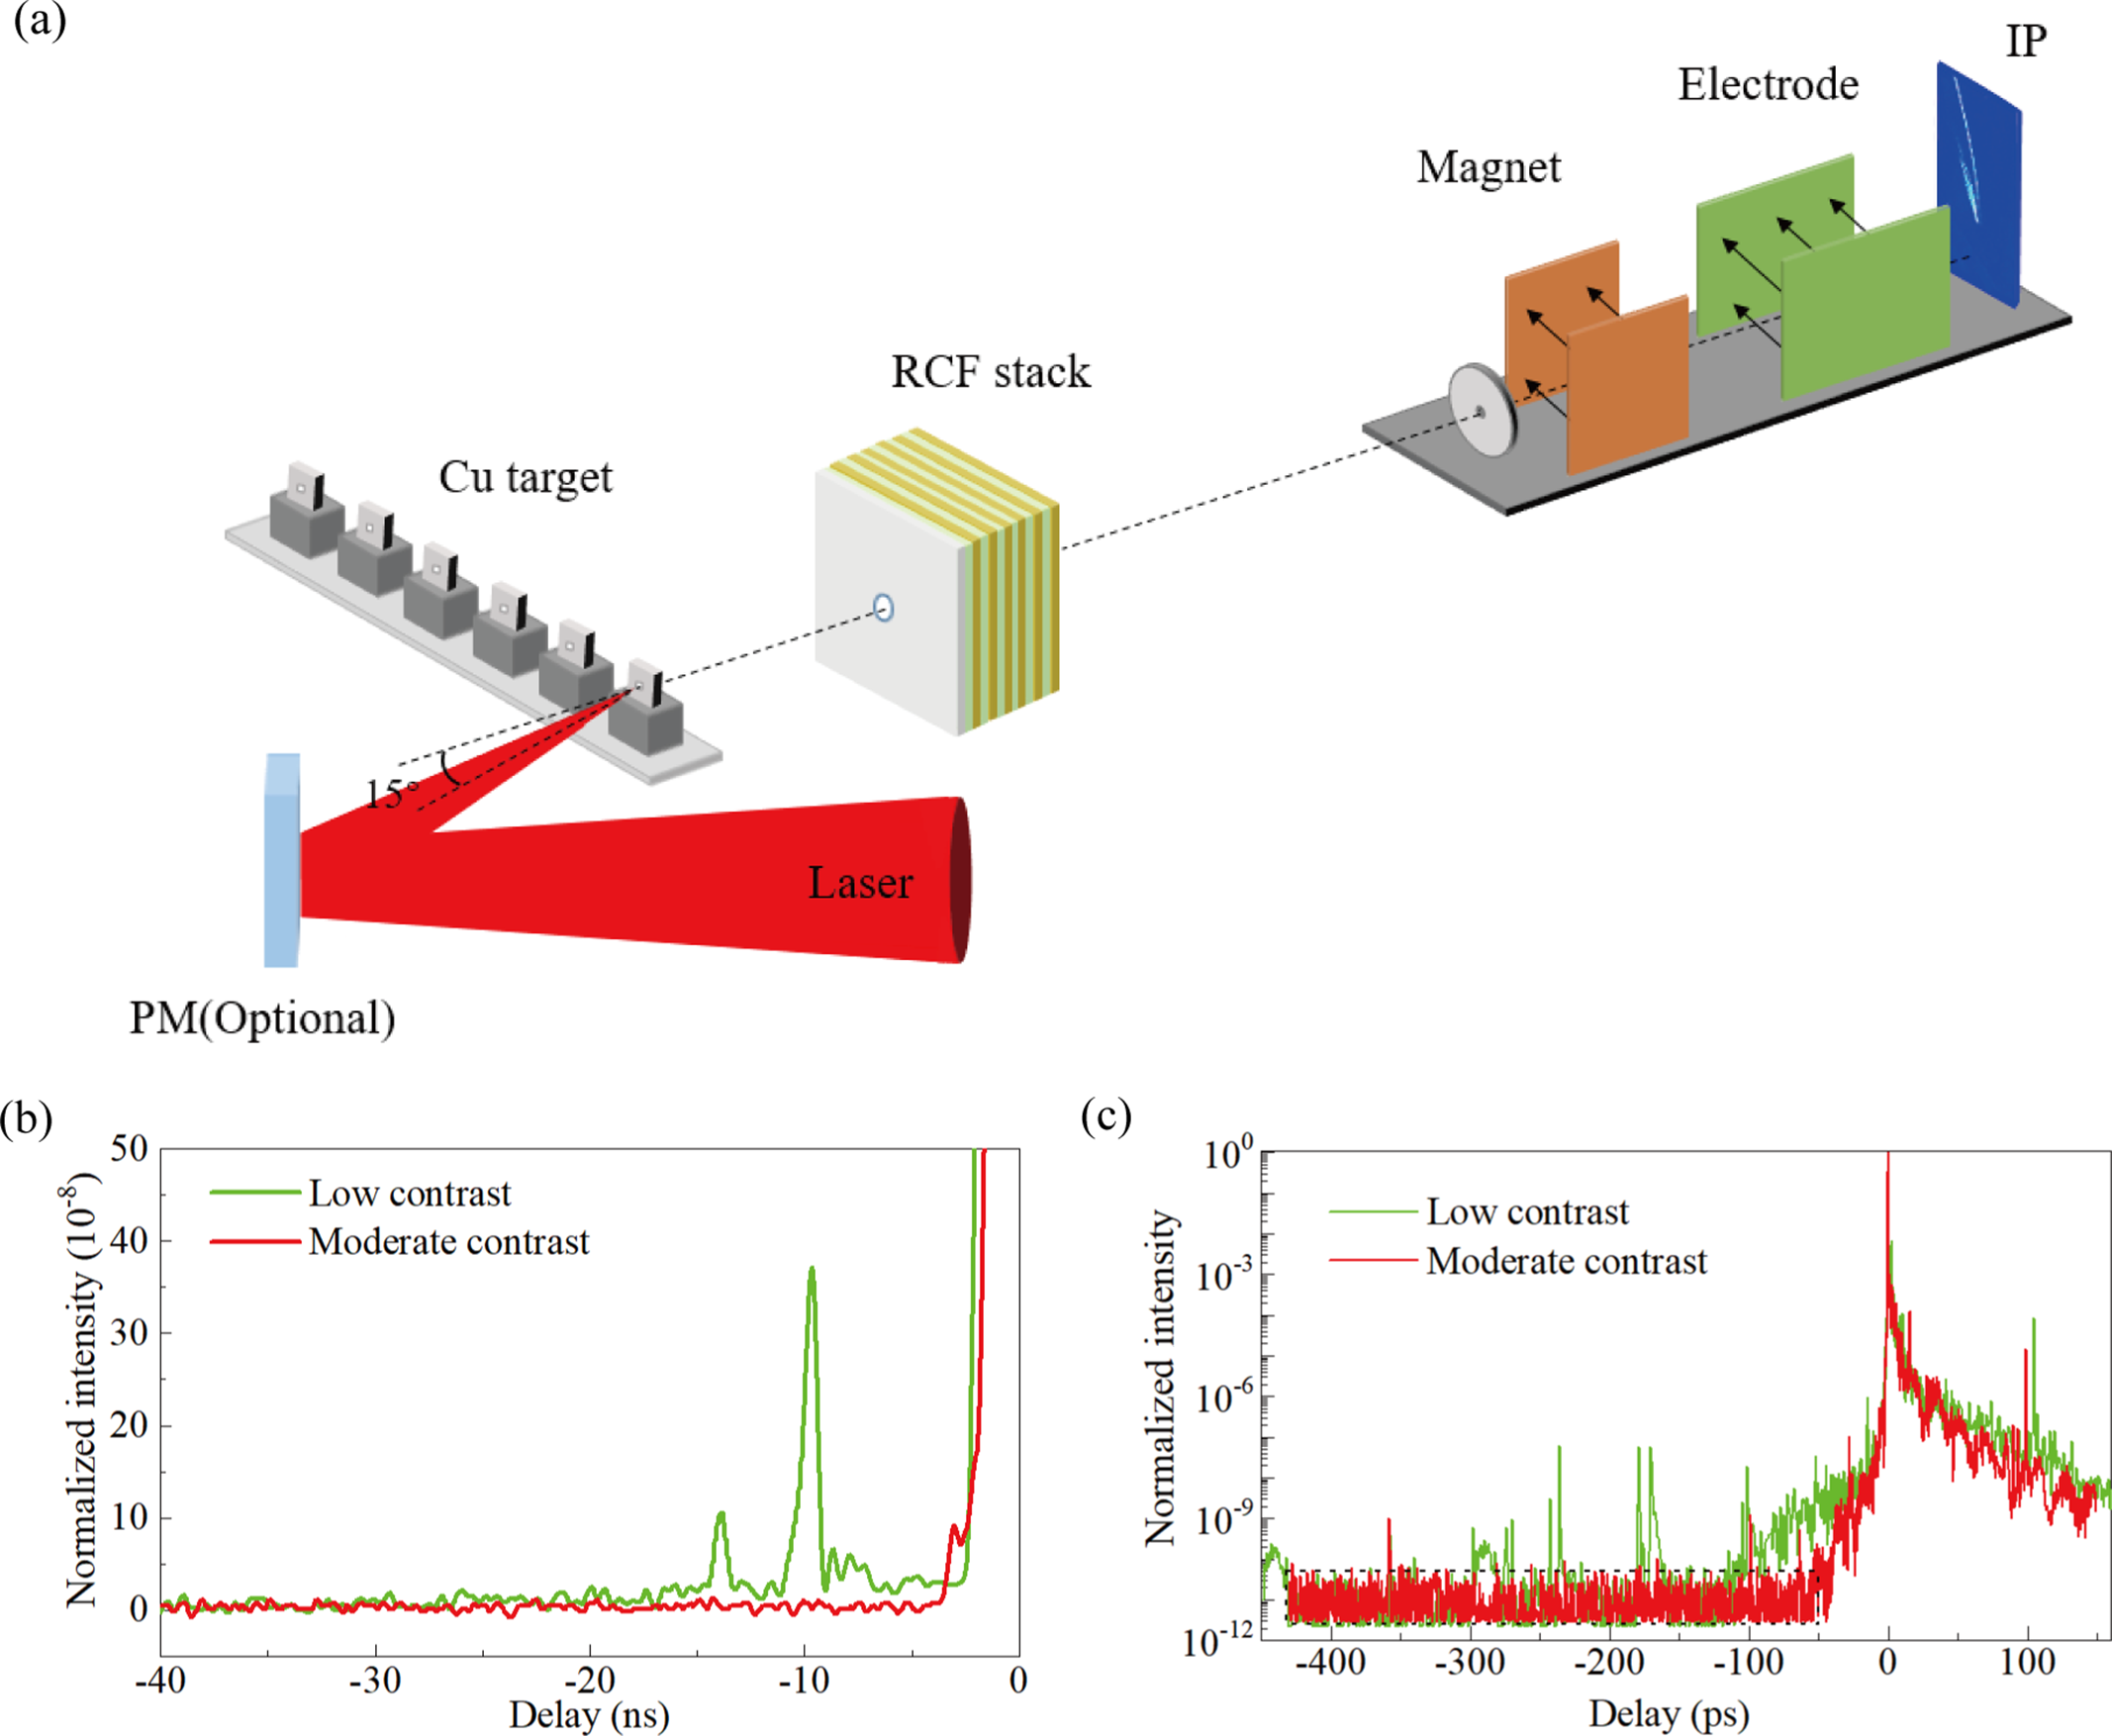
To study the effect of the laser prepulse on proton acceleration, three different cases of laser contrast are used in the experiment, ‘low-contrast’, ‘moderate-contrast’ and ‘high-contrast’. The temporal contrast ratios of both low-contrast and moderate-contrast cases are shown in Figures 1(b) and 1(c), which at the nanosecond (Figure 1(b)) and picosecond (Figure 1(c)) scales are measured by a photodiode and a third-order cross-correlator, respectively. The lower detection limits of the photodiode and third-order cross-correlator in our experiment are about 10–8 and 10–11, respectively. The response time of the photodiode is around a nanosecond, resulting in the rapid rising shown in Figure 1(b). For the low-contrast case, there are many strong prepulses at both the nanosecond and picosecond scales. To obtain the moderate-contrast case, various methods are used to optimize the laser contrast. The scattering noise of the Ti:sapphire (Ti:Sa) crystal is the main cause of nanosecond prepulses, which is suppressed via an optimized multi-pass amplifier configuration[ Reference Wang, Bai, Liu, Zhang, Tang, Wang, Zhang, Fan, Yao, Sun, Wu, Zhang, Gan, Yu, Wang, Lu, Xu, Liang and Leng35]. Meanwhile, the multiple reflections of the optical components induce picosecond prepulses, which are improved utilizing the combination of cross-polarized wave generation (XPWG) and femtosecond optical parametric amplification (OPA) techniques[ Reference Li, Qin, Zhang, Li, Fan, Wang, Xu, Wang, Yu, Xu, Liu, Wang, Wang, Zhang, Liu, Bai, Gan, Zhang, Wang, Fan, Sun, Tang, Yao, Liang, Leng, Shen, Ji, Li and Xu36]. It can be clearly seen that for the moderate-contrast case, the laser contrast after optimization is significantly improved, with the main prepulses at both the nanosecond and picosecond scales removed. Furthermore, on the basis of the moderate-contrast case, a single plasma mirror (PM) is used to further improve the temporal contrast ratio[ Reference Jiang, Zhang, Dong, Shi, He, Hao, Sun, Gui, Qian, Zhu, Wang, Xu, Liang, Leng and Li37] and achieve the high-contrast case. The PM is made of antireflection-coated fused silica, with the on-PM laser intensity of 2.9 × 10¹⁵ W/cm2 and incident angle of 22.5°. The laser reflectivity at the optimal PM position is measured to be 70%. Considering the energy loss of the main laser pulse induced by the PM, the laser energy for the high-contrast case is adjusted to ensure the on-target energy and intensity matching the low-contrast and moderate-contrast cases, which is 1.4 times that of the other case. For the three cases, the only variation is the laser prepulse, while the other parameters of the main laser pulse (pulse duration, laser energy and focal spot) are the same based on the measurement of every shot.
The experimental results are shown in Figure 2. As mentioned above, two methods are used to detect the properties of protons: the TP spectrometer results are shown in Figures 2(a)–2(c) and the RCF results shown in Figures 2(d) and 2(e). Figure 2(a) shows the raw image plate (IP) data for the target thickness of 4 μm. The traces of protons and ions are recorded in IPs, the energy spectra of which are calculated based on the parameters of the electric and magnetic fields. The calculated proton energy spectra are shown in Figure 2(b), showing the broad energy spread distribution with the proton cutoff energies of 23.6, 58.9 and 43.2 MeV for the low-contrast, moderate-contrast and high-contrast cases, respectively. For the moderate-contrast case, the proton cutoff energy is 36% higher than that of the high-contrast case and 150% higher than that of the low-contrast case, and also has the highest proton number (>10 MeV). It is reasonable that the proton energy is significantly enhanced by optimizing the laser prepulse condition from the low-contrast case to the moderate-contrast case, as previously reported in Refs. [Reference Neely, Foster, Robinson, Lindau, Lundh, Persson, Wahlström and McKenna21,Reference Kaluza, Schreiber, Santala, Tsakiris, Eidmann, Meyer-ter-Vehn and Witte22,Reference Wang, Shen, Zhang, Xu, Li, Lu, Wang, Liu, Lu, Shi, Leng, Liang, Li, Wang and Xu25]. However, using a single PM to further improve the contrast ratio shows a negative effect for proton acceleration, which has seldom been reported heretofore. The underlying physics will be further studied in the following text. The proton cutoff energy varying with the target thickness is also studied, as shown in Figure 2(c). For the low-contrast, moderate-contrast and high-contrast cases, the optimal target thicknesses are 15, 4 and 2 μm, respectively, where the moderate-contrast condition also produces the highest proton cutoff energy. On the one hand, the existence of optimal thickness can be attributed to the combination effects of electron divergence[ Reference Schreiber, Bell, Gruner, Schramm, Geissler, Schnurer, Ter-Avetisyan, Hegelich, Cobble, Brambrink, Fuchs, Audebert and Habs38], electron reflux[ Reference Mora39] and preplasma expansion[ Reference Sentoku, Cowan, Kemp and Ruhl40]. On the other hand, the optimal thickness strongly depends on the prepulse, such that the weaker the prepulse, the smaller the optimum target thickness.
(a) The raw IP data of the TP spectrometer from shots of 4-μm Cu foils for different contrast ratio cases. (b) The proton spectra obtained from the IP data in (a). Green, red and blue lines represent the low-contrast, moderate-contrast and high-contrast cases, respectively. (c) The proton cutoff energy as a function of the target thickness. The hollow circle represents the proton energy of each shot and the solid circle represents the average proton energy. (d) The proton profiles of selected RCF stacks from shots of 4-μm Cu foils. (e) The divergent angle of proton beams as a function of proton energy measured by the RCF stacks in (d). The error bars are defined by the energy interval between adjacent RCF layers.
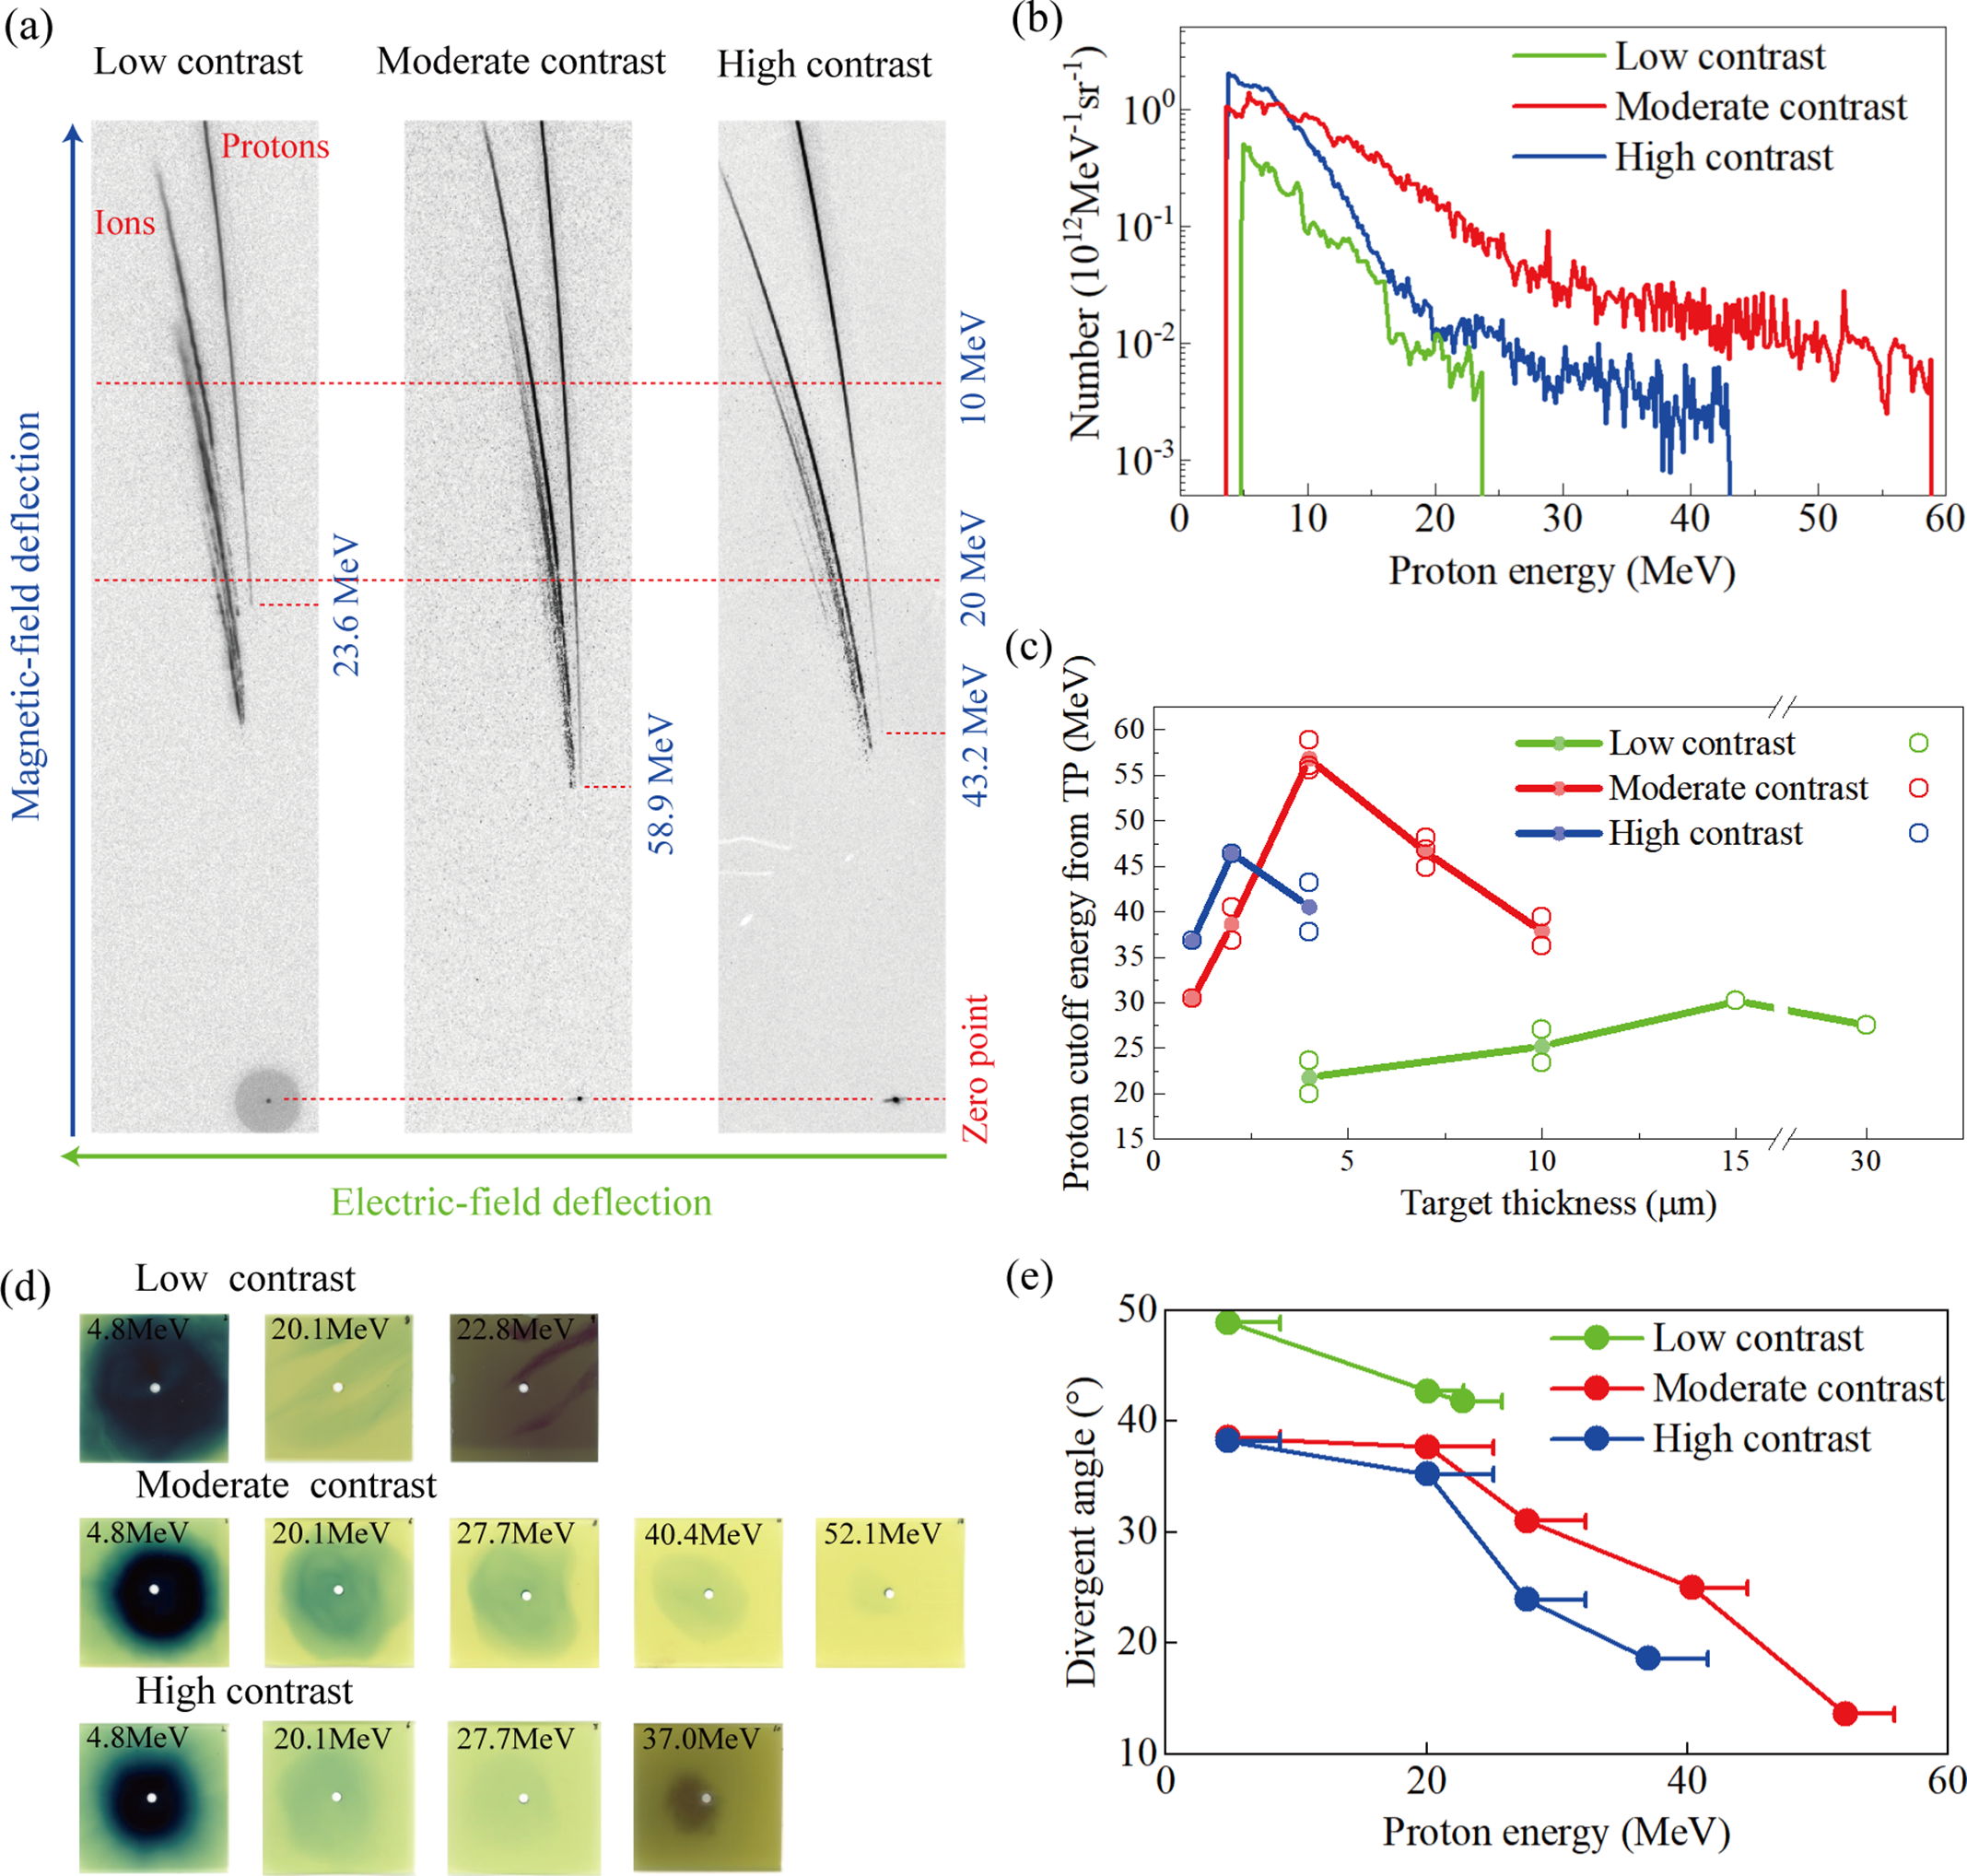
The selected layers of RCF stacks from shots of 4-μm foils are shown in Figure 2(d), displaying the proton profiles. The proton cutoff energies detected by RCF are 22.8, 52.1 and 37.0 MeV for the low-contrast, moderate-contrast and high-contrast cases, respectively, slightly lower than those detected by the TP spectrometer. This should be mainly attributed to the large interval of energy measurement between adjacent RCF layers. The proton spectra are calculated from the RCF data of Figure 2(d) (seen in Figure S1 of the Supplementary Material), showing the broad energy spread distribution, which is consistent with the TP spectrometer data. The proton numbers are 0.71×10¹², 1.28×10¹² and 0.62×10¹², corresponding to CEs of 1.8%, 4.1% and 1.6% for the low-contrast, moderate-contrast and high-contrast cases, respectively (the saturated RCFs are excluded and protons with energy of more than 7.2 MeV are counted). The divergent angles of protons with different energies are analysed based on RCF data, and calculated as tan(θ/2) = D/2L, where D is the diameter of proton profiles and L is the distance between the target and the RCF. As the proton energy becomes higher, the divergent angle becomes smaller due to a decrease in size of the emission region near the peak of the Gaussian-shaped electron sheath[ Reference Borghesi, Fuchs, Bulanov, Mackinnon, Patel and Roth41, Reference Cowan, Fuchs, Ruhl, Kemp, Audebert, Roth, Stephens, Barton, Blazevic, Brambrink, Cobble, Fernández, Gauthier, Geissel, Hegelich, Kaae, Karsch, Le Sage, Letzring, Manclossi, Meyroneinc, Newkirk, Pépin and Renard-LeGalloudec42]. For the 4.8 MeV protons, the divergent angles are 48.9°, 38.5° and 38.2° for the low-contrast, moderate-contrast and high-contrast cases, respectively. The divergent angle of the low-contrast case is much larger, while those of the moderate-contrast and high-contrast cases seem quite similar. For the high-energy protons (>27.7 MeV), the high-contrast laser results in lower-divergent protons compared with the moderate-contrast case.
3 Simulation and discussion
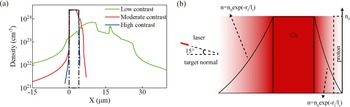
As mentioned above, both the TP spectrometer and RCF stack results indicate that the moderate-contrast laser can improve the proton acceleration in the TNSA scheme compared with the low-contrast and high-contrast cases. To better analyse the effect of preplasma on proton acceleration, 1D hydrodynamic and 2D PIC simulations are conducted sequentially. The 1D hydrodynamic simulation can simulate the interaction between the laser prepulse and initial foils and thus obtain the distribution of the preplasma before the arrival of the main laser with MULTI-1D code[ Reference Ramis and Meyer-ter-Vehn43, Reference Ramis, Meyer-ter-Vehn and Ramírez44], which can calculate the physical processes of radiation transmission, Lagrangian fluid dynamics, heat conduction and beam deposition. The initial target is a Cu foil without a contamination layer. For the low-contrast and moderate-contrast cases, the prepulses illustrated in Figures 1(b) and 1(c) are used along with the rising edges of the main pulse. For the high-contrast case, the imported prepulse is two orders lower than that of the moderate-contrast case[ Reference Jiang, Zhang, Dong, Shi, He, Hao, Sun, Gui, Qian, Zhu, Wang, Xu, Liang, Leng and Li37]. The starting times relative to the peak of the laser pulse in the 1D hydrodynamic simulation are 14 ns for the low-contrast case and 3 ns for moderate-contrast and high-contrast cases. The detailed input prepulse used in 1D hydrodynamic simulation is shown in Figure S2 of the Supplementary Material. The 1D hydrodynamic simulations end at 5 ps before the peak of the main pulse. For the initial target of the 4-μm copper foil, the zoom-in illustrations of the preplasma distributions for different prepulse cases before the main pulse reaches the target are simulated and shown in Figure 3(a), while the complete density distribution is shown in Figure S3 of the Supplementary Material. The density distributions of the preplasma can be described as n 0exp(–r/l)[ Reference Wang, Shen, Zhang, Xu, Li, Lu, Wang, Liu, Lu, Shi, Leng, Liang, Li, Wang and Xu25], where r represents the distance from the corresponding surface and l represents the scale length of the preplasma. Via exponential curve fitting the data of densities of more than 0.1n c (n c is the critical plasma density of 1.72 × 1021 cm–3 for the laser wavelength of 800 nm), the scale lengths of preplasma can be obtained as 4.9–1.9, 0.72–0.32 and 0.17–0.07 μm (front–rear values) for the low-contrast, moderate-contrast and high-contrast cases, respectively.
(a) Hydrodynamic simulation results of the density distributions of the preplasma at 5 ps before the arrival of the main pulse. The initial distribution of the 4-μm copper foil is marked with a dashed box. The laser prepulse is incident from negative to positive along the x-axis. (b) Schematic of the 2D PIC simulation setup. Both the front and rear preplasma show the exponential distributions.
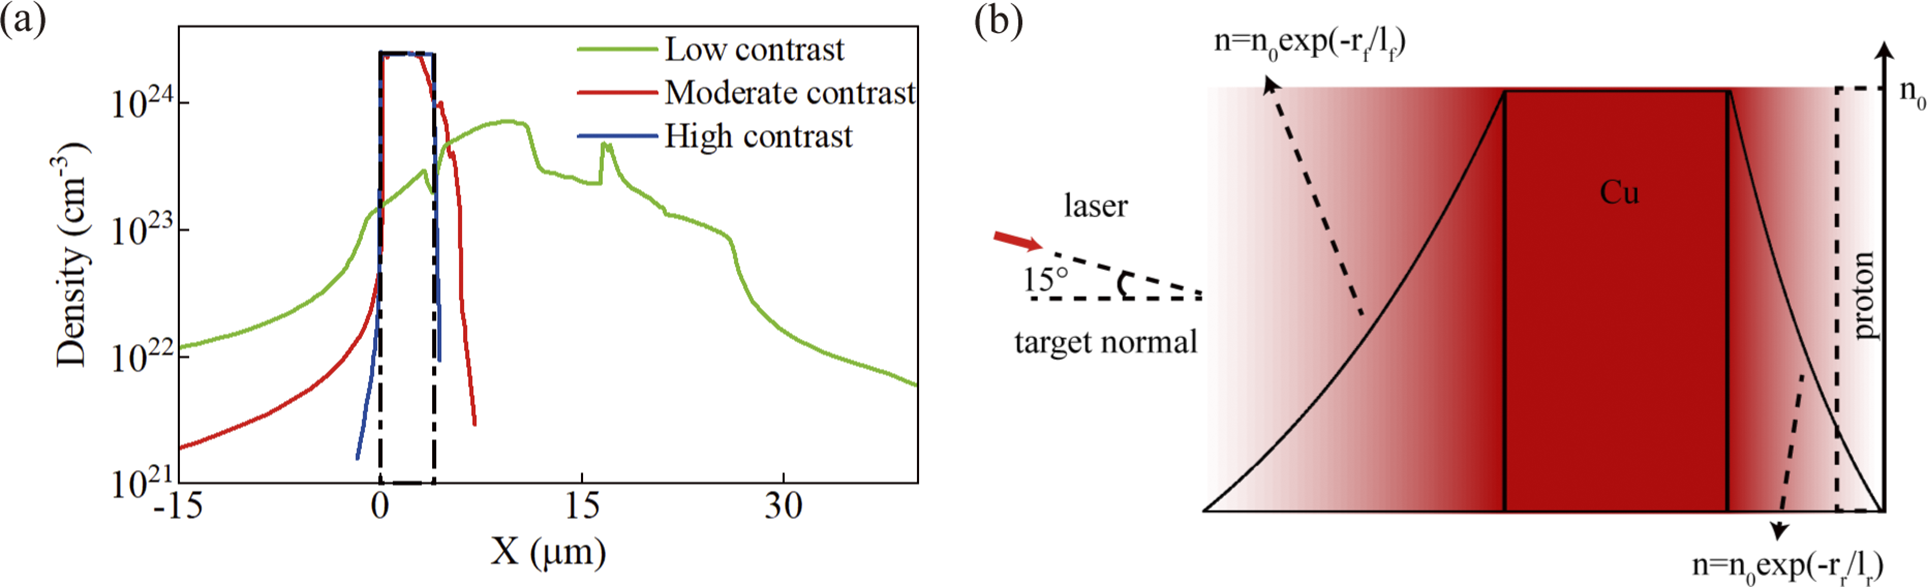
Based on the scale lengths of the preplasma via hydrodynamic simulation, 2D PIC simulation is conducted to study the interaction between the main laser and pre-expanded targets with the EPOCH code. The size of the simulation window is 90 μm × 40 μm (X × Y), where X represents the target normal direction and Y the target surface direction. The window is divided into 10,000 × 2500 cells, yielding cell dimensions of 9 nm × 16 nm. The laser pulse parameters used in the PIC simulation are the same as those in the experiment, and are of Gaussian shape in both the spatial and temporal distribution with a laser peak amplitude a 0 of 24 (I = 1.2 × 10²¹ W/cm2 at the wavelength of 0.8 μm). The laser is focused on X = 41 μm, Y = 0 at an incident angle of 15°, the position of which is the front surface of the unexpanded target. All the particles are fully ionized with the initial temperature of 0 keV. The plasma distributions are composed of four parts: the front preplasma, 4-μm Cu foil, rear preplasma and a proton contamination layer at the back of the foil (shown in Figure 3(b)). The proton contamination layer is only added at the rear surface as the origin of accelerated protons considering that the TNSA regime mainly accelerates protons at the rear of the target. It is worth noting that although for the low-contrast case the Cu foil could pre-expand to a much larger region, the cutoff proton energies do not vary significantly by changing the central target thickness, as shown in Figure S4 of the Supplementary Material. Therefore, the central target thicknesses for all contrast conditions are set constant (4 μm) to clarify the effect of preplasma. The front and rear preplasma distributions follow the exponential profiles determined from hydrodynamic simulations, with corresponding scale lengths for each contrast case. In PIC simulations, the laser arrives at the target front surface at 0 fs, and the simulation starts at –141 fs and stops at 325 fs.
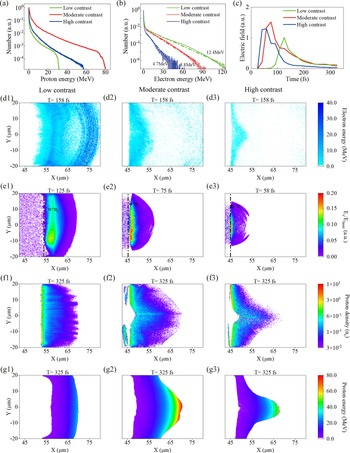
The simulated proton energy spectra for three different preplasma conditions are shown in Figure 4(a). The proton cutoff energies are 31.7, 79.9 and 60.7 MeV for the low-contrast, moderate-contrast and high-contrast cases, respectively. The simulation results are slightly higher than the experimental results, which can be attributed to the incomplete reception of the TP and/or the effect of 2D coefficients. In the 2D simulation, hot electrons expand slower and in turn establish a more intense sheath field at the rear of targets, finally leading to the overestimation of proton energies compared with the actual situation[ Reference Xiao, Zhou, Jiang, Yang, Li, Zhang, Qiao, Huang, Cao, Cai, Yu, Ruan and He45]. Nonetheless, the variation trend of proton energies is generally consistent with experimental results such that the proton cutoff energy is the highest for the moderate-contrast case. Considering that hot electrons play an important role in the TNSA mechanism, the electron spectra are also analysed and are shown in Figure 4(b). For the low-contrast case, the electron energy and number are the highest compared with the other two cases. The temperatures of hot electrons are obtained via exponential function fitting[ Reference Pukhov, Sheng and Meyer-ter-Vehn46], with 12.4, 8.8 and 4.7 MeV for the low-contrast, moderate-contrast and high-contrast cases, respectively, indicating that the larger scale length of preplasma induces hotter electrons. The main mechanism is that the larger scale length of the front preplasma can induce more absorption of lasers and in turn hot electrons with higher energy and greater quantity are accelerated. This conclusion can be further verified by the electron energy distributions shown in Figures 4(d1)–4(d3). It should be noted that the variation trend of electron temperatures for the three contrast conditions is not consistent with that of proton cutoff energies, proving that the electron temperature is not the sole factor for accelerating high-energy protons.
PIC simulation results. (a) The simulated proton spectra at 325 fs. (b) The simulated electron spectra at 58 fs, with the electron temperatures of 12.4, 8.8 and 4.7 MeV for the low-contrast, moderate-contrast and high-contrast cases, respectively. (c) The maximum sheath field (the X-component of the electric fields) as a function of the simulation time. (d1)–(d3) The electron energy distributions at 158 fs for the low-contrast (d1), moderate-contrast (d2) and high-contrast (d3) cases. (e1)–(e3) The sheath field distributions for the low-contrast case at 125 fs (e1), moderate-contrast case at 75 fs (e2) and high-contrast case at 58 fs (e3). The time is selected for each contrast case when the sheath field is the largest. The position where the density is n c is labelled by a dotted line. (f1)–(f3) The proton density distributions at 325 fs for the low-contrast (f1), moderate-contrast (f2) and high-contrast (f3) cases. (g1)–(g3) The proton energy distributions at 325 fs for the low-contrast (g1), moderate-contrast (g2) and high-contrast (g3) cases.
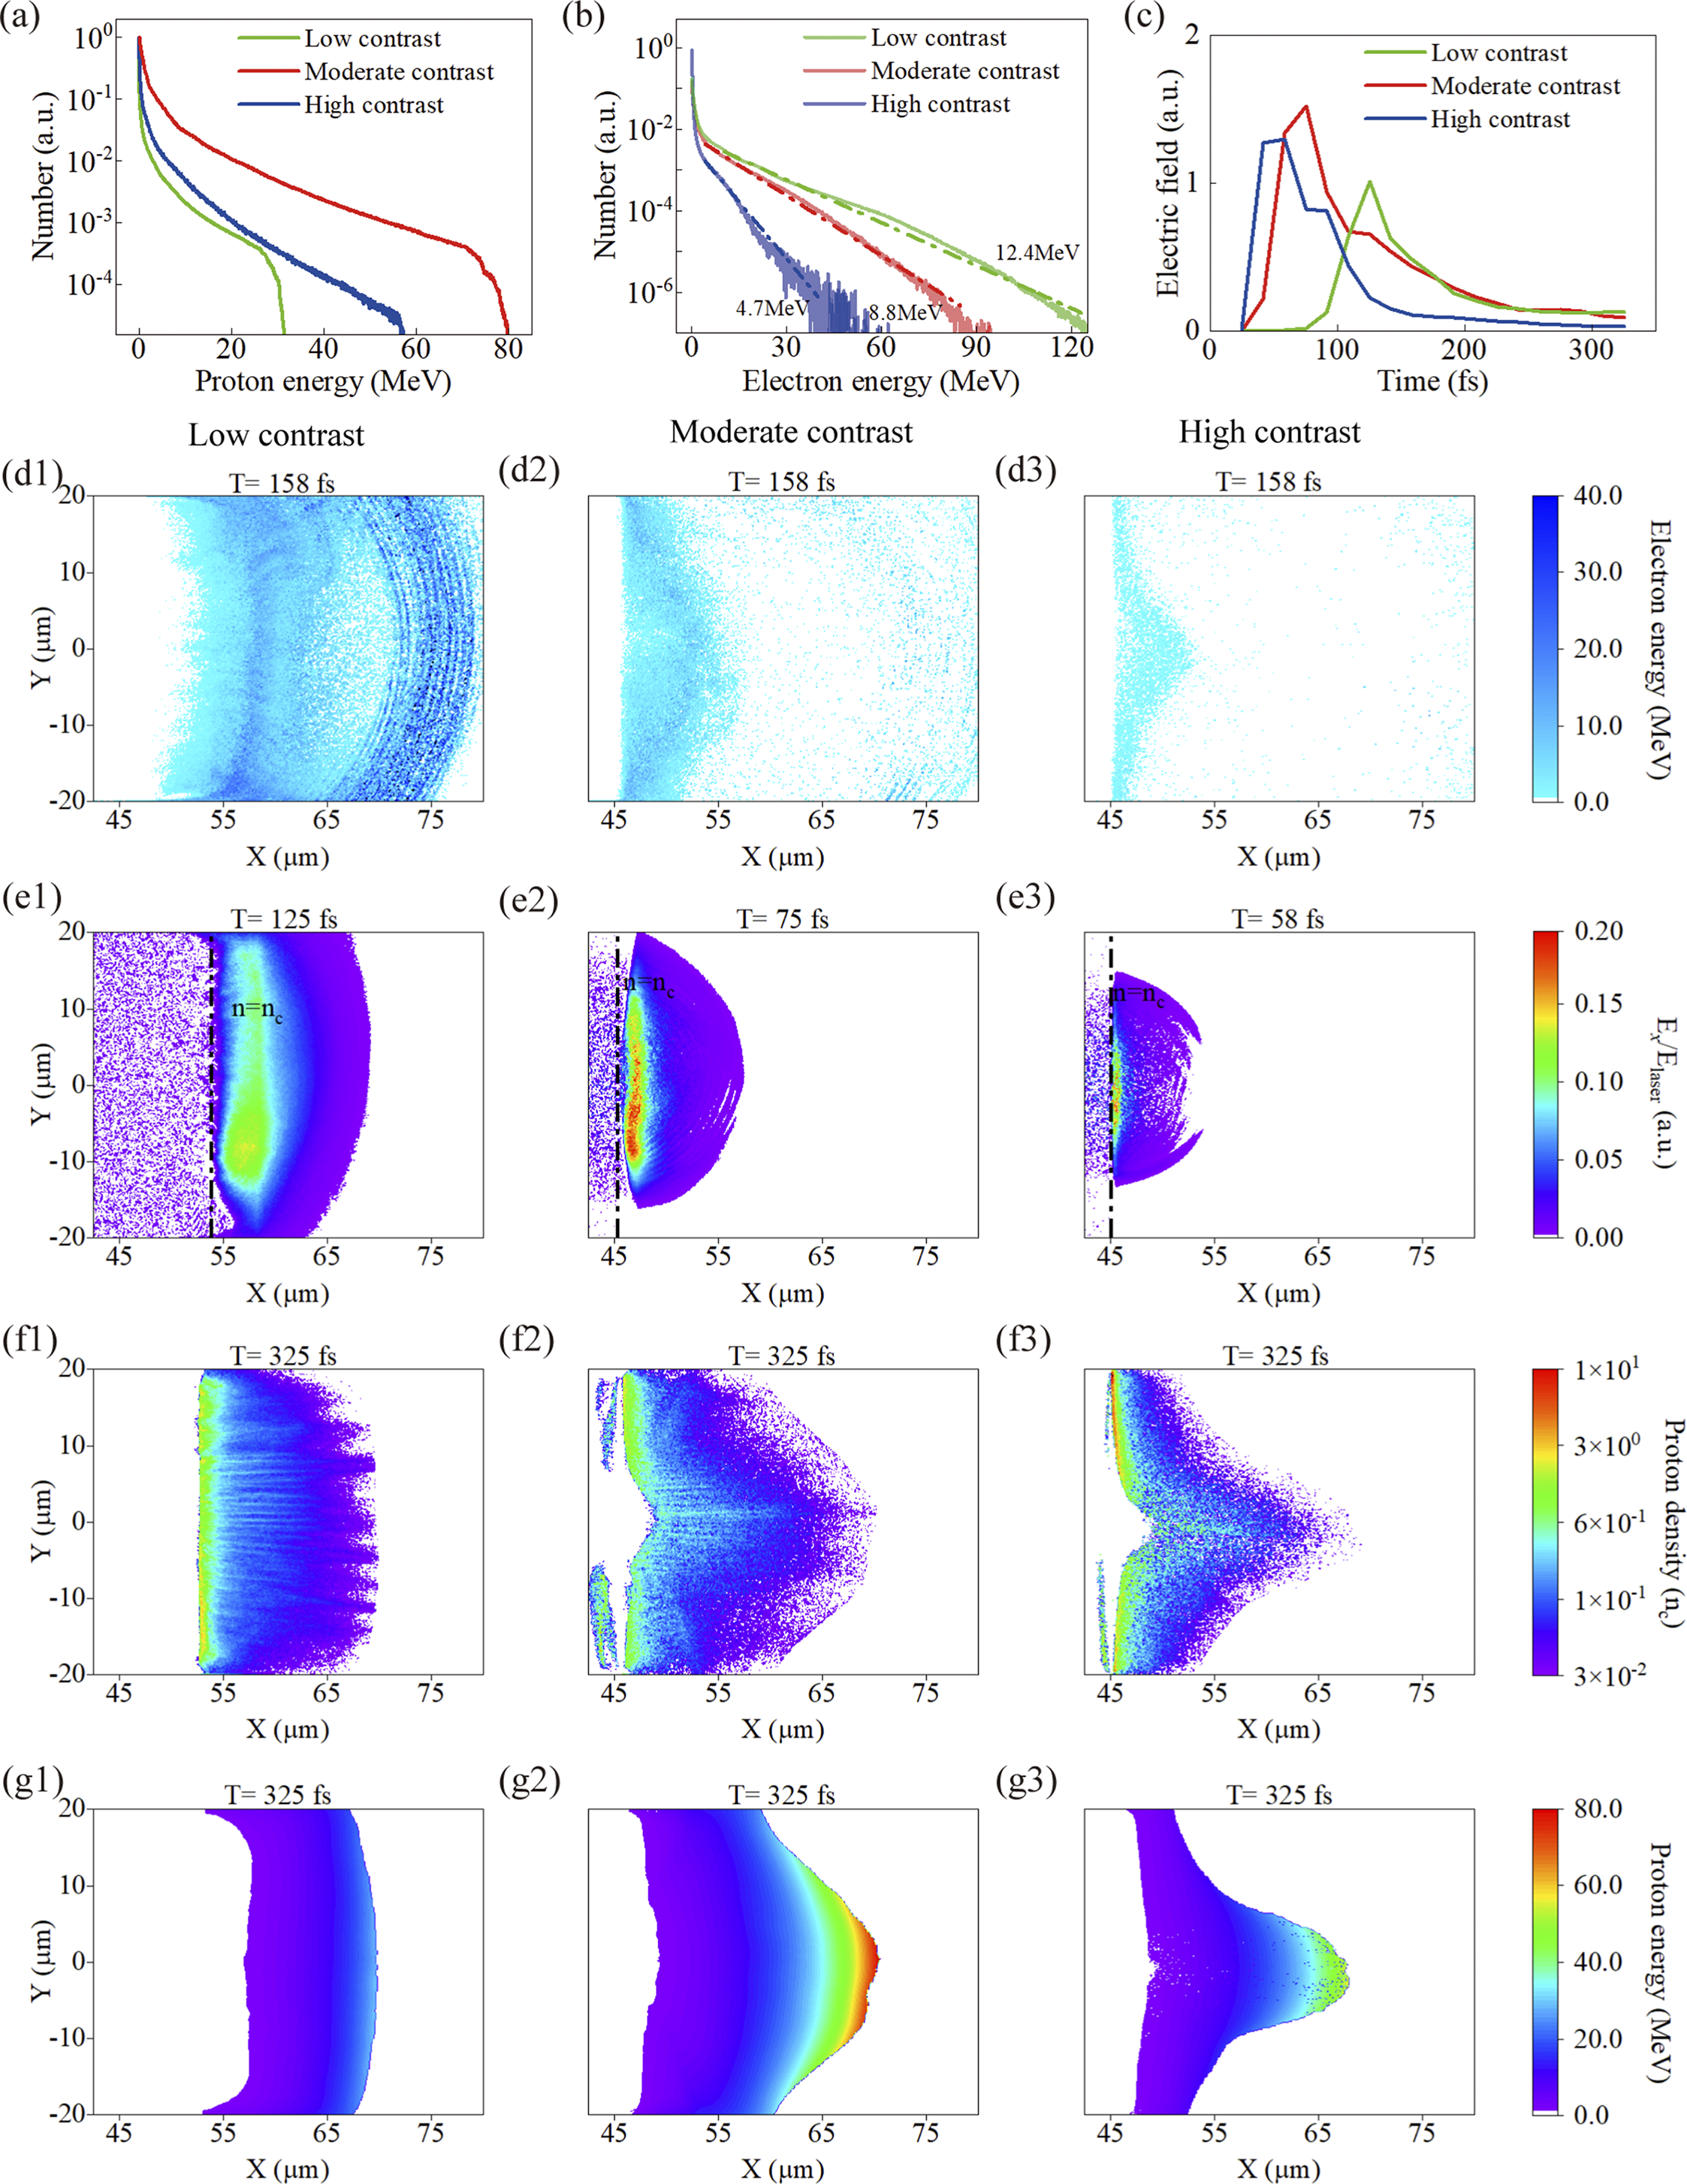
In the TNSA scheme, the sheath field is crucial for proton acceleration. Figure 4(c) shows the maximum sheath field (the X-component of the electric fields) as a function of the simulation time, showing the trends of first rising and then falling for all three cases. The variation trend of the sheath field is consistent with that of the proton cutoff energy, with the highest sheath field and proton energy for the moderate-contrast case. The longitudinal electric field distributions at the times of sheath field peaks are shown in Figures 4(e1)–4(e3). It can be obviously seen that the larger scale length of the rear preplasma results in a much smoother sheath field with the FWHM of the electric field of 11, 3.7 and 1.2 μm for the low-contrast, moderate-contrast and high-contrast cases, respectively.
From the above analysis, it can be seen that the scale lengths of both the front and rear preplasma play an important role in the intense sheath field generation and proton acceleration. For the low-contrast case, although the energy and number of accelerated electrons are the highest due to the largest scale length of the front preplasma, the weakest sheath field is generated since the smoothing effect of the rear preplasma is quite significant. Meanwhile, for the high-contrast case, although the smoothing effect of the rear preplasma is small, the electron acceleration is greatly suppressed due to the smallest scale length of the front preplasma. Besides, for the moderate-contrast case, the scale length of the front preplasma is long enough to achieve high-temperature electrons compared with the high-contrast case, and the scale length of the rear preplasma is so short that the smoothing effect is not strong compared with the low-contrast case, resulting in the most intense sheath field and highest proton energy.
The proton density distributions and energy distributions are shown in Figures 4(f1)–4(f3) and Figures 4(g1)–4(g3), respectively. It can be inferred from Figures 4(f1)–4(f3) that the high-contrast laser can produce lower-divergence proton beams compared with the other two cases. These features of simulated proton density distributions agree with experimental results. In Figures 4(g1)–4(g3), the proton energy distributions have similar shapes to the proton density distributions, while high-energy protons are concentrated in the target normal direction. As expected, the highest proton energy is obtained for the moderate-contrast case, while the lowest is obtained for the low-contrast case. It is worth noting that the higher the contrast, the smaller the divergence angle of protons, which should be strongly related to the electron distribution at the rear surface of the target[ Reference Green, Dover, Borghesi, Brenner, Cameron, Carroll, Foster, Gallegos, Gregori, McKenna, Murphy, Najmudin, Palmer, Prasad, Romagnani, Quinn, Schreiber, Streeter, Ter-Avetisyan, Tresca, Zepf and Neely47, Reference Bin, Ma, Allinger, Wang, Kiefer, Reinhardt, Hilz, Khrennikov, Karsch, Yan, Krausz, Tajima, Habs and Schreiber48]. The high-contrast case can induce a higher but more localized electron density at the rear surface (shown in Figure 4(d3)) and in turn drive a rapid phase of proton acceleration before the target deforms significantly, finally resulting in a more collimated proton beam. From the above analysis we can see that the PIC simulations basically reproduce the experimental results.
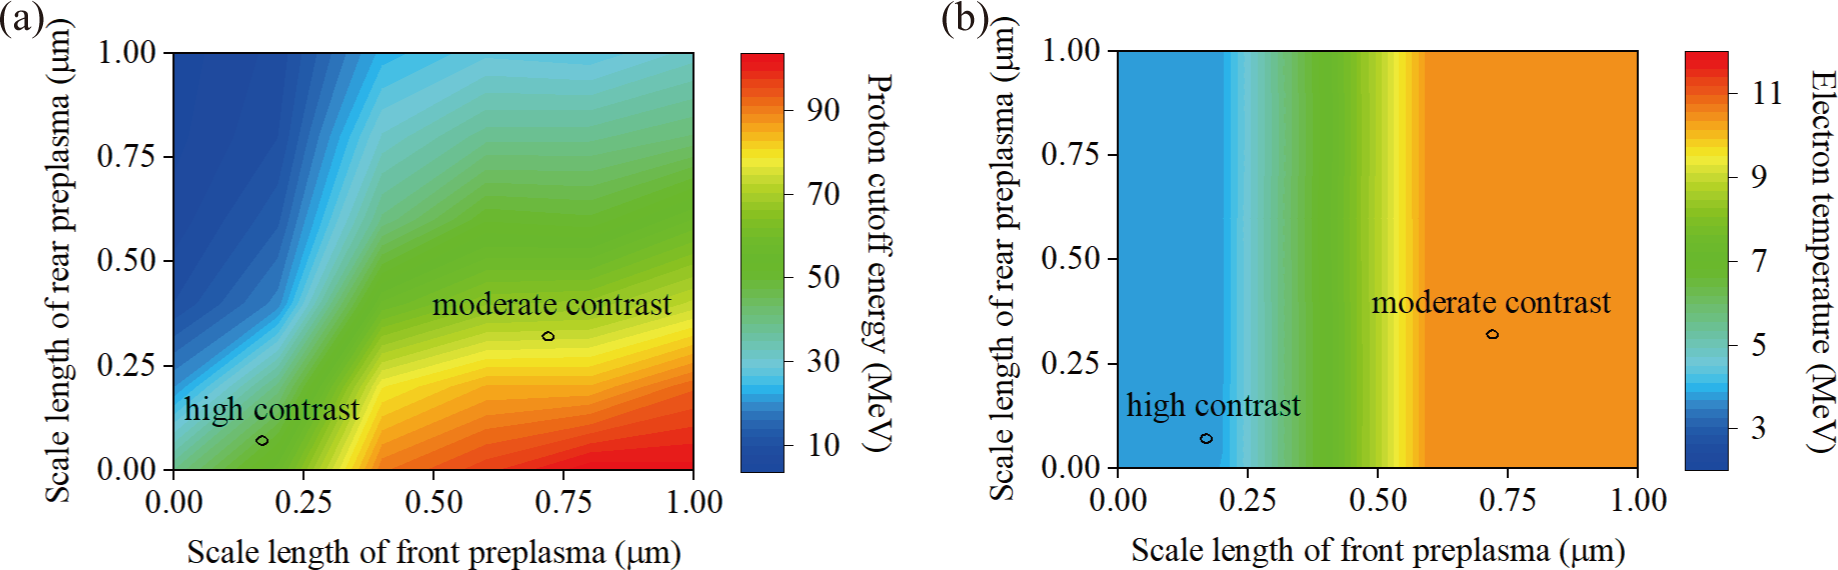
To further study the effect of front and rear preplasma on proton acceleration, the scale lengths of the preplasma are varied with the target thickness of 4 μm remaining constant. Figure 5 shows the results of a total of 36 simulations conducted with the selected scale lengths of PIC simulations of 0, 0.2, 0.4, 0.6, 0.8 and 1 μm for both the front and rear preplasma. Figure 5(a) shows the proton cutoff energy for different scale lengths of preplasma, showing that a larger scale length of the front preplasma and a smaller scale length of the rear preplasma would result in higher proton cutoff energy. The front preplasma is beneficial for the TNSA mechanism, while it is the contrary for the rear preplasma, such that we have the proton energy of 102.5 MeV for 1-μm front preplasma and 0-μm rear preplasma, and only 4.4 MeV for 0-μm front preplasma and 1-μm rear preplasma. As shown in Figure 5(a), the moderate-contrast case (0.72–0.32 μm, front–rear value) has larger scale lengths of both the front and rear preplasma than the high-contrast case (0.17–0.07 μm). Increasing the front preplasma from 0.17 to 0.72 μm while fixing the rear preplasma (0.07 μm), the proton cutoff energy increases from 60.7 to 94.4 MeV, while when increasing the rear preplasma from 0.07 to 0.32 μm (front preplasma fixed at 0.72 μm), the cutoff energy decreases slightly from 94.4 to 79.9 MeV. This indicates that the effect of the front preplasma dominates proton acceleration for a relatively small scale length of the rear preplasma. It also indicates that the effect of the front preplasma is saturated while that of the rear preplasma is not when the scale length becomes large. Although the low-contrast case (4.9–1.9 μm) is beyond the scope of Figure 5, increasing the front preplasma from 0.72 to 4.9 μm should not affect the proton energy since the electron temperature saturates according to Figure 5(b). However, increasing the rear preplasma from 0.32 to 1.9 μm would decrease the proton energy via smoothing of the sheath field and/or obstructing the particle transmission. Therefore, the rear preplasma is more important in determining proton cutoff energies for the large scale length of preplasma.
The proton cutoff energy (a) and electron temperature (b) as a function of the scale length of both the front and rear preplasma. The target thickness of 4 μm and laser parameters remain constant. The results of the moderate-contrast and high-contrast cases are labelled (the low-contrast case is not in the parameter region).

For the rear preplasma, increasing the scale length would smooth the sheath field, and in turn decrease the proton energy continuously. However, things are different for the front preplasma. In principle, the effect of the front preplasma should be closely associated with the temperature of the hot electrons, as shown in Figure 5(b). Since the laser cannot penetrate the target, the rear preplasma has almost no effect on the hot electrons. As mentioned above, the laser can penetrate plasma where the density is less than γn c (γ is the Lorentz factor of electrons) and the electrons are accelerated via absorbing the laser energy, which should have an upper limit (about 30%–50% of the laser energy[ Reference Ping, Shepherd, Lasinski, Tabak, Chen, Chung, Fournier, Hansen, Kemp, Liedahl, Widmann, Wilks, Rozmus and Sherlock49, Reference Liao, Liu, Scott, Zhang, Zhu, Zhang, Li, Armstrong, Zemaityte, Bradford, Rusby, Neely, Huggard, McKenna, Brenner, Woolsey, Wang, Sheng and Zhang50]). Therefore, when the scale length of the front preplasma is large enough, the number and energy of the hot electrons are saturated[ Reference Gizzi, Boella, Labate, Baffigi, Bilbao, Brandi, Cristoforetti, Fazzi, Fulgentini, Giove, Koester, Palla and Tomassini34] (in Figure 5(b) for scale lengths larger than 0.55 μm, the electron temperature increases quite slowly). Furthermore, the larger scale length of the front preplasma will obstruct the transmission of electrons and be slightly disadvantageous to proton acceleration.
4 Conclusion
In conclusion, we have experimentally studied the effect of prepulses on laser-proton acceleration at SULF. For 4-μm Cu targets, the proton cutoff energies are 23.6, 58.9 and 43.2 MeV for the low-contrast, moderate-contrast and high-contrast cases, respectively. Hydrodynamic simulation and PIC simulation are conducted to analyse the effect of both the front preplasma and rear preplasma, showing that a large scale length of the front preplasma is beneficial to the TNSA mechanism while that of the rear preplasma is to the contrary. Specifically, the front preplasma can enhance the laser absorption to accelerate hot electrons, while the rear preplasma would smooth the amplitude of the sheath field. Furthermore, the effect of the front preplasma is saturated and that of the rear preplasma is not for large scale length conditions, indicating that the moderate-contrast laser can induce the highest proton energy. Further improving the contrast ratio would decrease the proton energy but improve the divergence of the proton beam. This work theoretically gives a concrete map to accelerate higher-energy protons driven by multi-PW femtosecond lasers, which would shed light on other TNSA experiments at multi-PW laser facilities. Basically, our work fills the knowledge gap of the prepulse effect on TNSA driven by a state-of-the-art femtosecond laser facility with a high peak power of multi-PW and high intensity of 1021 W/cm2, which would facilitate potential applications requiring high-energy high-flux proton beams in a more predictable and stable manner.
Acknowledgements
This work was supported by the National Key R&D Program for Young Scientists (Grant No. 2024YFA1612700), the National Key R&D Program of China (Grant No. 2022YFE0204800), the National Natural Science Foundation of China (Grant No. 12388102), the Strategic Priority Research Program of the Chinese Academy of Sciences (Grant No. XDB0890301), the Youth Innovation Promotion Association of the Chinese Academy of Science (Grant No. 2021242), the Shanghai Rising-Star Program (Grant No. 23QA1410600) and the CAS Project for Young Scientists in Basic Research (Grant No. YSBR060).
Supplementary material
The supplementary material for this article can be found at http://doi.org/10.1017/hpl.2025.10092.


 Open access