


Non-technical Summary
In reconstructing biodiversity patterns from Earth’s past, it is crucial to understand the quality of the inherently incomplete fossil data that results from exposure to thousands to millions of years of geologic processes, as well as human-based sampling biases. One of the most straightforward ways to broadly understand the quality of the fossil record is to implement “completeness metrics” to ascertain the amount and availability of skeletal and evolutionary information. In this study, we use the Character Completeness Metric (CCM) to measure the percentage of phylogenetic characters that can be scored for a given fossil species, based on the preserved elements of a species’ anatomy. We use the CCM to quantify the nature of bias in the >242 million year fossil record of squamates (e.g., lizards, snakes, amphisbaenians, mosasaurs, and their relatives). We use published descriptions of 795 fossil squamate species spanning 242 million years of the group’s evolutionary history. We find that natural processes, such as the animal’s anatomy/body size and affinities to specific environments (e.g., marine, desert sand dunes, rivers, and lakes) are more reliable predictors of squamate fossil record completeness than processes related to sampling intensity among workers. These results illustrate the nuances of fossil record completeness specific to individual lineages and add to growing evidence that heightened research interest and sample size does not always produce a more complete fossil record.
Introduction
Fossil data, from a cellular to a global level, are subject to various geologic filters (Raup Reference Raup1976, Reference Raup1979; Smith and McGowan Reference Smith and McGowan2005), taphonomic filters (Sansom et al. Reference Sansom, Gabbott and Purnell2010), and sampling filters (Smith Reference Smith1994, Reference Smith2001) that play essential roles in our ability to reconstruct extinct biodiversity and ancient environments. Quantifying the effects that these filters have on our modern view of fossil life enables us to explore patterns of evolutionary history more precisely (Brocklehurst et al. Reference Brocklehurst, Upchurch, Mannion and O’Connor2012; Darroch and Saupe Reference Darroch and Saupe2018; Darroch et al. Reference Darroch, Fraser and Casey2021, Reference Darroch, Saupe, Casey and Jorge2022), and even find novel patterns in existing data (Woolley et al. Reference Woolley, Bottjer, Corsetti and Smith2024). Conversely, if left unaccounted for, these biases represent significant barriers to paleobiological inquiry (Kidwell and Holland Reference Kidwell and Holland2002; Wright et al. Reference Wright, Cherns and Hodges2003; Sansom Reference Sansom2015; Sansom et al. Reference Sansom, Wills and Williams2017; Close et al. Reference Close, Benson, Alroy, Carrano, Cleary, Dunne, Mannion, Uhen and Butler2020b) that can obscure the myriad of anatomical, ecological, and evolutionary signals contained in the rock record.
For groups of animals whose fossilized remains are most frequently preserved in hundreds of disarticulated parts, such as vertebrates, it is of critical importance to measure how the fossilization process affects our understanding of a fossil group’s anatomy. Incomplete preservation of the skeleton can impart significant downstream biases on reconstructing aspects of the physiology, ecology, and evolutionary history of vertebrates. Over the past 20 years, a growing number of studies have employed a variety of novel metrics to characterize and quantify fossil record biases in vertebrate groups (Mannion and Upchurch Reference Mannion and Upchurch2010; Brocklehurst et al. Reference Brocklehurst, Upchurch, Mannion and O’Connor2012; Walther and Fröbisch Reference Walther and Fröbisch2013; Brocklehurst and Fröbisch Reference Brocklehurst and Fröbisch2014; Cleary et al. Reference Cleary, Moon, Dunhill and Benton2015; Dean et al. Reference Dean, Mannion and Butler2016; Verrière et al. Reference Verrière, Brocklehurst and Fröbisch2016; Davies et al. Reference Davies, Bell, Goswami and Halliday2017; Tutin and Butler Reference Tutin and Butler2017; Brown et al. Reference Brown, Cashmore, Simmons and Butler2019; Cashmore and Butler Reference Cashmore and Butler2019; Driscoll et al. Reference Driscoll, Dunhill, Stubbs and Benton2019; Lukic-Walther et al. Reference Lukic-Walther, Brocklehurst, Kammerer and Fröbisch2019; Mannion et al. Reference Mannion, Chiarenza, Godoy and Cheah2019; Cashmore et al. Reference Cashmore, Mannion, Upchurch and Butler2020; Varnham et al. Reference Varnham, Mannion and Kammerer2021; Schnetz et al. Reference Schnetz, Butler, Coates and Sansom2022, Reference Schnetz, Butler, Coates and Sansom2024; Woolley et al. Reference Woolley, Bottjer, Corsetti and Smith2024). The growing number of comparative studies assessing the skeletal completeness (Skeletal Completeness Metric; Mannion and Upchurch Reference Mannion and Upchurch2010) of the fossil record of vertebrate groups alongside one another (e.g., Brown et al. Reference Brown, Cashmore, Simmons and Butler2019; Cashmore and Butler Reference Cashmore and Butler2019; Cashmore et al. Reference Cashmore, Mannion, Upchurch and Butler2020; Schnetz et al. Reference Schnetz, Butler, Coates and Sansom2024) allows us to identify sampling gaps in time and space and explore the upper and lower limits of preservation of the skeleton of anatomically disparate vertebrate groups (e.g., chondrichthyans and chiropterans; Schnetz et al. Reference Schnetz, Butler, Coates and Sansom2024). Additionally, “completeness metrics” for a fossil record can be one of the most straightforward ways to assess potential barriers to reconstructing the evolutionary relationships (i.e., phylogeny) of extinct organisms. To reconstruct the phylogenetic relationships of the majority of extinct biodiversity, we rely almost exclusively on the morphological traits preserved in their fossils. If a group’s fossil record is relatively incomplete according to a completeness metric, it implies that a substantial amount of morphological information we use to reconstruct evolutionary relationships is absent. Missing morphological information can prove to be problematic if a group has low completeness during critical time intervals of its evolutionary history, particularly during early intervals that elucidate the nature of higher-level evolutionary relationships (e.g., Brocklehurst et al. Reference Brocklehurst, Upchurch, Mannion and O’Connor2012; Baron et al. Reference Baron, Norman and Barrett2017; Simões et al. Reference Simões, Caldwell, Tałanda, Bernardi, Palci, Vernygora, Bernardini, Mancini and Nydam2018).
The >242 Myr fossil record of squamates (lizards, snakes, amphisbaenians, mosasaurs, and their relatives) provides a model system to quantitively explore the completeness of the fossil record of a tetrapod group and the effects of inherent biases on the amount and availability of morphological and phylogenetic information preserved throughout their evolutionary history. Squamates are a major component of the modern vertebrate fauna (>11,349 extant species; Uetz et al. Reference Uetz, Freed, Aguilar, Reyes, Kudera and Hošek2021), and have a record that is woefully incomplete during the early stages of their evolutionary history, which has contributed to the major topological incongruence among morphology- and genomics-based phylogenetic hypotheses today (Conrad Reference Conrad2008; Gauthier et al. Reference Gauthier, Kearney, Maisano, Rieppel and Behlke2012; Pyron et al. Reference Pyron, Burbrink and Wiens2013; Reeder et al. Reference Reeder, Townsend, Mulcahy, Noonan, Wood, Sites and Wiens2015; Simões et al. Reference Simões, Caldwell, Tałanda, Bernardi, Palci, Vernygora, Bernardini, Mancini and Nydam2018). Squamates are extremely morphologically diverse, with body plans ranging from tiny to giant four-limbed terrestrial/semiaquatic forms (lizards and early mosasauroids); at least half a dozen lineages of tiny to giant, elongate, limbless forms (snakes, dibamids, amphisbaenians, some anguids, some teiids); and large to giant fully aquatic forms (mosasaurians). In addition to the anatomical diversity observed in squamates, the variety of depositional environments in which squamate fossils are found allows us to test for broad (e.g., terrestrial vs. marine) and fine-scale (e.g., fluvial channel vs. fluvial floodplain) taphonomic and geologic controls on the preservation of phylogenetic information in the fossil record.
Using a global dataset spanning multiple geologic eras, this study attempts to characterize the inherent “megabiases” (Behrensmeyer et al. Reference Behrensmeyer, Kidwell and Gastaldo2000) at play in the completeness of the fossil record of squamates. The term “megabias” refers to processes that act together as a permanent filter, warping fossil information that workers can sample and study (Kowalewski Reference Kowalewski, Copper and Jin1996; Behrensmeyer et al. Reference Behrensmeyer, Kidwell and Gastaldo2000; Close et al. Reference Close, Benson, Saupe, Clapham and Butler2020a,Reference Close, Benson, Alroy, Carrano, Cleary, Dunne, Mannion, Uhen and Butlerb; Nanglu and Cullen Reference Nanglu and Cullen2023). Megabiases in the fossil record can be numerous, but they largely fall into three major categories: (1) primary megabiases, which include biotic factors such as anatomy and biodiversity (Kowalewski Reference Kowalewski, Copper and Jin1996; Behrensmeyer et al. Reference Behrensmeyer, Kidwell and Gastaldo2000); (2) geologic/taphonomic megabiases, which include factors related to sedimentation, burial, lithification, fossilization, rock uplift, weathering, erosion, and rock outcrop exposure (Barrett et al. Reference Barrett, McGowan and Page2009); and (3) worker sampling megabiases, which include lack of comprehensive rock outcrop surveys and asymmetrical research interest among fossilized taxonomic groups (Close et al. Reference Close, Benson, Alroy, Carrano, Cleary, Dunne, Mannion, Uhen and Butler2020b). Generally, all megabiases play a role in the quality of the fossil record, but recent work (e.g., Kowalewski Reference Kowalewski, Copper and Jin1996; Barrett et al. Reference Barrett, McGowan and Page2009; Benton et al. Reference Benton, Dunhill, Lloyd and Marx2011; Nanglu and Cullen Reference Nanglu and Cullen2023) has shown that patterns of megabias across organismal groups’ fossil records are not uniform, and that targeted inquiries into the quality of the fossil record of individual groups can help to better characterize broader biases that play a role in our understanding of assemblages and environments in Earth’s past.
Here, we show that spatiotemporal sampling intensity is not a reliable predictor of squamate fossil record completeness. Similarly, increasing the sample size of specimens referrable to a fossil species does not predict the completeness of the anatomy and phylogenetic information preserved within said species. These results suggest that human-based sampling biases are not the primary driver of squamate fossil record completeness on a global scale. Instead, we find that patterns in fossil record completeness are primarily driven by two naturally occurring processes: (1) fundamental anatomical differences, such as body plan, body size, and bone durability among different squamate groups; and (2) certain lithologies and depositional environments tend to preserve significantly higher amounts of anatomical and phylogenetic data than others, regardless of sample size. These results illustrate the nuances of fossil record completeness specific to individual lineages and add to growing evidence (e.g., Brown et al. Reference Brown, Cashmore, Simmons and Butler2019; Schnetz et al. Reference Schnetz, Butler, Coates and Sansom2024) that heightened research interest and sample size do not always produce a more complete fossil record.
Materials and Methods
Institutional Abbreviations
FMNH, Field Museum of Natural History, Chicago, Illinois, United States of America; GU/RSR/VAS, Department of Geology, H.N.B. Garhwal University, Uttaranchal, India, R.S. Rana collection; IGM, Mongolian Institute of Geology, Ulaan Baatar, Mongolia; INSAP, Institut National des Sciences de l’Archaeologie et du Patrimoine, Rabat, Morocco; KDRC, Korean Dinosaur Research Center, Chonnam National University, Republic of Korea; KHM, Kaikoura Historical Museum, Kaikoura, New Zealand; MHGI, Museum of the Hungarian Geological Institute, Budapest, Hungary; SBEI, collection of the Shiramine Board of Education, Shiramine Institute of Paleontology, Hakusan City Board of Education, Hakusan, Japan (formerly Shiramine Village Board of Education, Shiramine, Japan); TMM, University of Texas Jackson School Museum of Earth History, Austin, Texas, United States of America; UALVP, University of Alberta Laboratory of Vertebrate Paleontology, Edmonton, Alberta, Canada; UCMP, University of California Museum of Paleontology, Berkeley, California, United States of America; UF, University of Florida Museum of Natural History, Gainesville, Florida, United States of America.
Sampling the Published Squamate Fossil Record
The occurrence dataset used in this study is based on the squamate dataset of Woolley et al. (Reference Woolley, Bottjer, Corsetti and Smith2024). General taxonomic, stratigraphic, and occurrence-based data from the published fossil record of lizards, snakes, mosasaurs and amphisbaenians were downloaded from the Paleobiology Database (PBDB; data downloaded 5 June 2020 using the following criteria: Order: Squamata). We limited our data to the species level, as both phylogenetic datasets used in this study (Gauthier et al. Reference Gauthier, Kearney, Maisano, Rieppel and Behlke2012 [GEA]; Simões et al. Reference Simões, Caldwell, Tałanda, Bernardi, Palci, Vernygora, Bernardini, Mancini and Nydam2018 [SEA]) use species as their operational taxonomic units. We also excluded extant species found in the squamate fossil record, as each extant species included in the GEA and SEA phylogenetic datasets was based on modern morphological and molecular data. We specifically filtered out any fossil squamate material assigned to extant species, even though there are Quaternary fossils assigned to extant taxa. We mainly did this because, if the taxonomic assignments are correct, we presumably would still have 100% of the morphological data to score because the taxon is extant and thus full skeletons (and soft tissues in wet specimens) would be available. In total, we sampled the published record of 795 species and 16,983 specimens of extinct squamates that range from the Middle Triassic (Anisian) to the late Pleistocene in age. PBDB information for each species was vetted using 492 published specimen and locality descriptions (see Supplementary References). Each occurrence entry from the PBDB was vetted using an exhaustive search and survey of all publications associated with the taxon and, in some cases, where no geologic setting is included in the description, the geologic unit that preserves the taxa. This allowed for removal of many out-of-date taxonomic assignments, general stratigraphic positions, duplicates, and so on present in the PBDB dataset.
To compare our completeness data trends with the entire squamate fossil record on the PBDB, we downloaded records of all squamate collections in the PBDB and the total squamate-bearing formations. This dataset was downloaded on 19 March 2025 and pruned to exclude trace fossils, but also includes localities and formations in which fossils belonging to extant squamate taxa are preserved. Additionally, we did not limit the taxonomic scope of this dataset, as we had with the previous download, to ensure that if a collection or formation contained a fossil assigned to Squamata, we included it for comparison.
Fossil Completeness Metric and Phylogenetic Datasets
To assess the completeness of the global fossil record of lizards, snakes, mosasaurians, and amphisbaenians, we used the Character Completeness Metric 2 (CCM2; Mannion and Upchurch Reference Mannion and Upchurch2010), which measures the percentage of appropriate phylogenetic characters that can be scored for all specimens referred to a fossil species. We used two morphological character datasets that represent two major morphology-based hypotheses of squamate evolutionary relationships (GEA and SEA; Fig. 1A,B). We combined these two datasets and removed overlapping characters for a total of 860. Each species’ completeness was scored based on the presence of individual skeletal elements for which a corresponding portion of the combined phylogenetic characters could be scored. It is important to acknowledge that this methodology slightly overestimates the number of characters that can be scored. For example, if a “humerus” is preserved in a fossil species, it may be crushed or may not have all features visible for the surveyor to score, and therefore it is possible that some of the characters for humeri would not be available for that species. While this certainly inflates CCM2 scores, the total number of characters (860) and high number of species (795) over 242 Myr of geologic time minimize the effects of this overestimation when broadly characterizing the quality of the incomplete squamate fossil record.
Summary of the phylogenetic datasets used to assess for the Character Completeness Metric 2 (CCM2) in this study. A, Gauthier et al. (Reference Gauthier, Kearney, Maisano, Rieppel and Behlke2012) hypothesis. B, Simões et al. (Reference Simões, Caldwell, Tałanda, Bernardi, Palci, Vernygora, Bernardini, Mancini and Nydam2018) hypothesis. All silhouettes traced from publicly available images at www.phylopic.org. C, Heat map of the distribution of the combined dataset of 860 phylogenetic characters across an example four-limbed squamate skeleton (Uta stansburiana Baird and Girard, Reference Baird and Girard1852; modified from Woolley et al. Reference Woolley, Bottjer, Corsetti and Smith2024). D, Heat map of the distribution of 710 phylogenetic characters (excluding girdle and limb characters from the combined dataset) across an example limbless squamate skeleton (Crotalus atrox Baird and Girard, Reference Baird and Girard1853; modified from Woolley et al. Reference Woolley, Thompson, Wu, Bottjer and Smith2022).

We carried out scoring CCM2 percentages under two categories: (1) “raw completeness,” in which a species’ CCM2 percentage was scored out of all 860 phylogenetic characters available in the combined GEA + SEA dataset (Fig. 1C); and (2) “true completeness,” in which a species’ CCM2 percentage was scored only from the characters that the species could be scored for. For instance, many fossil snake and amphisbaenian species do not possess limbs (Fig. 1D). This means that, no matter how complete the skeletal remains are, snake and amphisbaenian species would always be missing 150 characters that correspond to the limbs and limb girdles. Because of this disparity, we also measured legless squamate taxa’s true completeness scored out of 710 characters instead of 860 (Supplementary Data).
When scoring CCM2 percentages for individual species through geologic time, we found that some species occur across multiple multi-million-year stages. This led to a problematic choice of whether the CCM2 score should be uniform for the species across time bins, which might artificially inflate or deflate assessments of average or median completeness of the squamate fossil record, or whether the CCM2 percentage should be scored separately for referred specimens in each time bin. We decided to base our CCM2 scorings on the geologic time interval in which the holotype specimen of a species was found, while including all referred specimens if they occurred in the same interval of time as the holotype specimen. We excluded referred specimens recovered from different geologic stages from the holotype specimen. This is mostly relevant to terrestrial lizards and snakes from the Campanian and Maastrichtian of North America, where numerous incomplete Campanian specimens are referred to species whose holotype specimen occurs in the Maastrichtian, most of which are in need of taxonomic reassessment (e.g., Parasaniwa wyomingensis Gilmore, Reference Gilmore1928, Odaxosaurus piger Gilmore, Reference Gilmore1928, Chamops segnis Marsh, Reference Marsh1892, Leptochamops denticulatus Gilmore, Reference Gilmore1928, Coniophis precedens Marsh, Reference Marsh1892; Nydam Reference Nydam2013; Woolley et al. Reference Woolley, Smith and Sertich2020; see Supplementary References: Campanian–Maastrichtian). While this approach deflates the number of localities and specimens included in the species, it also reduces confusion over species occurrence data through time and the corresponding completeness values utilized in this study. Additionally, this issue only pertained to a small minority of the occurrence dataset, with most fossil squamate species being constrained to a single geologic stage.
When quantifying the number of specimens referred to a species, we included published specimens with unique specimen numbers (e.g., UALVP 50959, Kleskunsaurus grandeprairiensis Nydam et al., Reference Nydam, Caldwell and Fanti2010, partial skull; Nydam et al. Reference Nydam, Caldwell and Fanti2010) in addition to batch-cataloged specimens in which the number of referred elements was explicitly quantified (e.g., MHGI V.19003 Elaphe praelongissima Venczel, Reference Venczel1994 vertebrae [n = 75]; Venczel Reference Venczel1994). For each species, we only included referred specimens within the same geologic stage (e.g., Ypresian) as the holotype specimen. Additionally, for our calculations of completeness per lithology and depositional environment, if specimens referred to the same species are recovered from different depositional environments and/or lithologies, we assigned the lithology/depositional environment that preserved the most complete specimen (e.g., Saniwa ensidens Gilmore, Reference Gilmore1928, FMNH PR2378, lacustrine; Rieppel and Grande Reference Rieppel and Grande2007). While this approach certainly omits some finer-scale data on a per-specimen basis, the goal of this study was to quantify general patterns in squamate fossil quality over their current known temporal and spatial range.
Data Visualization and Statistical Tests
All data visualization and statistical tests were carried out in R (R Core Team Reference Team2013). Time-series plots were visualized using the geoscale package in R (Bell Reference Bell2022). The mean, standard deviation, and median of CCM2 scores for all species occurring within a geologic time bin were calculated to detect fluctuations of the quality of the squamate fossil record though time. Violin plots of various partitions of nontemporal range data were visualized using the vioplot package in R (Adler et al. Reference Adler, Kelly and Elliott2021). Linear regression analysis was carried out for linear time-series comparisons with the function lm() in the stats package in R. Generalized least-squares regressions (GLS) was performed using the function gls() in the R package nlme (Pinheiro et al. Reference Pinheiro, Bates, DebRoy, Sarkar, Heisterkamp, Van Willigen and Maintainer2017), in which a first-order autoregressive model (cor-AR1) is applied to the data to avoid overestimating statistical significance due to temporal autocorrelation. We carried out analyses using log-transformed values to ensure homoscedasticity (constant variance) and normality of residuals. The function r.squaredLR() of the R package MuMIn (Bartón Reference Bartón2019) was also used to calculate likelihood ratio–based pseudo-R 2 values. Nonparametric pairwise statistical comparisons of nontemporal range CCM2 data were carried out using the Mann-Whitney U-test and the Kolmogorov-Smirnov test. Because we performed multiple statistical comparisons among both landmasses and among depositional environments, statistical tests were run using a Bonferroni correction on the α-value. Example R code of our analyses is provided in Supplementary Data S3.
Results
The CCM2 and Squamates: Overview
Our fossil dataset contains 419 lizard species, 252 snake species, 91 mosasaurian species, and 33 amphisbaenian species (Fig. 2A), illustrating the diversity of body plans preserved in the >240 Myr fossil record of the group. Overall, the fossil record of squamates is incomplete (Fig. 2B), with the median CCM2 score of all sampled squamate species at 10.33%. Accordingly, the bulk of fossil squamate species retain CCM2 scores under 25% (Fig. 2C), consisting mostly of isolated, broken, and disarticulated skeletal elements (Fig. 2C,D) with relatively few cases of exceptionally complete species (Fig. 2E,F). Species range in completeness from 1.63% (Anolis electrum Lazell, 1965; Fig. 2G) to 96.28% (Saniwa ensidens Gilmore, Reference Gilmore1928; Rieppel and Grande Reference Rieppel and Grande2007; Fig. 2F).
Summary of Character Completeness Metric 2 (CCM2) in the squamate fossil record. A, Summary of the number of fossil species sampled from four squamate groups, separated based on anatomical differences. B, Violin plot of species’ CCM2 distributions sourced from the entire fossil squamate dataset. White dot, median; black bar, interquartile range; black line, 95% confidence interval. C, Example of a fossil lizard species with a CCM2 percentage of roughly 25% (Asagaolacerta tricuspidens Evans and Matsumoto, 2015, holotype specimen SBEI 1566). D, Example of a fossil lizard species with a CCM2 percentage of roughly 50% (Heloderma texana Stevens, 1977, holotype specimen TMM 40536-123). E, Example of a fossil lizard species with a CCM2 percentage of roughly 75% (Saichangurvel davidsoni Conrad and Norell, 2007, holotype specimen IGM 3/858). F, Line drawing of fossil squamate species with the highest observed CCM2 percentage (Saniwa ensidens Gilmore, Reference Gilmore1928, referred specimen FMNH PR2378, Rieppel and Grande Reference Rieppel and Grande2007). G, Line drawing of fossil squamate species with the lowest observed CCM2 percentage (Anolis electrum Lazell, 1965, holotype specimen UCMP 648496).

Squamate-Bearing Formations: Changes through Geologic Time
The time-series data for squamate-bearing formations (SBFs) through time are summarized in Figure 3A. The squamate fossil record for the Triassic and Jurassic includes 10 out of 16 stage bins that do not contain a published record of a fossil referred to a squamate. Three of the remaining six stages contain only one SBF (Anisian, Toarcian, Oxfordian), and the maximum number of published SBFs given a stage is six (Tithonian). These results illustrate a discontinuous and poorly sampled record of squamates during the early stages of their evolutionary history. However, from the Late Jurassic through late Pleistocene, the squamate fossil record is substantially more continuous. We observe that the number of SBFs increases almost exponentially throughout the Mesozoic (Fig. 3A), with both the Campanian and Maastrichtian producing the most SBFs (92) for any geologic stage—more than twice as many as the second-highest SBF total (41, Cenomanian). Although SBFs from stages in the Cenozoic never reach the quantity seen in the Campanian/Maastrichtian, the average number of SBFs per stage in the Cenozoic is comparable to that in the Mesozoic (19.25 to 21, respectively). If we treat the Campanian/Maastrichtian SBFs as anomalies, then the average number of SBFs per stage in the Mesozoic decreases to 11.5.
Patterns in the squamate fossil record through geologic time. Time-series plots illustrating the number of published squamate-bearing formations (SBFs) per geologic stage (A), total published fossil squamate collections per geologic stage (B), total extinct species occurrences per geologic stage (C), and the completeness of the squamate fossil record per geologic stage through time (D). Mean (sky blue line), standard deviation (blue shading), and median (red line) Character Completeness Metric 2 (CCM2) percentages of all sampled squamate species through time. Gray dots indicate CCM2 scores of individual species within each time bin. Dark gray vertical bars indicate the Cretaceous–Paleogene mass extinction event (K-PG, right) and the End-Triassic Mass Extinction (ETME, left).

Fossil Squamate Collections: Changes through Geologic Time
Generally, changes in the number of squamate PBDB collections per geologic stage (Fig. 3B) mirror those seen in the number of SBFs (Fig. 3A). Once again, the Campanian and Maastrichtian represent the time periods with the most data; however, the Ypresian (Eocene) contains a substantially higher number of PBDB squamate collections relative to the number of SBFs than the Cenomanian, which contains similar numbers of SBFs (Cenomanian: 41 SBFs; Ypresian: 39 SBFs). The average number of PBDB collections per stage in the Cenozoic is 95.55, whereas the average for the Mesozoic is 66.71 (without the Campanian/Maastrichtian: 28.4 PBDB collections per stage).
Sampled Extinct Squamate Species through Geologic Time
The time-series data for sampled species of extinct squamates through time are summarized in Figure 3C. Only one stage (Coniacian) contains a single species, while five stages contain >50 species (Campanian: 111; Maastrichtian: 70; Ypresian: 112; Priabonian: 61; Burdigalan: 51). 569 out of the 795 sampled extinct squamate species are found in stages occurring either in the Late Cretaceous or the Paleogene. With the exception of the Burdigalan (early Miocene), the number of sampled extinct squamate species per stage generally decreases from the end of the Eocene toward the present. The number of extinct squamate species per geologic stage (Fig. 3C) also broadly mirrors patterns observed in SBFs (Fig. 3A) and in the number of PBDB collections (Fig. 3B), marked by exponentially increasing stage-level species richness in the Mesozoic, with high points in the Campanian/Maastrichtian, followed by higher average stage-level species richness in the Cenozoic (discussed later). However, a key difference in the record of extinct squamate species is that the stage with the highest number of species is the Ypresian (112), followed by the Campanian (111) and the Maastrichtian (76). The average number of species per geologic stage in the Mesozoic is 18.88, whereas the average number of species per stage in the Cenozoic is 23.9.
Phylogenetic Information Content through Geologic Time
We plotted each species’ CCM2 percentage in its corresponding geologic stage (Fig. 3D) and overlaid those scores with trendlines indicating the mean and median CCM2, as well as the standard deviation (1σ) for CCM2 values. The mean and median CCM2 percentage of extinct squamates showcases considerable variation in the patchy and less well sampled Triassic and Jurassic. As sampling increases through the Cretaceous, mean and median CCM2 percentages per stage fluctuate, but the highest peaks in mean and median CCM2 for all stages with n species > 7 are within the Cretaceous Period (Berriasian, Cenomanian, Turonian, Campanian, Maastrichtian). The Cenozoic record of squamates includes ~60% of all surveyed extinct squamate species, but despite the heavier sampling, the mean CCM2 per stage rarely reaches the heights or the variation observed during the Mesozoic. Only the seven squamate species in the Messinian (late Miocene) Cave deposits in Hungary (Bolkay Reference Bolkay1913; Venczel Reference Venczel1994, Reference Venczel1998) allow for a mean CCM2 to reach levels comparable to those seen in the Mesozoic. The standard deviation of CCM2 values tracks the variation seen in the mean CCM2 through time, but also on average gradually decreases toward the present. The median CCM2 through time skews lower than the mean.
Simple linear regression tests show weak relationships between completeness (CCM2) and the number of SBFs (adjusted R 2 = −0.01201), PBDB collections (adjusted R 2 = 0.2019; p < 0.05), and sampled species (adjusted R 2 = −0.009063; p < 0.05). Similarly weak relationships are recovered between PBDB collections and SBFs (adjusted R 2 = 0.1913; p < 0.05), species and SBFs (R 2 = −0.01285), as well as species and PBDB collections (R 2 = 0.1766; p < 0.05). Similar to the linear regression tests, GLS tests reveal weak but significant (all p-values < 0.05; Supplementary Data S2) relationships between log-transformed values of completeness (CCM2) and number of SBFs (R2 = 0.345), PBDB collections (R 2 = 0.395), and sampled species (R 2 = 0.289) per stage. Meanwhile, GLS tests illustrate a strong relationship (all p-values < 0.05; Supplementary Data S2) between log-transformed values of PBDB collections and SBFs (R 2 = 0.972), species and SBFs (R 2 = 0.679), as well as species and PBDB collections (R 2 = 0.686).
Occurrence and Abundance of Fossil Squamate Lineages through Geologic Time
We mapped out the occurrences of fossil taxa assigned to major squamate lineages through geologic time (Fig. 4), according to the combined-evidence phylogenetic hypothesis of SEA, which aligns largely with other genomics-based hypotheses of squamate evolutionary relationships (for the morphology-based GEA hypothesis, see Supplementary Fig. S1). Most higher-level squamate lineages have occurrences in the Mesozoic and Cenozoic, with Paramacellodidae, Mosasauria, and Polyglyphanodontia going extinct at the Cretaceous/Paleogene boundary and with the earliest definitive occurrences of Amphisbaenia and Dibamidae in the Paleogene (Fig. 4). We find that 546 out of 795 species (68.7% of fossil squamate taxa) belong to the group commonly referred to as Toxicofera (iguanians, snakes, anguimorphs, and the extinct mosasaurians). Toxicoferans outnumber other higher-level squamate clades both in the Mesozoic and in the Cenozoic (Fig. 4). The oldest members of 11 squamate lineages are limited to a single occurrence in a geologic stage, while 6 include multiple occurrences in the earliest stage. These lineages include Gekkonomorpha (Tithonian, 6 occurrences), Polyglyphanodontia (Valanginian, 2 occurrences), Teiioidea (Barremian, 4 occurrences), Amphisbaenia (Danian, 3 occurrences), and Varanoidea (Campanian, 9 occurrences).
Squamate species abundance through time. Occurrences and abundances of major squamate lineages, mapped onto the time-calibrated combined-evidence hypothesis of squamate relationships from Simões et al. (Reference Simões, Caldwell, Tałanda, Bernardi, Palci, Vernygora, Bernardini, Mancini and Nydam2018). Gray vertical elongate ovals indicate geologic stage-level range of fossil squamate taxa within a lineage. Dots indicate the occurrence of a species in the geologic stage, and the color of the dot corresponds to that stage. Lineages recovered within the clade Toxicofera are highlighted in dark blue. Dark gray horizontal bars indicate the Cretaceous–Paleogene mass extinction event (K-PG, top) and the end-Triassic mass extinction (ETME, bottom).

Although most major extant lineages of squamates are present in the Mesozoic, the two most numerous lineages are Mosasauria and Polyglyphanodontia, which go extinct at the end of the Cretaceous. Snakes, iguanians, and anguimorphans are also abundant during the Campanian and Maastrichtian. By the late Paleocene, snakes become by far the most abundant fossil squamates throughout the Cenozoic. Extinct anguoids and iguanians are also abundant, particularly during the Eocene–Miocene.
Completeness of Fossil Squamate Lineages through Geologic Time
We plotted a heat map of clade-specific median completeness scores through geologic time (Fig. 5, Supplementary Fig. S2). When this is compared with lineage abundance through time (Fig. 4), we observe that, in general, higher abundance of species belonging to a major lineage during a given interval does not correlate with higher median completeness. This is particularly true of snakes, Cenozoic iguanians, and anguoids, whose abundance is decoupled from completeness. The only major exception to this pattern is mosasaurs, which may be due to a number of different taphonomic and collections-based factors (see “Discussion”). Additionally, we observe that, with the exception of amphisbaenians and varanoids, most squamate lineages have higher median completeness scores during the Mesozoic than in the Cenozoic. These lineage-specific results broadly mirror those of the overall time-series data presented earlier (Fig. 3C,D).
Fossil squamate lineage completeness through geologic time. Heat map of epoch-level median Character Completeness Metric 2 (CCM2) for major squamate lineages, mapped onto the time-calibrated combined evidence hypothesis of squamate relationships from Simões et al. (Reference Simões, Caldwell, Tałanda, Bernardi, Palci, Vernygora, Bernardini, Mancini and Nydam2018). White horizontal bars indicate the Cretaceous–Paleogene mass extinction event (K-PG, top) and the end-Triassic mass extinction event (ETME, bottom).

Taxonomic Comparisons: Limbed Squamates
We separated out fossil species belonging to each major squamate clade, as well as groups of squamates with indeterminate phylogenetic relationships (e.g., Squamata indet.; Anguimorpha indet.; Scincomorpha indet.) and generated violin plots of their CCM2 distributions (Fig. 6). We carried out pairwise statistical comparisons between median CCM2 percentages (Mann-Whitney U) and cumulative distribution (Kolmogorov-Smirnov) of CCM2 percentages among all clades (Supplementary Tables S1, S2, Supplementary Data). We find that Mosasauria (green distribution, Fig. 6) has the highest median CCM2 value of all clades and that mosasaurs’ median CCM2 value and distribution of CCM2 scores are statistically significantly different from those of most lizard clades (exceptions: Anguimorpha indet., Gekkonomorpha, Squamata indet., Varanoidea, Monstersauria, Amphisbaenia) and snakes.
Violin plots of Character Completeness Metric 2 (CCM2) distributions for major squamate lineages, color-coded to indicate lizard (purple), snake (orange), mosasaur (green) or amphisbaenian (aqua) anatomical groups. White dot, median; black bar, interquartile range; black line, 95% confidence interval. Abbreviations: Anguimorpha indet., fossil anguimorph squamates with uncertain phylogenetic affinities; Scincomorpha indet., fossil scincomorph squamates with uncertain phylogenetic affinities; Squamata indet., fossil squamates with uncertain phylogenetic affinities.

The species within Anguimorpha indet., Gekkonomorpha, Squamata indet., Varanoidea, and Monstersauria, have median CCM2 percentages (all >20%) that are clearly higher than all other lizard groups (purple distributions, Fig. 6; 0.05 > p > α, Supplementary Data), but are not statistically significantly different. Additionally, Anguimorpha indet., Gekkonomorpha, Squamata indet., Varanoidea, and Monstersauria have a higher proportion of more complete species within their distributions than other limbed squamate groups, whose distributions are heavily skewed toward values less than 20%.
Taxonomic Comparisons: Limbless Squamates
Fossil snakes are uniquely incomplete (orange distribution, Fig. 6), with the lowest median CCM2 percentage of any squamate group and a high concentration of species with extremely low CCM2 scores. The median CCM2 and distribution shape of snakes show a statistically significant difference to virtually all other squamate clades (Supplementary Tables S1, S2, Supplementary Data). Critically, among those clades that show a statistically significant difference from snakes are amphisbaenians (aqua distribution, Fig. 6), which share a similar general body plan with snakes (reduction/loss of limbs, elongation of trunk, and increase in the number of vertebrae/ribs) but show a higher median CCM2 percentage and different distribution shape.
To investigate a potential explanation for the statistically significant differences in completeness between amphisbaenians and snakes, we quantified which parts of the skeleton were present in the specimens assigned to each described species in the dataset (Fig. 7). We found that bones from the skull and lower jaws make up 76% of fossil amphisbaenian skeletal data (Fig. 7E), whereas 91% of fossil snake skeletal data emanate from vertebrae and ribs (Fig. 7J). Because 82.11% of characters in legless squamates correspond to skull bones (Fig. 1D), amphisbaenians, which possess skulls with robust, fused bones for burrowing through substrate (Fig. 7A –D), preserve a fossil record with a higher percentage of scoreable phylogenetic characters than snakes, which for the most part possess skulls with delicate bones (Fig. 7F–H) that could be more easily destroyed via taphonomic and geologic processes over time (see “Discussion”).
Skull anatomy explains the differences in fossil record completeness in two prominent legless groups of squamates: amphisbaenians (A–E), characterized by co-fused skull bones; and snakes (F–J), characterized by delicate skull bones. A, Line drawing of an extant amphisbaenian, Rhineura floridana Baird, Reference Baird1858, with location of skull circled. B, Skull of R. floridana (UF:Herp:121174) in anterior view. C, Skull of R. floridana in right-lateral view. D, Skull of R. floridana in dorsal view. E, Stacked bar chart illustrating the frequency of occurrence of each skeletal element in the surveyed fossil record of amphisbaenians. Colors correspond to elements in B–D. Note that n = the number of skeletal elements surveyed, rather than cataloged specimens. F, Line drawing of an extant snake, Python molurus Linnaeus, Reference Linnaeus1758, with location of skull circled. G, Skull of P. molurus (UF:Herp:190353) in anterior view. H, Skull of P. molurus in right-lateral view. I, Skull of P. molurus in dorsal view. J, Stacked bar chart illustrating the frequency of occurrence of each skeletal element in the surveyed fossil record of snakes. Colors correspond to elements in G–I. Note that n = the number of skeletal elements surveyed, rather than cataloged specimens. Anatomical abbreviations: pmx, premaxilla; mx, maxilla; n, nasal; prf, prefrontal; j, jugal; sor, supraorbital; po, postorbital; f, frontal; p, parietal; st, supratemporal; v, vomer; pal, palatine; pt, pterygoid; ect, ectopterygoid; col columella; sta, stapes; q, quadrate; socc, supraoccipital; occ, occipital complex; pro, prootic; bs, basisphenoid; d, dentary; cb, compound bone; c, coronoid; an, angular. Rendered surface. stl files of specimens UF:Herp:121174 and UF:Herp:190353 are publicly available data for open download at Morphosource.org.

Completeness Differences: General Squamate Body Plans
We also wanted to explore differences in general body plan and any related effects on the preservation of phylogenetic information. We grouped all four-limbed, nonmarine squamates into a single group (“lizards”) and compared their distribution to mosasaurs, amphisbaenians, and snakes (Fig. 8A). Results from pairwise statistical comparisons (Supplementary Data S2) indicate that the fossil record of each anatomical group has a statistically significantly different median CCM2 percentage (only exception: Mosasauria compared with Amphisbaenians: p = 0.1734) and has a statistically significantly different distribution of CCM2 percentages (all p-values < 0.05, Supplementary Data). Mosasaurs exhibit the highest median CCM2 percentage (39.25%), followed by amphisbaenians (18.87%), lizards (13.59%), and snakes (4.79%) (Fig. 8A).
Fossil squamate completeness: comparisons between Character Completeness Metric 2 (CCM2) and number of specimens assigned to a species of lizard (purple), snake (orange), mosasaur (green) or amphisbaenian (aqua). A, Violin plots of CCM2 distributions for lizards, snakes, mosasaurs and amphisbaenians. White dot, median; black bar, interquartile range; black line, 95% confidence interval. B, Scatter plot illustrating the lack of a relationship between the number of specimens referred to a fossil species and corresponding CCM2 score. C, Zoomed-in scatter plot from B, illustrating the lack of a relationship between the number of specimens referred to a fossil species and corresponding CCM2 score.

Specimens Assigned to Fossil Squamate Species and Phylogenetic Completeness
We also investigated the relationship between the number of published cataloged specimens assigned to a species and the corresponding CCM2 score (Fig. 8B,C). Approximately 86% of fossil squamate species are known from 20 or less referred specimens; 284 species are known from a single holotype specimen; 116 species are known from 2 published specimens; 35 species are known from >100 referred specimens, with Coluber hungaricus Venczel, Reference Venczel1994 being represented by 3005 referred specimens (mostly vertebrae; Venczel Reference Venczel1994, Reference Venczel1998), the highest for any squamate in this dataset. Overall, we find no meaningful relationship between the number of published specimens assigned to a fossil squamate species and the number of phylogenetic characters that can be scored for that species. If we break our results down by anatomical group (Fig. 8B,C, dot colors correspond to groups in Fig. 8A), we also observe no discernible relationship between the number of published specimens referred to a species and completeness.
Substrate Lithology and Completeness
To investigate the geologic influences on fossil record completeness, we binned fossil squamate species into lithological categories from both terrestrial and marine environments and made violin plots of their CCM2 percentage distributions (Fig. 9). The lithologies with the 10 highest median CCM2 percentages predominantly emanate from low-energy depositional environments (e.g., lacustrine, lagoonal, offshore marine). Two notable exceptions are aeolian sandstone lithology, the implications of which have been discussed in a previous publication using this dataset (Woolley et al. Reference Woolley, Bottjer, Corsetti and Smith2024), and volcaniclastic sediments. Eighty-seven geologic formations contain the lithologies with the 10 highest median CCM2 values, which preserve 203 squamate species in total. The lithologies with the 11 lowest median CCM2 percentages predominantly emanate from terrestrial high-energy depositional environments (e.g., fluvial environments, coastal wave–dominant settings), as well as karstic fissure fill deposits, amber, and paleosols. There are 163 geologic formations containing these lithologies, which preserve 342 squamate species. We colored each violin plot according to the number of sampled formations that preserve the lithology in the squamate fossil record (Fig. 9). Although certain lithologies that preserve squamate fossils are found in singularly productive geologic formations (e.g., the aeolian sandstones of the Djadokhta and Baruungoyot Formations or the terrestrial phosphorites of Quercy; Woolley et al. Reference Woolley, Bottjer, Corsetti and Smith2024), the fluvial lithologies are the most common in formations that preserve squamate fossils. These lithologies, highlighted by lighter-colored violin plots, also contain a large number of squamate species (155 species total).
Effects of lithology on fossil squamate completeness. Violin plots of Character Completeness Metric 2 (CCM2) distributions for lithologies preserving squamate fossils. Plots are color-coded according to the heat map (top) that measures the ratio of number of formations containing the lithology to number of species preserved in the lithology. Lower ratios (darker colors) indicate less well sampled and/or preserved lithologies that contain higher numbers of species per sampled formation. Higher ratios (lighter colors) indicate more widespread lithologies that preserve fewer species per sampled formation. White dot, median; black/white bar, interquartile range; black/white line, 95% confidence interval.

Depositional Setting and Completeness
We also examined the distribution of different groups of squamates across all depositional environments in our survey (Fig. 10). For each squamate group (lizards, snakes, mosasaurs, and amphisbaenians; Fig. 10A–D), we removed species that did not include sufficient lithology/locality information in their descriptions (i.e., terrestrial indet.) and focused on the distribution of species found in specific depositional environments (Fig. 10E–H). For each group, the relative abundance of depositional environments differs. Unsurprisingly, the vast majority of mosasaurians are found in marine/nearshore depositional environments (Fig. 10E). The three largest proportions of species of fossil lizard are found in fluvial, lacustrine, and aeolian environments (Fig. 10F). Close to half of the sampled fossil amphisbaenians are found in fluvial settings, while three have been found in volcaniclastic environments and two have been found in lacustrine and karstic environments (Fig. 10G). The three largest proportions of species of fossil snake are found in fluvial and karstic/cave environments and marine/nearshore settings (Fig 10H).
Summary of affinities between fossil lizard, mosasaur, snake, and amphisbaenian Character Completeness Metric 2 (CCM2) distributions and depositional environment. Species without specific lithological descriptions from their respective localities (i.e., terrestrial indet.) are excluded. A, Distribution of CCM2 scores for fossil mosasaur species. Center of panel: line drawing of the holotype specimen of Taniwhasaurus oweni Caldwell et al., Reference Caldwell, Holmes, Bell and Wiffen2005 (KHM N99-1014/1-5; Caldwell et al. Reference Caldwell, Holmes, Bell and Wiffen2005), representing a median CCM2 score of 39.26%. B, Distribution of CCM2 scores for fossil lizard species. Center of panel: line drawing of the holotype specimen of Asprosaurus bibongriensis Park, Evans and Huh, 2015 (KDRC-BB4, associated skull, jaw, axial, and appendicular elements), representing the median CCM2 score of 20.91%. C, Distribution of CCM2 scores for fossil amphisbaenian species. Center of panel: line drawing of the holotype specimen of Trogonophis darelbeidae Bailon, Reference Bailon2000 (composite of INSAP AaO 2117-2120; Bailon Reference Bailon2000), representing the median CCM2 score of 18.45%. D, Distribution of CCM2 scores for fossil snake species. Center of panel: line drawing of the holotype specimen of Thaumastophis missiaeni Rage et al., 2008 (GU/RSR/VAS 1017, an isolated trunk vertebra), representing the median CCM2 score of 3.94%. E–H, Stacked bar charts illustrating the relative distribution of depositional settings containing surveyed fossil mosasaur (E), lizard (F), amphisbaenian (G), and snake (H) species. Color codes for each environment are presented in I. I, Plot illustrating mean CCM2 scores per depositional environment for fossil lizards (purple), mosasaurs (green), snakes (orange), and amphisbaenians (aqua). Modified from Woolley et al. (Reference Woolley, Bottjer, Corsetti and Smith2024).

In considering the mean CCM2 value per squamate anatomical group across depositional environments (Fig. 10I), we observe that: (1) mosasaurians exhibit relatively high mean CCM2 in all depositional environments they are found in; (2) snake fossils are found in most depositional environments, but their mean CCM2 score remains mostly below 10% for most settings; (3) fossil lizards are much more complete in “proximal” depositional settings (alluvial fans; volcaniclastic, aeolian, lacustrine) than distal/nearshore/marine environments; and (4) amphisbaenians exhibit higher mean CCM2 values in fluvial environments than the other three groups.
Discussion
Fossil Squamate Biodiversity and Sampling Processes
Our exhaustive dataset sampling the entire published squamate fossil record illustrates a recurring problem in paleobiology: how to decouple observed biodiversity from temporal preservation and sampling biases (e.g., Darwin Reference Darwin1859; Close et al. Reference Close, Benson, Alroy, Carrano, Cleary, Dunne, Mannion, Uhen and Butler2020b). Our time-series results (Fig. 3) demonstrate that our understanding of squamate species diversity and abundance through time is closely tied to temporal trends in sampled SBFs and PBDB collections. It is important to note that this dataset excludes the hundreds of thousands of unpublished squamate fossils housed in museum collections around the world, and future work to bring this “dark data” (Marshall et al. Reference Marshall, Finnegan, Clites, Holroyd, Bonuso, Cortez, Davis, Dietl, Druckenmiller and Eng2018; Dean and Thompson Reference Dean and Thompson2025) into broad paleobiological studies of squamates and their fossil record will be of critical importance moving forward. However, the current dataset demonstrates that changes in extinct squamate species richness through time closely mirror temporal changes in sampling intensity.
Toxicoferan Abundance in the Fossil Record
Although the number of squamate species through time primarily reflects sampling biases, there are still noteworthy patterns in clade-specific richness through time. The sheer number of occurrences in the fossil record of Toxicofera (Fig. 4) aligns with previous findings that illustrate heightened diversification rates in snakes (e.g., Title et al. Reference Title, Singhal, Grundler, Costa, Pyron, Colston, Grundler, Prates, Stepanova and Jones2024) and iguanians (e.g., Blankers et al. Reference Blankers, Townsend, Pepe, Reeder and Wiens2013) and previous observations of rapid global dispersal among marine mosasaurs (e.g., Simões et al. Reference Simões, Caldwell, Tałanda, Bernardi, Palci, Vernygora, Bernardini, Mancini and Nydam2018). Today, snakes and iguanians make up the largest two clades of squamates (Blankers et al. Reference Blankers, Townsend, Pepe, Reeder and Wiens2013), while snakes (number of fossil species n = 252), mosasaurs (n = 91), and iguanians (n = 86) make up the three largest groups of fossil squamates, with another toxicoferan subclade, anguoidea (n = 61), being the fourth most abundant in the fossil record. Other major squamate clades, such as scincomorphans (scincoids/cordylids), gekkonomorphs, and teiioids are long-lived and commonly found in the fossil record, but simply are not as abundant as toxicoferan clades. These basic occurrence findings suggest that the same clade-specific forcings on squamate abundance and diversity today may have been present throughout their evolutionary history. However, it is important to note that no consensus yet exists (e.g., Conrad Reference Conrad2008; Gauthier et al. Reference Gauthier, Kearney, Maisano, Rieppel and Behlke2012; Mongiardino-Koch and Gauthier Reference Mongiardino Koch and Gauthier2018; Simões et al. Reference Simões, Caldwell, Tałanda, Bernardi, Palci, Vernygora, Bernardini, Mancini and Nydam2018; Whiteside et al. Reference Whiteside, Chambi-Trowell and Benton2022) regarding the nature of early squamate evolution and the establishment of higher-level clades. This reinforces the necessity of continuing to sample key temporal gaps in the early squamate fossil record (e.g., the Triassic and Jurassic) to better address complex processes related to the group’s diversity and abundance through time.
Effects of Regional Sampling Biases on Phylogenetic Completeness
In quantifying the effects of Lagerstätte deposits on phylogenetic information in the fossil record, Woolley et al. (Reference Woolley, Bottjer, Corsetti and Smith2024) utilized the same squamate dataset used in this study to examine generalized regional sampling patterns in the squamate fossil record. Woolley et al. (Reference Woolley, Bottjer, Corsetti and Smith2024) found that statistical comparisons among sampling of landmasses were inconclusive, with the exception of the median and distribution shape of fossil squamate species found in Asia (Woolley et al. Reference Woolley, Bottjer, Corsetti and Smith2024: fig. 4, left panel). The cause for this discrepancy is almost certainly due to the presence of 50 highly phylogenetically complete lizard taxa sampled from the late Campanian Djadokhta and Baruungoyot aeolian deposits in Mongolia and China (Woolley et al. Reference Woolley, Bottjer, Corsetti and Smith2024). The lack of statistically significant differences in completeness among different landmasses suggests that regional sampling intensity does not alter the overall distribution of available phylogenetic information worldwide. However, these data show that increased sampling intensity correlates with our ability to uncover the most complete fossils. This suggests that the same taphonomic and sampling filters apply to our understanding of the fossil record regardless of sampling region, but the landmasses with the most sampled species also happen to be the landmasses with the most complete squamate fossils. The results for squamates are largely consistent with patterns observed in other global datasets (e.g., Mannion and Upchurch Reference Mannion and Upchurch2010; Brocklehurst et al. Reference Brocklehurst, Upchurch, Mannion and O’Connor2012).
Sampling Processes Are Not Reliable Predictors of Phylogenetic Completeness
When comparing temporal changes in CCM2 (Fig. 3D) to sampling processes (Fig. 3A–C), our GLS tests show that sampling processes (which, arguably, also include sampled species in this context) are not reliable predictors of the amount and availability of phylogenetic information in the squamate fossil record. This is also true of the number of published specimens assigned to a fossil species, which has no meaningful relationship to how complete the species is (Fig. 8B,C). These results are consistent with recent studies assessing character completeness in the fossil record of a variety of vertebrate groups (e.g., Mannion and Upchurch Reference Mannion and Upchurch2010; Brocklehurst and Fröbisch Reference Brocklehurst and Fröbisch2014; Brown et al. Reference Brown, Cashmore, Simmons and Butler2019; Lukic-Walter et al. 2019; Mannion et al. Reference Mannion, Chiarenza, Godoy and Cheah2019). While worker sampling effort can never be completely uncoupled from examining any pattern in the fossil record (Behrensmeyer et al. Reference Behrensmeyer, Kidwell and Gastaldo2000), the results of the present study and previous research on this dataset (Woolley et al. Reference Woolley, Bottjer, Corsetti and Smith2024) show that trends in spatial and temporal sampling intensity do not reliably predict squamate fossil record completeness.
Our interpretation of the results is not meant by any means to discourage workers from continuing to sample the fossil record for squamate fossils, even if the likelihood of finding complete non-mosasaurian squamates is low compared with other vertebrate groups, including sauropodomorph dinosaurs (Mannion and Upchurch Reference Mannion and Upchurch2010; Cashmore et al. Reference Cashmore, Mannion, Upchurch and Butler2020), ichthyosaurs (Cleary et al. Reference Cleary, Moon, Dunhill and Benton2015), parareptiles (Verrière et al. Reference Verrière, Brocklehurst and Fröbisch2016), and plesiosaurs (Tutin and Butler Reference Tutin and Butler2017). As discussed earlier, increased sampling effort will always increase the possibility of uncovering complete fossils and discoveries of new or previously overlooked patterns in the evolutionary history of an organismal group. Our findings suggest that to better understand the drivers of the amount and availability of morphological and phylogenetic information currently available in the squamate fossil record, we must examine and quantify additional factors beyond sampling.
Effects of Taxonomy/Body Plan on Phylogenetic Completeness
Each of the four anatomical groups we included in this survey (lizards, snakes, mosasaurs, and amphisbaenians) have significantly different distributions of available phylogenetic data in their fossil records (Fig. 7, Supplementary Data). This highlights the extreme morphological disparity within squamates and how that disparity lends itself to vastly different preservation of phylogenetic information. While previous studies have compared the CCM2 distributions of morphologically distinct groups of tetrapods (e.g., birds and sauropodomorph dinosaurs [Brocklehurst et al. Reference Brocklehurst, Upchurch, Mannion and O’Connor2012]; bats and a slew of other tetrapod groups [Brown et al. Reference Brown, Cashmore, Simmons and Butler2019]; squamates, Mesozoic birds, and non-avian theropod dinosaurs [Woolley et al. Reference Woolley, Bottjer, Corsetti and Smith2024]), the distributions of CCM2 values for each group are not drawn from the same set of phylogenetic characters and could influence how meaningful the comparisons between, for example, body size and completeness might be. The distributions of CCM2 values in this study are drawn from the same set of phylogenetic characters and therefore allow for meaningful comparison between different body plans.
It is not surprising that mosasaurs have a statistically significantly different median CCM2 and distribution shape than other squamate groups in this survey. Larger body size generally lends itself well to likelihood of preservation, and, anecdotally, larger fossilized bones are easier to pick out with the naked eye when surveying rock outcrop for fossils. Additionally, mosasaur fossils are found almost exclusively in marine environments (Fig. 10E), and marine conditions, particularly lower-energy offshore marine conditions, have been shown to preserve more complete vertebrate fossils (Brocklehurst et al. Reference Brocklehurst, Upchurch, Mannion and O’Connor2012; Cleary et al. Reference Cleary, Moon, Dunhill and Benton2015; Dean et al. Reference Dean, Mannion and Butler2016; Verrière et al. Reference Verrière, Brocklehurst and Fröbisch2016; Driscoll et al. Reference Driscoll, Dunhill, Stubbs and Benton2019; Schnetz et al. Reference Schnetz, Butler, Coates and Sansom2024).
Our result for mosasaurs largely mirrors the results of Driscoll et al. (Reference Driscoll, Dunhill, Stubbs and Benton2019), which examines the quality of the mosasaurid fossil record using a variety of novel completeness metrics. Driscoll et al. (Reference Driscoll, Dunhill, Stubbs and Benton2019) note that lithology plays a prominent role in the skeletal completeness of mosasaurs, with finer-grained sediments yielding more complete species than coarse-grained sediments. The vast majority of squamate fossil species found in marine lithologies belong to Mosasauroidea (Fig. 10, Supplementary Data S1), and our comparisons of marine lithology corroborate the conclusions put forward by Driscoll et al. (Reference Driscoll, Dunhill, Stubbs and Benton2019) using different metrics of fossil record completeness. In this study, marine chalks and shales showcase median CCM2 percentage and distribution shapes that are substantially higher than those of marine sandstones (Bonferroni-corrected α = 0.00018 < p < 0.05; Supplementary Data S2). This result is similar to Driscoll et al. (Reference Driscoll, Dunhill, Stubbs and Benton2019), which used a much more exhaustive dataset of both described mosasaur specimens and undescribed specimens housed in museum collections, the latter of which are not included in the present study.
Fossil lizards have a statistically significantly different median CCM2 value and distribution shape because they do not generally possess the size of their mosasaur counterparts, nor do they generally possess the limbless condition seen in snakes and amphisbaenians (very few of the sampled fossil lizard species preserve evidence of the limb-reduced/limbless condition). The lack of difference in CCM2 distributions among most lizard groups (Fig. 6) suggests that, throughout geologic time and across different clades, the typical fossil lizard is preserved in a similar way. However, there are some unique patterns among the completeness of various lizard groups and mosasaurs that we will highlight here. The lack of differences between mosasaurs, gekkonomorphs, and indeterminate squamates can likely be attributed to many mosasaurs, geckos, anguimorphs like Bahndwivici ammoskius Conrad, Reference Conrad2006, and early squamates being recovered from geologic deposits with exceptional fossil preservation (i.e., Lagerstätten; Seilacher Reference Seilacher1970; Woolley et al. Reference Woolley, Bottjer, Corsetti and Smith2024), thus preserving more anatomical and phylogenetic data. The lack of statistically significant differences between mosasaurs, varanoids, and monstersaurs can likely be attributed to the large body size achieved among many of the fossil species found in each group, making their fossilized remains both more taphonomically durable and easily spotted in workers’ collection efforts.
The difference between fossil snakes and fossil amphisbaenians is striking, because they are groups dominated by legless taxa with elongate bodies and some overlapping ecology (Fig. 7). However, a major explanation for the much higher median CCM2 value for amphisbaenians lies in their skull anatomy (Fig. 7B–D). Amphisbaenians possess highly modified skulls for burrowing (e.g., Webb et al. Reference Webb, Shine, Branch and Harlow2000), such that many bones are fused together to form a hardened surface useful in digging through substrate. The fusion of skull elements increases functional durability in life and also increases preservational potential in the fossil record such that 76% of published fossil amphisbaenian skeletal elements (total = 1635; Fig. 7E) are from the skull and lower jaws. Because the skull is such a phylogenetic character-dense region (Fig. 1D), the fossil record of amphisbaenians, with their increased preservation potential of the skull, is significantly more complete than the record of snakes. Snakes, on the other hand, generally possess skulls with thin, gracile elements (Fig. 7F–I) that accommodate, in many cases, flexible jaws for swallowing prey and a large olfactory complex for foraging (e.g., Da Silva et al. Reference Da Silva, Fabre, Savriama, Ollonen, Mahlow, Herrel, Müller and Di-Poï2018). The large number of delicate bones in the skull decreases their preservation potential as fossils, and as a result, 91% of the snake fossil record is represented by vertebrae and ribs, with comparatively few skull elements (Fig. 7J). In fact, less than a quarter of fossil snake species (60 out of 252) are preserved with skull elements at all, placing severe limits on maximum scorable phylogenetic characters for the group as a whole. In sum, even though snakes and amphisbaenians largely share the same type of body plan, their respective skull anatomy is a major driver of the differences observed.
Effects of Lithology on Phylogenetic Completeness
Fine-grained sediments (e.g., shales, chalks, limestones, siltstones, fine-grained aeolian sandstone, ashfall deposits) tend to preserve the most complete squamate fossils (Fig. 9), whereas coarse-grained sediments (e.g., conglomerates, sandstones, cave deposits, fissure fills, marls) preserve overall less complete fossils. These patterns show that squamate fossil completeness is subject to the same general depositional energy forcings (Behrensmeyer et al. Reference Behrensmeyer, Kidwell and Gastaldo2000) as other groups of vertebrates (Mannion and Upchurch Reference Mannion and Upchurch2010; Brocklehurst et al. Reference Brocklehurst, Upchurch, Mannion and O’Connor2012; Walther and Fröbisch Reference Walther and Fröbisch2013; Brocklehurst and Fröbisch Reference Brocklehurst and Fröbisch2014; Cleary et al. Reference Cleary, Moon, Dunhill and Benton2015; Dean et al. Reference Dean, Mannion and Butler2016; Verrière et al. Reference Verrière, Brocklehurst and Fröbisch2016; Davies et al. Reference Davies, Bell, Goswami and Halliday2017; Tutin and Butler Reference Tutin and Butler2017; Brown et al. Reference Brown, Cashmore, Simmons and Butler2019; Cashmore and Butler Reference Cashmore and Butler2019; Driscoll et al. Reference Driscoll, Dunhill, Stubbs and Benton2019; Lukic-Walther et al. Reference Lukic-Walther, Brocklehurst, Kammerer and Fröbisch2019; Mannion et al. Reference Mannion, Chiarenza, Godoy and Cheah2019; Cashmore et al. Reference Cashmore, Mannion, Upchurch and Butler2020; Varnham et al. Reference Varnham, Mannion and Kammerer2021; Schnetz et al. Reference Schnetz, Butler, Coates and Sansom2022, Reference Schnetz, Butler, Coates and Sansom2024) as well as invertebrate groups with multielement fossil records such as echinoids (Thompson et al. Reference Thompson, Dean, Ford and Ewin2025). However, even lithologies with low median completeness (e.g., paleosols, fluvial sandstones, claystones, fluvial mudstones; Fig. 9) can occasionally preserve highly complete squamate species, particularly if an increased number of formations and species are sampled. As with regional sampling intensity (Woolley et al. Reference Woolley, Bottjer, Corsetti and Smith2024), these results show that increasing sample sizes may increase the likelihood of recovering a highly complete fossil, even if the distribution still skews heavily toward incomplete species.
Effects of Depositional Setting on Phylogenetic Completeness
Broadly, we observe that marine environments, which preserve mostly mosasaurs but also some species of snakes and lizards (Fig. 10), on average preserve higher amounts of phylogenetic data than in the terrestrial realm (Fig. 9). This observation is in keeping with previous assessments of fossil record quality through time (Foote and Sepkoski Reference Foote and Sepkoski1999; Behrensmeyer et al. Reference Behrensmeyer, Kidwell and Gastaldo2000; Kidwell and Holland Reference Kidwell and Holland2002; Close et al. Reference Close, Benson, Saupe, Clapham and Butler2020a,Reference Close, Benson, Alroy, Carrano, Cleary, Dunne, Mannion, Uhen and Butlerb). Detailed categorization of the terrestrial squamate fossil record, however, allows us to tease apart trends that affect the preservation of squamate phylogenetic information on land. Woolley et al. (Reference Woolley, Bottjer, Corsetti and Smith2024) found with the dataset used in this study that the aeolian environments of the Late Cretaceous Djadokhta and Baruungoyot Formations in Mongolia provide a disproportionate amount of skeletal and phylogenetic information such that it affects the completeness of the squamate fossil record on a global level. Lacustrine shales preserve the most complete squamate fossils (Fig. 9), thus illustrating that aspects of the terrestrial fossil record of squamates can preserve higher amounts of phylogenetic information than the marine fossil record of squamates.
Another observed statistically significant difference is in the distribution of CCM2 scores between low-energy, hypersaline/anoxic depositional environments (lacustrine, coastal lagoon) and high-energy fluvial channel environments (Supplementary Data S2). These differences are better explained by geologic factors than by skewed taxonomic affinity. Both lizards and snakes are found in abundance in all three of these depositional settings (Fig. 10I), and therefore any differences cannot be attributed to an overrepresentation of one group over another. Coastal lagoon and lacustrine depositional settings preserve more complete lizard and snake fossils (lagoon lizard mean CCM2 = 31.8%; lagoon snake mean CCM2 = 23.7%; lacustrine lizard mean CCM2 = 38.0%; lacustrine snake mean CCM2 = 19.8%) than in fluvial channel settings (fluvial channel lizard mean CCM2 = 20.6%). These results are consistent with previous generalized observations about the quality of the fossil record of lizards and snakes (Nydam et al. Reference Nydam, Caldwell and Fanti2010; Nydam Reference Nydam2013; Rage Reference Rage2013), in that taxa found in fluvial settings tend to be highly incomplete compared with their lagoonal/lacustrine counterparts.
As highlighted in Figure 10I, the completeness of the lizard fossil record appears to increase from more distal nonmarine deposits (estuary/marsh, mire/swamp, fluvial environments) to more proximal (alluvial fan, volcaniclastic, aeolian settings). This illustrates the role that transport plays in the completeness of vertebrate fossils (Behrensmeyer Reference Behrensmeyer1982), in that the further an individual’s remains are transported, the preservation potential accordingly decreases. The uniquely incomplete fossil record of snakes and the unusually complete record of the limbless amphisbaenians also show modest increases in completeness in more proximal terrestrial settings, but nowhere near as pronounced as in lizards.
The Roles of Megabiases as Determinants of Phylogenetic Information Content in Fossil Squamates
Given the patterns observed earlier, what exactly are the megabiases at play in the distortion of fossil information in the squamate fossil record? Here, we propose three core megabiases that serve as major constraints on phylogenetic completeness of squamate species through time, and briefly discuss their implications.
First-Order Megabias: Durability of Anatomical Elements in Fossil Squamate Species.
This is a three-pronged issue, related to the “input” principle outlined in Behrensmeyer et al. (Reference Behrensmeyer, Kidwell and Gastaldo2000), which includes larger body size, fusion of elements, and/or preferential preservation of enamel/dentine being key factors in preservation potential. Fossil squamates with larger body sizes, such as mosasaurs, varanoids, and monstersaurs (Figs. 6, 7A), tend to have more phylogenetic information available because: (1) higher skeletal volume is more resistant to biotic (e.g., scavenging) and abiotic (e.g., erosion, abrasion) taphonomic factors (Behrensmeyer et al. Reference Behrensmeyer, Kidwell and Gastaldo2000); and (2) larger fossil specimens are easier for workers to identify with the naked eye in rock outcrop, increasing the likelihood of collection. For squamates, the most frequently occurring skeletal elements are vertebrae, co-fused parietals, and marginal tooth-bearing bones (e.g., premaxilla, maxilla, dentary; Woolley et al. Reference Woolley, Thompson, Wu, Bottjer and Smith2022), and this perhaps plays a major role in workers’ phylogenetic character sampling across the squamate skeleton (Fig. 1), with the parietal, dentary, and maxillae being the most character-dense skeletal elements (Supplemental Information). Because limb loss is such a prominent recurring feature in squamate macroevolution, workers are left with no choice but to emphasize shared skeletal features between legless and legged squamates (i.e., the skull). Addressing the relative scarcity of vertebral characters in broad-scale assessments of squamate phylogenetic relationships by scrutinizing external and internal vertebral characteristics may help in maximizing the anatomical information in the fossil record of squamates.
Second-Order Megabias: Geologic Bias.
As highlighted earlier, depositional energy (i.e., lithology; Fig. 9) and environment (Fig. 10) play key roles in the completeness of squamate species. The marine record of squamates is on average more complete than the nonmarine (Fig. 10I), and transport distance in nonmarine settings appears to play a significant role in decreasing preservation potential of anatomical and phylogenetic information. Furthermore, Lagerstätte deposits almost exclusively preserve the most complete squamate fossils, although Lagerstätte species make up a minority of total data (162 out of 795, or 20.4% of squamate species are found in Lagerstätte deposits). Compared with baseline geologic deposits, squamate-bearing Lagerstätte deposits are relatively uncommon through time (Fig. 11A). However, in this dataset, we observe that there is higher prevalence of Lagerstätte deposits in the Mesozoic than during the Cenozoic. The higher prevalence of highly productive and complete Lagerstätte deposits in the Mesozoic leads to a higher median CCM2 value for Mesozoic species (blue distributions, Fig. 11B) compared with Cenozoic species (yellow distributions, Fig. 11B). If we remove squamates found in Lagerstätte deposits from the dataset (Fig. 11B), we find that the median CCM2 score and distribution of CCM2 values from the Mesozoic are statistically indistinguishable from those of the Cenozoic (Supplementary Data S2). Additionally, although there are 66 squamates found in Cenozoic Lagerstätte deposits (Fig. 11B), incomplete squamate fossils are far more common in baseline sedimentary systems, such that there is less of a “Lagerstätten effect” (Benton et al. Reference Benton, Donovan, Paul, Donovan and Paul1998; Behrensmeyer et al. Reference Behrensmeyer, Kidwell and Gastaldo2000; Kidwell and Holland Reference Kidwell and Holland2002; Alroy et al. Reference Alroy, Aberhan, Bottjer, Foote, Fürsich, Harries, Hendy, Holland, Ivany and Kiessling2008; Woolley et al. Reference Woolley, Bottjer, Corsetti and Smith2024) on their completeness than in the Mesozoic. Thus, through geologic time, the squamate fossil record can potentially be divided into two “megataphonomic” regimes (Benton et al. Reference Benton, Donovan, Paul, Donovan and Paul1998; Behrensmeyer et al. Reference Behrensmeyer, Kidwell and Gastaldo2000): (1) the Mesozoic “Lagerstätten-dominant” regime, in which most of our detailed knowledge of squamate anatomy and biodiversity is filtered through deposits of exceptional fossil preservation sprinkled through the Jurassic and Cretaceous; and (2) the Cenozoic “baseline-dominant” regime, in which most of our understanding of squamate anatomy and diversity is filtered through baseline sedimentary and taphonomic processes. Mannion et al. (Reference Mannion, Chiarenza, Godoy and Cheah2019) found similar results with the Phanerozoic record of crocodylomorphs, in which the average completeness was higher in the Mesozoic than in the Cenozoic, in part due to Lagerstätte deposits like the Crato Formation of Brazil and the presence of marine forms such as the thalattosuchians, which are commonly found in marine Lagerstätte deposits (Mannion et al. Reference Mannion, Chiarenza, Godoy and Cheah2019), similar to mosasaurs. Further study on tetrapod groups that are present in both the Mesozoic and Cenozoic (e.g., Lissamphibia, Aves, Mammalia) might offer further clarification on this shared pattern between squamates and crocodylomorphs.
Effects of Lagerstätte deposits on squamate phylogenetic information through time. A, Time-series distribution of the number of squamate-bearing Lagerstätte deposits through geologic time. Dark gray vertical bars indicate the Cretaceous–Paleogene mass extinction event (K-PG, right) and the end-Triassic mass extinction (ETME, left). B, The Lagerstätte effect on phylogenetic information in the Mesozoic and Cenozoic eras. Blue: comparison of squamate Character Completeness Metric 2 (CCM2) distributions in the Mesozoic Era without (top) and with (bottom) Lagerstätte deposits. Yellow: comparison of squamate CCM2 distributions in the Cenozoic Era without (top) and with (bottom) Lagerstätte deposits. The median CCM2 score and shape of the CCM2 distribution in the Mesozoic without Lagerstätte deposits is not statistically different from those seen in the Cenozoic, illustrating a Lagerstätte effect on squamate phylogenetic information earlier in their evolutionary history.

Third-Order Megabias: Sampling Intensity.
In the fossil record of squamates, there is no strong relationship between proxies for sampling intensity (e.g., SBFs, PBDB collections, species, specimens per species) and the amount of available phylogenetic information. These results illustrate a distinctive order of events in terms of the megabiases at play with the quantity of phylogenetic information in the squamate fossil record. Here, natural processes related to anatomy and sedimentology have done the majority of sample filtering (Behrensmeyer et al. Reference Behrensmeyer, Kidwell and Gastaldo2000), such that when research begins, rectifying an incomplete squamate fossil record writ large cannot necessarily be achieved by increased sampling intensity. All is not lost, however. What we do find is that the most intensely sampled landmasses (Woolley et al. Reference Woolley, Bottjer, Corsetti and Smith2024) include some of the most complete squamate fossils, even if there is no statistically significant difference between overall CCM2 distributions. Therefore, in order to maximize the potential of the squamate fossil record to resolve long-standing disputes in higher-level evolutionary relationships, we must continue to collect novel data from undersampled geographic regions. Additionally, it may be beneficial to target overlooked sedimentological regimes (e.g., desert sand dune deposits; Woolley et al. Reference Woolley, Bottjer, Corsetti and Smith2024) for novel species. Finally, continuing to sample the earliest time periods of squamate evolutionary history in the Triassic and Jurassic remains critical to reconstructing the complex origins of one of the most diverse groups of animals on the planet.
Conclusion
Understanding temporal, spatial, geologic, and anatomical biases that contribute to nature of the fossil record is crucial to reconstructing biodiversity in the recent and distant past. In describing patterns in the completeness of the fossil record of squamates, we have been able to quantify the effects of anatomical biases, geologic bias, and sampling intensity on our ability to reconstruct the phylogeny of extinct members of a massive component of the modern fauna. Overall, this study found no meaningful relationship between various metrics of temporal sampling intensity and fossil record completeness, nor did this study find any relationship between the number of sampled specimens assigned to a species and species completeness. These results suggest that a specific order of major anatomical and geologic filters exists before processes related to sampling intensity: (1) anatomical “input” related to body size, form, and fusion of bones; and (2) lithological and depositional biases, including prevalence of squamate-bearing Lagerstätte deposits in the Mesozoic compared with the Cenozoic.
Despite these constraints, targeted increases in spatial and temporal sampling intensity of squamate fossils remain the best method of rectifying the megabiases quantified here. In particular, the temporal discontinuity of the squamate fossil record early in the group’s evolutionary history (Triassic–Jurassic) continues to obscure our understanding of a critical time interval of morphological trait evolution and diversification. Additional work sampling time intervals immediately following mass extinction intervals (Early Jurassic, Paleocene) can also elucidate the underlying evolutionary mechanisms of survivorship among squamates during times of great ecological stress. In sum, although our efforts to ameliorate the completeness of the squamate fossil record may ultimately be hampered by anatomical and taphonomic megabiases, hidden discoveries still hold the key to understanding the rise and resiliency of one of most successful groups of vertebrates to walk, slither, and swim the planet.
Acknowledgments
We would like to thank J. Thompson (University of Southampton), Y. H. Wu (Natural History Museum of Los Angeles County), F. Corsetti (University of Southern California), L. Chiappe (Natural History Museum of Los Angeles County), and A. Huttenlocker (University of Southern California) and D. DeMar (University of Washington) for thoughtful discussion and support for this project. Additionally, we would like to thank Paleobiology editor N. Campione, associate editor A. Dunhill, and reviewer M. Caldwell, with a special thanks to reviewer C. Dean, for their extremely helpful feedback and comments that greatly augmented the quality of this article. C.H.W. was supported by National Science Foundation EAR-PF 2305564, the Richard Estes Memorial Grant from the Society of Vertebrate Paleontology, the Theodore Roosevelt Memorial Grant from the American Museum of Natural History, as well as the National Science Foundation EAR 1647841 and ANT 1341475 (to N.D.S.).
Competing Interests
The authors declare no conflicts of interest.
Data Availability Statement
Data available from the Dryad Digital Repository: https://doi.org/10.5061/dryad.hhmgqnktp.
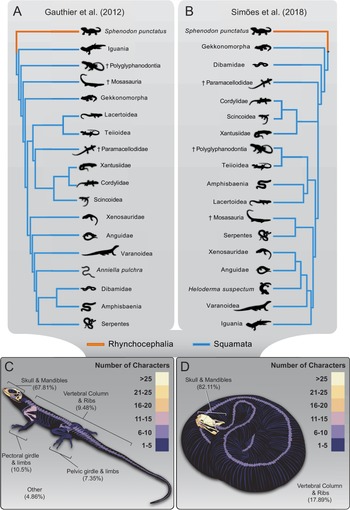
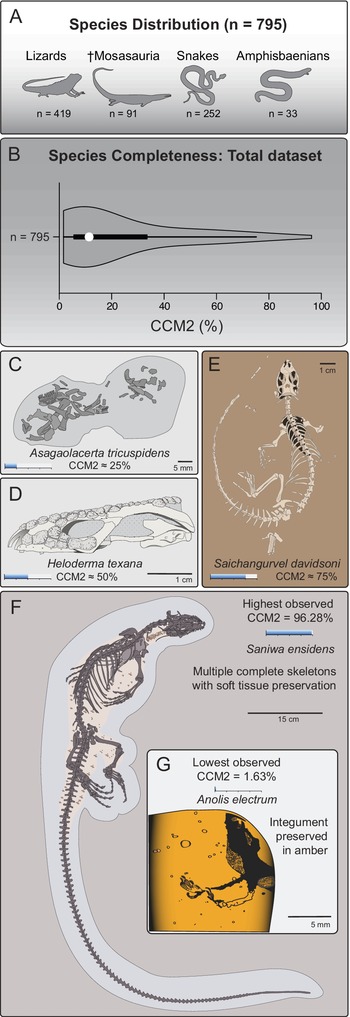


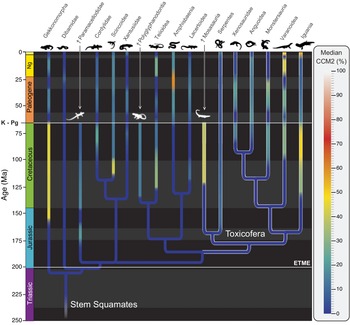


 Open access