

In recent decades, consumption of sugar-sweetened beverages (SSB) has steadily increased in parallel with the rising prevalence of obesity in the USA( Reference French, Lin and Guthrie 1 – Reference Ogden, Carroll and Kit 3 ). SSB such as non-diet sodas, fruit drinks, sports drinks and energy drinks are commercially available beverages that contain variable, but relatively high amounts of added caloric sweeteners( Reference Malik, Schulz and Hu 2 ). Due to growing recognition of the association between excess SSB consumption and the obesity epidemic( Reference Ludwig, Peterson and Gortmaker 4 , Reference Vartanian, Schwartz and Brownell 5 ), there has been increased national as well as local interest in developing broad-reaching strategies that address this public health problem, especially in at-risk urban populations( Reference Andreyeva, Chaloupka and Brownell 6 – Reference Skov, Lourenço and Hansen 9 ).
Like many US communities, excess SSB consumption is prevalent among both children and adults in Los Angeles County (LAC). In 2011, more than one-third of children aged 0–17 years (38 %) and adults aged ≥18 years (35 %) reported drinking at least one SSB per day( 10 ). According to the American Heart Association, SSB consumption should be far less than one per day( Reference Johnson, Appel and Brands 11 ). Assuming that the average SSB is 12–20 fl oz (355–591 ml; i.e. the typical size of a can or plastic soda bottle commonly sold in stores), persons who consume one SSB per day can easily consume 84–140 fl oz (2·48–4·14 litres) of sugary beverages per week.
To address this public health problem, the Los Angeles County Department of Public Health recently invested in and implemented a number of multi-modal approaches designed to reduce SSB consumption at the local level (2010–present). These targeted strategies included (but were not limited to) institutional food procurement policies( Reference Robles, Wood and Kimmons 8 ); establishment of healthy choice architecture in cafeterias (e.g. restructuring food environments through various mechanisms such as product placement and menu labelling at the point of purchase to influence consumer food selection)( Reference Skov, Lourenço and Hansen 9 ); and the use of health marketing to educate the public on topics related to healthy eating( Reference Barragan, Noller and Robles 12 ). Health marketing, in particular, has been identified by the Los Angeles County Department of Public Health as a promising intervention that can have broad population reach in LAC. It is defined by the Centers for Disease Control and Prevention as ‘creating, communicating, and delivering health information and interventions using consumer-centered and science-based strategies to protect and promote the health of diverse populations’( 13 ).
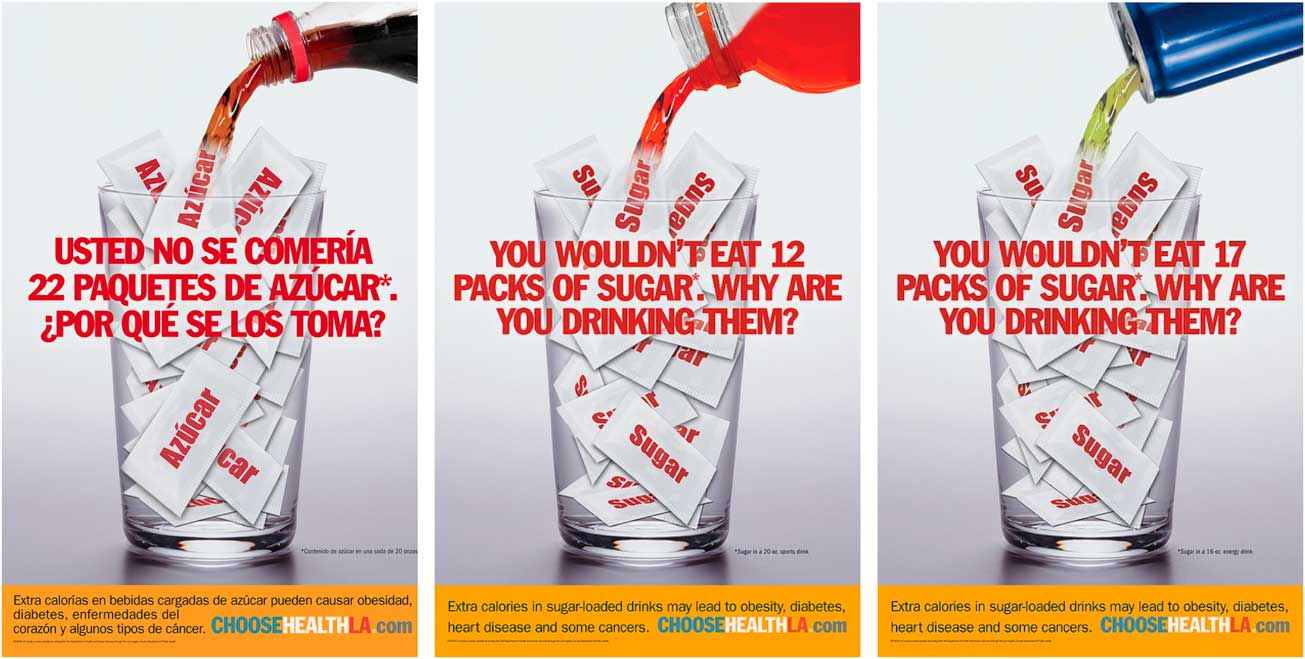
In early 2012, the Los Angeles County Department of Public Health launched paid media advertisements (ads) of the Choose Health LA ‘Sugar Pack’ health marketing campaign to educate and encourage county residents to reduce SSB consumption. Adapted from a prior 2009 SSB-focused health marketing effort in New York City( 14 ), the ‘Sugar Pack’ campaign focused on a singular message accompanied by stark creative visuals designed to grab public attention( Reference Barragan, Noller and Robles 12 ). Examples of these campaign ads are presented in Fig. 1.
(colour online) Choose Health LA ‘Sugar Pack’ health marketing campaign advertisements
The present study assessed the association between the amount of non-diet soda consumed and self-reported intention to reduce soda consumption among adults who were exposed to this ‘Sugar Pack’ campaign. To date, a paucity of studies have examined self-reported intention to reduce soda consumption using surveillance benchmarks (e.g. <1 soda/d, lower/moderate consumption v. ≥1 soda/d, excess/heavy consumption) commonly used by public health to track sugary drink consumption frequency in the population( 10 , 15 , 16 ). To help address this gap in the literature, we examined differences in intention to reduce soda consumption among two groups of adults who saw the campaign ads: those who consumed 1–6 sodas/week (moderate consumers) and those who consumed ≥1 soda/d (heavy consumers). The study analyses presented herein focus specifically on soda consumption because non-diet soda is the most heavily consumed sugary beverage among US youth and adults( Reference Kit, Fakhouri and Park 17 ). To fill in gaps in the literature, we also assessed self-reported intention among other subgroups by sociodemographic (i.e. sex, age, race/ethnicity, educational attainment) and other characteristics (i.e. weight status, health knowledge and attitudes).
Methods
Campaign development and dissemination
The ‘Sugar Pack’ campaign ads focused on creative concepts designed to educate target populations about the high quantity of sugar contained in the following: (i) a generic 20 fl oz (591 ml) bottled soda; (ii) a generic 20 fl oz sports drink; and (iii) a generic 16 fl oz (473 ml) energy drink (Fig. 1). The soda ad depicted a generic soda bottle pouring sugar packets into a clear drinking glass (i.e. one filled to the brim with packets) and used a large bold font to highlight the core message: ‘You wouldn’t eat 22 packs of sugar. Why are you drinking them?’ A secondary message, ‘Extra calories in sugar and sugar-loaded drinks may lead to obesity, diabetes, heart disease and some cancers’, was included as part of the visual to reinforce awareness of adverse health consequences associated with excess SSB consumption. The ads for sports and energy drinks followed a similar format. In 2012, ads (available in both English and Spanish) were placed in the highest-need areas of LAC; that is, low-income areas with high overweight and obesity prevalence( Reference Barragan, Noller and Robles 12 ). While the ads of all creative concepts were showcased through various channels including the Los Angeles County Metropolitan Transportation Authority (‘Metro’) bus televisions, the Choose Health LA website (www.choosehealthla.com) and through social media (i.e. Twitter, Facebook, YouTube, sendable e-cards), the soda visual was the most disseminated ad in the bus and railway systems during February–March 2012( Reference Barragan, Noller and Robles 12 ).
Study design
A cross-sectional street-intercept survey of LAC residents was conducted to assess knowledge, attitudes, SSB consumption behaviours and intention to reduce soda and/or other sugary drinks after exposure to the ‘Sugar Pack’ campaign. Data collection took place between 4 June and 12 June 2012 at three pre-selected Metro bus shelters and/or rail stops, all with high foot traffic. At each location, three to five trained staff and/or interns from the Los Angeles County Department of Public Health systematically approached prospective survey respondents during pre-determined shifts: 12.00–15.00 hours and 15.00–17.00 hours, Monday to Friday. Locations and shifts were selected based on prior observations of the Metro stops and times with high peak volume of riders. In total, twelve Los Angeles County Department of Public Health staff and five interns were trained and participated in data collection activities.
Study population
The study population comprised riders of the region’s Metro buses and railways. This group was selected because it was the intended audience of the ‘Sugar Pack’ campaign; a large portion of the campaign comprised paid outdoor media on back and/or side of buses, bus shelters, billboards, and in the subway. Many of the Metro riders were from low-income areas of LAC, where there is high prevalence of overweight and obesity. According to statistics from the paid media vendor, about half of the riders of the Metro Red Line (i.e. one of the subway routes that had stops in one of the three survey locations) came from households making less than $US 50 000 per annum (49·8 %); nearly half of them had a high-school education or less (46·2 %); and a large proportion were Hispanic (43·5 %)( 18 ).
To be eligible for the survey, respondents had to be a county resident, at least 18 years of age, speak English or Spanish, be willing and able to complete the administered survey, and not be pregnant. The latter was considered an exclusion criterion because weight status and nutritional requirements differ during pregnancy. An incentive in the form of a plastic water bottle was provided to all respondents who completed or partially completed the survey.
Instruments
A one-page, fifteen-item street-intercept survey instrument was verbally administered to each respondent. Each survey took approximately 5–10 min to complete. The survey instrument collected demographic information, public transportation use, SSB consumption behaviours, attitudes towards the health effects of excess SSB consumption, awareness of sugar content in soda and other popular SSB, awareness of daily nutrient recommendations, awareness of the ‘Sugar Pack’ soda ad, and intention to reduce soda consumption and other sugary beverages as a result of seeing the ad. Additionally, a population-tracking tool was developed and used to provide context and account for duration of the recruitment period and volume of foot traffic at each location during each data collection shift. The tool collected information on sex, age, weight status and race/ethnicity of the Metro riders. Location coordinators completed the tool during the first 30 min of their assigned data collection shift; they stood in a pre-selected area and used a handheld tally counter to estimate the total number of persons walking within a 15 ft (4·57 m) radius of the selected Metro stop.
Measures
Outcome and campaign exposure
The primary outcome variable, intention to reduce soda consumption, was selected as a proxy to reflect downstream health behaviour change. Results from impact evaluation of a number of public education campaigns lend support to the utility of this variable, which connects intention to change to cognitive or emotional response after exposure to visual and content stimuli( Reference Armitage and Conner 19 – Reference Yzer 24 ). A recent study of health marketing exposure and SSB consumption utilized a similar framework( Reference Jordan, Piotrowski and Bleakley 25 ). To measure the outcome variable, respondents who reported seeing the ‘Sugar Pack’ ads were asked: ‘As a result of seeing these advertisements, how likely are you on a scale of 1 to 5 (1=not likely, 5=very likely) to reduce the number of soda or other sugary drinks you drink per day?’ While this question asked about other sugary beverages beyond soda, all cases included in the final analysis referred to soda consumption only, based on the following: (i) the soda ad in the ‘Sugar Pack’ campaign was the most widely disseminated visual during the bus/railway portion of the health marketing effort; (ii) the soda ad creative was presented as a visual to aid the respondent in answering the questions regarding the campaign; and (iii) only respondents exposed to the soda ad were asked to respond to the ‘intention’ question (outcome).
Exposure to the campaign was assessed with the question, ‘In the past 2 months, have you seen (the ‘Sugar Pack’ soda ad) when you: (i) take the bus (either inside or outside); (ii) take the subway (either inside or outside); (iii) have seen a video version of this advertisement when you ride the bus; and/or (iv) have seen these ads on backs of buses or bus stops?’ Field staff were instructed to ask respondents about their exposure to the ‘Sugar Pack’ soda ad while simultaneously showing them a printed copy of the English version of the soda visual (pasted on the back of each staff member’s clipboard). Respondents were classified as ‘exposed’ if they responded ‘yes’ to having seen the ad on the bus, subway, a video on the subway/bus television channel (i.e. Metro TV) and/or on the backs of buses or bus stops, and/or if they answered the intention question during the street-intercept survey.
Primary regressor: consumption of non-diet soda
Respondents were asked an open-ended question: ‘How often do you drink regular soda (not diet)?’ Respondents answered in daily, weekly or monthly totals, which were subsequently converted into daily and weekly consumption rates (‘per day’, ‘per week’). Based on information from behavioural surveillance and public health practice, respondents were classified as: those who consumed between 1 and 6 sodas/week (moderate consumers) and those who consumed ≥1 soda/d (heavy consumers). These cut-off points were informed by previous benchmarks or questions in population surveys( 10 , 15 , 16 ) and by population health research in this subject area( Reference Johnson, Appel and Brands 11 , Reference Simon, Lightstone and Baldwin 26 – Reference Babey, Wolstein and Diamant 28 ).
Covariates
Sociodemographic characteristics
Sociodemographic characteristics as self-reported by respondents included: (i) four levels of educational attainment (less than high school, high-school graduate, some college or college graduate); (ii) race/ethnicity, self-identified as White, Black, Asian, Hispanic or ‘Other’ (the latter includes respondents who indicated American Indian or mixed racial origins); and (iii) four age categories (18–24, 25–44, 45–64 and ≥65 years). Weight status (underweight/normal or overweight/obese) and sex (male or female) were observed and classified by the field staff.
Perceived harm of soda and other sugary drinks
Respondents were asked to indicate whether they strongly agreed, agreed, disagreed or strongly disagreed with the following statement: ‘Drinking regular soda (not diet) and other sugary drinks such as energy/sports drinks can increase one’s risk for obesity and related diseases such as heart disease and diabetes.’ Responses were collapsed into two categories: (i) ‘perceived soda and other sugary drinks as harmful’ if respondent indicated they strongly agreed or agreed with the statement; and (ii) ‘did not perceive soda and other sugary drinks as harmful’ if respondent disagreed or strongly disagreed with the statement.
Knowledge of daily energy recommendations
Respondents were asked an open-ended question: ‘In general, how many calories is a healthy adult supposed to consume each day?’ Responses were provided as whole-number values which were then dichotomized into the following groups: respondents who ‘correctly identified energy needs’ v. respondents who ‘incorrectly identified energy needs’. While daily energy needs vary by age, gender and physical activity level, the 2010 Dietary Guidelines for Americans recommend a range of 1600–2400 kcal (‘calories’; 6694–10 042 kJ) for adult women and 2000–3000 kcal (8368–12 552 kJ) for adult men( 29 ). Using these guidelines, responses between 1600 and 3000 kcal (6694 and 12 552 kJ) were classified as within the correct energy range. Responses <1600 kcal (<6694 kJ), >3000 kcal (<12 552 kJ) or ‘don’t know’ were classified as being in the incorrect energy range. These cut-off ranges were informed by and align with a previous analysis by Gase et al., which used the same data set as in the present study( Reference Gase, Robles and Barragan 30 ).
Data analysis
Descriptive and univariate analyses were performed for each variable. Selection of key variables for inclusion in the multivariable regression analysis was carried out in part based on statistical considerations and reviews of the literature on plausible pathways to health behaviour change( Reference Fishbein 21 ). To examine the relationship between the amount of soda consumed and the intention to reduce soda consumption, a multivariable logistic regression model was constructed; because data were collected at three different Metro locations known to have high-volume foot traffic, this model included the use of the ‘cluster’ option in Stata to correct for standard error. This model explored the associations between the two variables (former=primary regressor; latter=outcome variable), adjusting for covariates such as sociodemographic characteristics, weight status, perceived harm of soda and knowledge of daily energy recommendations.
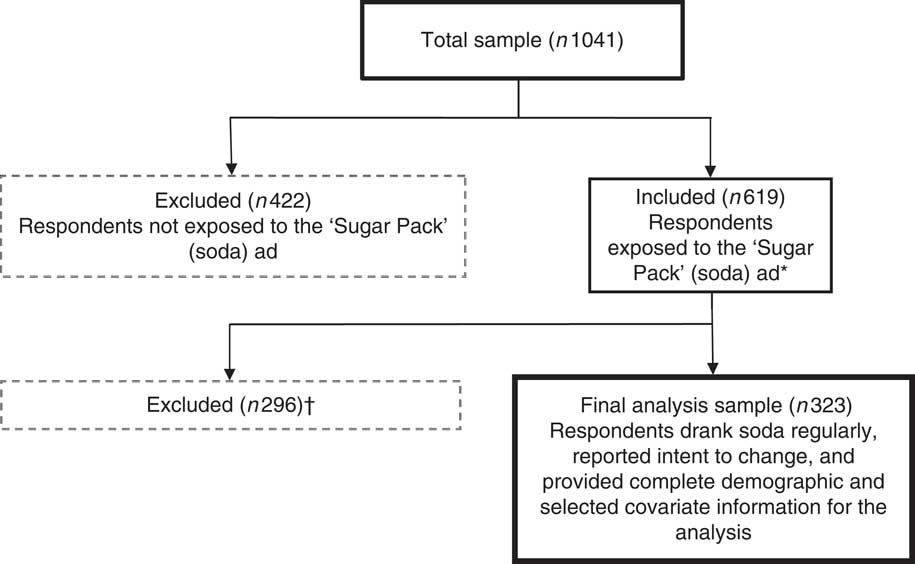
The multivariable logistic regression analysis was conducted using a sub-sample (n 323) extracted from the 1041 total respondent pool. The selection process of this sub-sample was carried out as follows. Survey respondents were first collapsed into two groups: those exposed to the ads (n 619) and those not exposed to the ads (n 422). A respondent was classified as ‘exposed’ if he/she indicated having seen the soda ad at least once on the bus, on the subway, on Metro television and/or on the exterior of buses/railways. A respondent was also classified as ‘exposed’ if he/she answered the intention question during the street-intercept survey. A respondent was classified as ‘unexposed’ if he/she did not indicate having previously seen the ad and/or failed to respond to the intention question. From the ‘exposed’ group, respondents who did not report drinking non-diet soda, did not provide complete demographic information (sex, age, race/ethnicity, education) and/or had missing responses to the key covariates of interest were excluded (n 296). The final sub-sample (analysis sample) comprised 323 respondents. Figure 2 depicts a flow diagram of this selection process.
Flow diagram of the analysis sample selection process. *Respondents were classified as exposed to the ‘Sugar Pack’ soda advertisement (ad) if they answered ‘yes’ to having seen the ad on the bus, subway, a video version on bus/subway television and/or on backs of buses or bus stops, and/or if they answered the intention question during the street-intercept survey. †Exclusion criteria (not mutually exclusive). Respondents were excluded from the final analysis sample if they: (i) did not drink regular soda/had missing response to question on soda consumption (n 219); (ii) were missing a response to the intention to change (reduce soda consumption) question (n 181); (iii) did not provide complete demographic information for the analysis (n 80); and/or (iv) were missing responses to other covariates included in the multivariable logistic regression model (n 5)
Statistical analyses were conducted using the statistical software package Stata version 12·1. All study protocols and materials were reviewed and approved by the Los Angeles County Department of Public Health Institutional Review Board prior to fieldwork.
Results
Among those approached during the street-intercept survey, 56 % responded and completed the verbally administered interview. Respondent characteristics for the entire sample (n 1041), those exposed (n 619) and those not exposed (n 422) to the soda ads are summarized in Table 1. Among those exposed to the campaign, approximately 46 % were female, 41 % were between the ages of 25 and 44 years, more than 36 % were high-school graduates or less, and about 65 % reported drinking at least one soda per week. In the multivariable model that controlled for clustering and covariates (Table 2), the odds of moderate consumers (i.e. respondents who reported drinking 1–6 sodas/week) reporting ‘likely’ or ‘very likely’ to reduce their non-diet soda consumption was 1·95 times (95% CI 1·44, 2·65) that of heavy consumers (i.e. respondents who consumed ≥1 soda/d). Similarly, the adjusted odds of respondents with less than a high-school education reporting ‘likely’ or ‘very likely’ to reduce their non-diet soda consumption was 1·82 times (95% CI 1·16, 2·86) that of respondents who graduated from college. The adjusted odds of respondents who perceived consumption of soda and other sugary beverages as harmful reporting ‘likely’ or ‘very likely’ to reduce their non-diet soda consumption was 2·14 times (95% CI 1·24, 3·70) that of respondents who did not. In contrast, the adjusted odds of respondents aged ≥65 years reporting ‘likely’ or ‘very likely’ to reduce their non-diet soda consumption was 0·39 times (95% CI 0·23, 0·64) that of younger respondents aged 18–24 years.
Characteristics of survey respondents by health marketing campaign advertisement (ad) exposure, Los Angeles County, California, USA, 2012
Please note: column percentages may not sum up to 100 due to missing data.
† ‘Other’ includes respondents who self-identified as American Indian/Alaskan Native or multi-racial.
‡ Weight status based on the report of trained observers.
§ Respondents indicated agreement with the statement: ‘Drinking regular soda (not diet) and other sugary drinks such as energy/sports drinks can increase one’s risk for obesity and related diseases such as heart disease and diabetes.’
|| Respondents reported 1600–3000 kcal (6694–12 552 kJ) to the question: ‘In general, how many calories is a healthy adult supposed to consume each day?’
¶ Respondents reported <1600 kcal (<6694 kJ), >3000 kcal (<12 552 kJ) or ‘don’t know’ to the question: ‘In general, how many calories is a healthy adult supposed to consume each day?’
Multivariable logistic regression analysis of intention to reduce non-diet soda consumption among adults exposed to the ‘Sugar Pack’ advertisements in Los Angeles County, California, USA, 2012 (n 323)

*P<0·01.
† Model used the Stata ‘cluster’ option and adjusted for sex, age, race, education level, weight, knowledge of adult daily energy recommendations and belief that consumption of soda and other sugary drinks is harmful to one’s health.
‡ Respondents indicated agreement on a 1–5 scale (1=strongly agree, 5=strongly disagree) with the statement: ‘Drinking regular soda (not diet) and other sugary drinks such as energy/sports drinks can increase one’s risk for obesity and related diseases such as heart disease and diabetes.’
§ Respondents’ energy estimate coded as ‘correct’ if between 1600 and 3000 kcal (6694 and 12 552 kJ).
Discussion
Although a number of mass-media campaigns have sought to change health behaviours through the promotion of specific food choices or products (e.g. fruits, vegetables, milk)( Reference Wakefield, Loken and Hornik 22 ), a paucity of studies have examined the impact of campaigns that utilize stark messaging to discourage less desirable health behaviours, such as excessive soda consumption. Among research studies that have addressed excessive SSB consumption and health marketing campaigns, few have examined consumption of regular soda in adults. One of them is Zoellner et al.’s study in which adult behavioural intention (to change) was found to be strongly associated with SSB consumption, suggesting that intention and other behavioural constructs (e.g. attitudes, knowledge, subjective norms, perceived behavioural control) should be considered when developing mass-media messaging or public education interventions( Reference Zoellner, You and Connell 31 ). In an online quasi-experiment evaluating health messages, conducted as part of the Philadelphia Healthy Lifestyle Initiative, Jordan et al. found that exposure to campaign messages increased intention to reduce SSB; however, the study sample was restricted to only adult caregivers of children aged 3–16 years( Reference Jordan, Piotrowski and Bleakley 25 ). The present study contributes to this evidence gap and uniquely provides context on how subgroups in a diverse urban population may be differentially impacted by such a campaign.
Key findings
There were several key study findings. The first key finding from our multivariable analysis is that among adults exposed to the ‘Sugar Pack’ campaign, moderate soda consumers (1–6 sodas/week) had higher levels of intention to reduce soda consumption compared with heavy consumers (≥1 soda/d). This finding suggests that adults may be differentially influenced by the soda ad, based on the amount of soda they consumed. There are a few plausible explanations for this. First, it could be that soda consumption is generally not as habitual for moderate consumers as it is for heavy consumers; that is, moderate consumers may be more receptive to health messages that were designed to be more motivational. Second, adults who consume moderate amounts of soda are likely contemplating action and thus may possess greater knowledge about the adverse health effects of excess soda consumption, compared with heavy consumers. Third, unlike heavy consumers, moderate consumers may have a lower threshold at which motivational messages from advertisements such as the ‘Sugar Pack’ campaign can trigger contemplation or action. Although no studies have directly documented this latter phenomenon, there is emerging precedence in the literature for this rationale. Recent studies suggest that certain foods (i.e. hyperpalatable ones) can exhibit addictive properties( Reference Volkow, Wang and Fowler 32 – Reference Stice, Figlewicz and Gosnell 36 ). Sugar, in particular high-fructose corn syrup, is a highly palatable ingredient used to enhance a variety of foods including soda( Reference Volkow, Wang and Tomasi 37 ). A commentary reviewing the literature on the relationship between high-fructose corn syrup and obesity suggests that there is a positive association between the ingredient and the physical condition( Reference Park and Yetley 38 ). Likewise, a meta-analysis examining the role of SSB in the development of metabolic dysfunction such as type 2 diabetes also found a positive association between higher consumption of SSB and the development of such metabolic conditions( Reference Bray, Nielsen and Popkin 39 ). This notion that there is an addiction component that explains sweetened beverage consumption patterns is also supported by studies which showed that consumption of highly palatable foods can trigger dopamine receptors in the brain, leading to repeated consumption of foods containing the particular ingredient( Reference Malik, Popkin and Bray 40 – Reference Johnson and Kenny 42 ). Martire et al., for instance, found that rodents given highly palatable, energy-rich foods often overate and became overweight( Reference Martire, Maniam and South 43 ).
Another key study finding is that older respondents aged ≥65 years were less likely to report intention to reduce soda consumption after being exposed to the ‘Sugar Pack’ campaign. This limited effect may be due to older adults generally drinking less soda and other sugary beverages than younger adults. According to data from the 2011 Los Angeles County Health Survey, approximately 21 % of older adults aged ≥65 years drank, on average, at least one soda or SSB daily, as compared with 58 % of younger adults( 10 ). Similar age differences in soda consumption prevalence have been observed on a national level, including recent findings from the National Health and Nutrition Examination Survey( Reference Bleich, Wang and Wang 44 , Reference Miller, McKinnon and Krebs-Smith 45 ). Not too surprisingly, those with less than a high-school education also reported less intention to reduce soda consumption than college-educated respondents. Prior research supports education as an important determinant of health behaviour, including healthy eating( Reference Ribisl, Winkleby and Fortmann 46 – Reference Kickbusch 48 ).
Finally, respondents who perceived soda as harmful were more likely to report intention to reduce non-diet soda consumption as a result of exposure to the soda ad. This finding aligns with emerging literature on risk perception. A meta-analysis examining the relationship between risk perception and health behaviour, using vaccination as an example, found strong associations between perception of harm and resulting action( Reference Brewer, Chapman and Gibbons 49 ); albeit there is currently no comparable meta-analysis for health behaviours such as exercise and diet.
Collectively, these key findings raise important questions about factors that contribute to excess soda consumption among various at-risk groups. However, given that the study was descriptive in nature, it is beyond the scope of the present article to elucidate the relationships and the interactions between various factors that can influence soda consumption in the community. Clearly, further research is needed.
Limitations
Although the present study is among the first to uniquely examine the differential impact of health marketing on soda consumption behaviours among LAC residents, it has several limitations. First, the cross-sectional sample was recruited from selected public transit locations and may be subject to selection bias and non-response bias. Second, estimated weight status by observation is not as accurate as objectively measured height and weight. This, however, was mitigated by training field staff to reliably assess respondent weight status through observation. Third, the intention indicator in the analysis was non-traditional in that it was worded as an outcome expectancy question rather than as an intention question; depending on intervention design and context, future studies should consider using a more traditional indicator to measure intention. Fourth, the study did not collect comparable information about intention from unexposed survey respondents; thus, the results may be biased and represent only a description of exposed adults’ responses to the ‘Sugar Pack’ campaign. Fifth, social desirability bias may have influenced responses to the outcome question. Sixth, the primary outcome variable used in the multivariable logistic regression model was limited to only behavioural intention and not to the actual change in behaviour. Seventh, because the study was cross-sectional, directionality of the relationship between soda consumption and behavioural intention cannot be definitively assessed. Lastly, due to time and logistical constraints associated with conducting a street-intercept survey, data collection of all desired variables was not feasible; thus, omitted variable bias may have affected the results.
Conclusions
Among those exposed to the Choose Health LA ‘Sugar Pack’ health marketing campaign, moderate consumers of soda reported higher levels of intention to reduce soda consumption compared with heavy consumers. Although heavy consumers are an important target group, moderate consumers represent a sizeable proportion of the LAC population. To provide context, a moderate consumer can still consume up to six sodas per week. Additionally, the finding of limited impact of the campaign ads on heavy consumers suggests that further targeting of the ‘Sugar Pack’ messaging may be needed to promote contemplation or action in this group; for example, counter-advertising that utilizes starker messages coupled to more robust policy, system and environmental change interventions in the community. Similar tailoring strategies are likely needed for younger v. older age groups, for those with less educational attainment and those who do not perceive consumption of soda as harmful.
Collectively, study findings and lessons learned during the ‘Sugar Pack’ campaign point to the importance of tailoring health marketing messages and behavioural change interventions to the needs and readiness (for action) of the intended audience( Reference Jordan, Piotrowski and Bleakley 25 ). Within the context of health marketing that seeks to promote healthy eating, future studies should evaluate the content and type of messaging that could be more meaningful and ‘harder hitting’ for adults who drink ≥1 soda/d.
Acknowledgements
Acknowledgements: The authors thank Lisa V. Smith and her team – Ekaterina Gee, Elizabeth Friedman, Nirvi Shah, Ashley Stegall and Jennifer Piron – in the Office of Health Assessment and Epidemiology at the Los Angeles County Department of Public Health for their contributions to the street-intercept survey data collection. The authors thank Mirna Ponce in the Division of Chronic Disease and Injury Prevention at the Los Angeles County Department of Public Health for her technical assistance with data analysis. Financial support: The project was supported in part by in-kind resources from the Los Angeles County Department of Public Health. Conflict of interest: No conflicts of interest or financial disclosures were reported by the authors. Disclaimer: The findings and conclusions in this article are those of the authors and do not necessarily represent the views or position of the Los Angeles County Department of Public Health, Research Triangle, Inc. or any other organization mentioned in the text. Author contributions: B.R., J.L.B. and T.K. conceptualized the initial analysis design. B.R. supervised the data collection and analysis of the street-intercept survey. A.J.L., N.C.B. and L.N.G. provided iterative refinements to the analysis plan. All authors contributed to the interpretation and presentation of the data, and helped draft the article or revised it critically for important intellectual content. All authors have read and approved the final version. Ethics of human subject participation: The study received approval from the Institutional Review Board at the Los Angeles County Department of Public Health.


