

Introduction
The effects of climate change threaten the world's most sensitive agroecosystems and our potential to reach agricultural productivity levels needed to feed a projected global population of 9.7 billion people by 2050 (Delgado, Reference Delgado2014). Projections of global mean temperature indicate that even a 1–2°C rise could disrupt agricultural systems and production in low-latitude regions (23.5°N–23.5°S), and a rise >3°C would negatively affect food production worldwide (Easterling et al., Reference Easterling, Aggarwal, Batima, Brander, Erda, Howden, Kirilenko, Morton, Soussana, Schmidhuber and Tubiello2007). Decreases in mean precipitation are projected in mid-latitudes and regions of the dry tropics, diminishing water availability in areas of rain-fed crops (e.g., Central America), while extreme increases in precipitation are likely in major agricultural production areas (e.g., Southern and Eastern Asia) (Easterling et al., Reference Easterling, Aggarwal, Batima, Brander, Erda, Howden, Kirilenko, Morton, Soussana, Schmidhuber and Tubiello2007). Models also indicate that changes in seasonal timing, frequency and severity of climatic events can result in serious consequences for agricultural production beyond those derived from changes in average precipitation and temperature (Easterling et al., Reference Easterling, Aggarwal, Batima, Brander, Erda, Howden, Kirilenko, Morton, Soussana, Schmidhuber and Tubiello2007; Walthall et al., Reference Walthall, Hatfield, Backlund, Lengnick, Marshall, Walsh, Adkins, Aillery, Ainsworth, Ammann, Anderson, Bartomeus, Baumgard, Booker, Bradley, Blumenthal, Bunce, Burkey, Dabney, Delgado, Dukes, Funk, Garrett, Glenn, Grantz, Goodrich, Hu, Izaurralde, Jones, Kim, Leaky, Lewers, Mader, McClung, Morgan, Muth, Nearing, Oosterhuis, Ort, Parmesan, Pettigrew, Polley, Rader, Rice, Rivington, Rosskopf, Salas, Sollenberger, Srygley, Stöckle, Takle, Timlin, White, Winfree, Wright-Morton and Ziska2012). Multiple stressors, such as drought, increasing temperatures and economic recession can align to push interconnected social and agroecosystems past crucial tipping points, forcing a reformation of network connections, affecting current and future adaptive capacity and yield potential (Folke, Reference Folke2006).
To minimize the effects of climate change and extreme weather events on agriculture, scientists and policy makers highlight the importance of air, soil and water conservation as fundamental to climate adaptation and mitigation and for improving food security (Walthall et al., Reference Walthall, Hatfield, Backlund, Lengnick, Marshall, Walsh, Adkins, Aillery, Ainsworth, Ammann, Anderson, Bartomeus, Baumgard, Booker, Bradley, Blumenthal, Bunce, Burkey, Dabney, Delgado, Dukes, Funk, Garrett, Glenn, Grantz, Goodrich, Hu, Izaurralde, Jones, Kim, Leaky, Lewers, Mader, McClung, Morgan, Muth, Nearing, Oosterhuis, Ort, Parmesan, Pettigrew, Polley, Rader, Rice, Rivington, Rosskopf, Salas, Sollenberger, Srygley, Stöckle, Takle, Timlin, White, Winfree, Wright-Morton and Ziska2012; Delgado and Li, Reference Delgado and Li2016). Hence, governments around the world are increasingly investing in agricultural conservation initiatives to promote the improved health and resiliency of soil and water resources while still promoting agricultural productivity (Reimer and Prokopy, Reference Reimer and Prokopy2014). While balancing agricultural production and conservation presents an opportunity for improving agricultural production amidst increasing climatic stressors, there are challenges associated with the allocation of the conservation funds and initiatives. Conservation planners often lack key data regarding where to focus efforts, which practices may be most effective in addressing a location-specific suite of resource concerns, and how to best plan for larger environmental units beyond an individual farm (e.g., watershed) (Batic, Reference Batic2009). Other challenges relate to encouraging farmer participation in conservation programs which are usually voluntary in nature (Reimer et al., Reference Reimer, Thompson and Prokopy2012). Despite these challenges, conservation practices play a crucial role in contributing to the landscape-level conservation of agricultural lands and in the cumulative effect of adaptation to climate change (Delgado et al., Reference Delgado, Groffman, Nearing, Goddard, Reicosky, Lal, Kitchen, Rice, Towery and Salon2011).
Recent droughts in the US Caribbean have highlighted the region's agricultural vulnerability to this hazard and the increasing need for adaptive mechanisms to support and build the region's agricultural production. Puerto Rico and the US Virgin Islands experienced severe drought conditions between 2014 and 2016, resulting in water deficits in 86% of the island's territory and substantial losses in the agricultural sector in 2015 (DRNA, 2016). Heat stress from high temperature and desiccation from insufficient water resulted in reduced crop yields, increased livestock mortality and a rise in spending on feed, irrigation and energy to cope with drought conditions (DRNA, 2016). Climatic projections for Puerto Rico suggest an increase in the intensity and frequency of drought events as a consequence of increases in both mean and extreme temperatures and decreases in precipitation particularly during the wet season (Hayhoe, Reference Hayhoe2012). Although conservation practices that address drought conditions have been applied throughout the region since 1976 through US Department of Agriculture (USDA) programs, there has not been an evaluation of the overall contribution of conservation practices in helping farmers adapt to drought conditions. An improved understanding of the programs’ landscape-scale contributions in managing regional drought and their coincidence with drought-exposed areas is an important first step in the development and refinement of policies, programs and outreach efforts that motivate participation in conservation programs. Moreover, highlighting gaps between conservation practices and areas that are highly probable to be exposed to drought in the future can help identify strategic areas to apply drought mitigation efforts.
In this paper, we analyze the contribution of agricultural incentives from the USDA Natural Resources Conservation Service (NRCS) in minimizing drought vulnerability in agricultural lands in Puerto Rico as a case study to evaluate the effects of conservation practices in agriculture adaptation to climatic stressors. The overall goal of this project is to analyze the spatial correlation between drought-related conservation practices incentivized through the NRCS Environmental Quality Incentives Program (EQIP) and exposure to drought events in order to assist future conservation planning and farmer recruitment. This program is the primary conservation program for working farms and ranches in the USA and territories, introduced in Puerto Rico and the US Virgin Islands under the 1996 Farm Bill. It provides financial and technical assistance to encourage voluntary adoption of farming and ranching practices that conserve resources and enhance environmental performance. The program also addresses many different resource concerns under five broad environmental priorities: ‘(1) reduction of nonpoint source pollution, (2) conservation of ground and surface water, (3) reduction of emissions that contribute to air quality impairment, (4) reduction in soil erosion and sedimentation and (5) conservation of wildlife habitat for at-risk species’ (Wallander et al., Reference Wallander, Aillery, Hellerstein and Hand2013). Field technicians from NRCS recommend a combination of practices based on these resource concerns and the most appropriate use of EQIP funds. Since EQIP participation is voluntary in nature, the willingness of the farmer to enroll is crucial for the success of the program. Although this program does not have drought response as a primary focus, practices demonstrated to mitigate the effects of drought have a higher adoption rate in areas prone to such events (Wallander et al., Reference Wallander, Aillery, Hellerstein and Hand2013).
Specifically, this paper will: (1) identify the incidence and frequency of drought in agricultural areas between 2000 and 2016, (2) identify concentrated areas of applied drought management practices, (3) compare the coincidence of drought events and concentration of conservation practices for drought adaptation, and (4) discuss past drought events and drought preparedness with respect to projected drought events for the region. Ultimately, results may inform more suitable geographical targeting of programs and help incorporate drought vulnerability into conservation program design that considers the likelihood of future drought events.
Study site
Physical setting
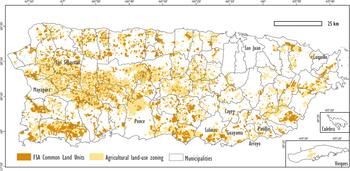
Puerto Rico is located in the Caribbean basin and is the smallest archipelago of the Greater Antilles, covering an area of ~8900 km2. The islands fall within the tropical climatic zone and have a long-term annual mean temperature and precipitation of 24.55°C and 1687 mm, respectively (Daly et al., Reference Daly, Helmer and Quinones2003). Precipitation shows two main seasonal patterns: higher rainfall in May and between August and November, with drier conditions from January to March and a mid-summer dry period in June and July. A high diversity of fertile soils, a tropical climate and complex topography allow Puerto Rico to produce a high diversity of agricultural products. Current major crops include grass for livestock, plantains, coffee, fruits, vegetables, ornamental and root crops. The island has an estimated 2100 km2 with agricultural potential (Fig. 1) but steep slopes in the mountainous region limit the use of mechanized equipment on ~60% of these lands (Gould et al., Reference Gould, Wadsworth, Quiñones, Fain and Álvarez-Berríos2017).
Lands designated for agricultural use across Puerto Rico. The brown land areas indicate Farm Service Agency (FSA) Common Land Units (CLU), which are considered recently productive lands. Tan areas represent lands zoned for agricultural use, including inactive lands. The polygons outlined in black are municipal boundaries. The names of the municipalities mentioned in the text of the manuscript are included.
Agriculture and drought
Drought is one of the most complex among all natural hazards. Despite affecting more people than any other hazard, it remains a poorly understood phenomenon (Wilhite, Reference Wilhite2000). The challenges in determining the onset and termination of a drought, the spreading of its effects over larger geographical areas, and the absence of resulting structural damage are some of the reasons why drought effects are not well understood when compared with other hazards (i.e., hurricanes, tornadoes, floods). In general, drought is defined as a reduction in precipitation over an extended period that can be aggravated by high temperatures, high winds and low relative humidity. Drought can also relate to delays in the start of the rainy season, the timing of rains in relation to cropping stages, rainfall intensity and the number of rainfall events (Wilhite, Reference Wilhite2000).
Agriculture is usually the first economic sector to be affected by drought. During a drought, soil moisture can decrease rapidly, affecting crop health and yield, particularly if this moisture deficiency is accompanied by high temperatures and wind. Agricultural drought is related to shortages in precipitation, differences between actual and potential evapotranspiration (ET), soil water deficits and their effects on agricultural production. The effects of agricultural drought also depend on its timing in relation to the susceptibility of crops at different developmental stages. For instance, a period of water and temperature stress may coincide with a critical stage of development for one crop while missing a weather-sensitive stage in a different crop (Wilhite et al., Reference Wilhite, Svoboda and Hayes2007). Agricultural droughts are particularly detrimental for tropical agriculture considering that the majority of agricultural lands rely on rain or stored rainfall for irrigation, and generally present low yields and high on-farm water losses (Rockström et al., Reference Rockström, Barron and Fox2003). Additionally, many economically important tropical crops are highly sensitive to water shortage and unfavorable temperatures (e.g., coffee) and their production are vulnerable to changes in climate (Henareh et al., Reference Henareh, Gould, Harmsen, Terando, Quinones and Collazo2016; Fain et al., Reference Fain, Quiñones, Álvarez-Berríos, Parés-Ramos and Gould2018). The need to understand and mitigate agricultural drought in tropical areas is highlighted by the projected reduction of water availability (Henareh et al., Reference Henareh, Gould, Harmsen, Terando, Quinones and Collazo2016; Van Beusekom et al., Reference Van Beusekom, Gould, Terando and Collazo2016).
The agricultural sector in Puerto Rico has experienced an overall decline in production since 1950 when the island began transitioning from an agrarian to an industrial economy (Dietz, Reference Dietz1986; Gould et al., Reference Gould, Fain, Pares, McGinley, Perry and Steele2015). Land dedicated to agricultural production declined from 6880 km2 in 1950 to 2299 km2 in 2012 (Gould et al., Reference Gould, Fain, Pares, McGinley, Perry and Steele2015). Today, Puerto Rico imports over 80% of its food supply from 52 different countries, of which the USA and China are the principal suppliers (Comas, Reference Comas2009). Despite decades of persistent challenges and low production levels, Puerto Rico is currently experiencing a rebirth of its agricultural sector. Estimates show farm income increased by 25% from 2012 to 2014 while the amount of acreage under cultivation increased 50% (Coto, Reference Coto2016). The country's agricultural development, however, is recurrently affected by disturbances outside the territory's control such as market fluctuations, hurricanes, floods and droughts.
Throughout the 20th century, periods of major drought have resulted in economic, social and agricultural consequences. Of the five major periods of meteorological drought in the last century (1966–1968, 1971–1974, 1976–1978, 1993–1995, and 1997–1998), the most severe drought event on record occurred from 1966 to 1968 when average annual rainfall was 32% below normal (Larsen, Reference Larsen2000). The most recent widespread event was due to a prolonged drought period from 2014 to 2016, which at its peak covered 64% of Puerto Rico and much of the US Virgin Islands (National Drought Mitigation Center, 2017). This drought resulted in agricultural losses over US$13 million in 2015, affecting mainly the livestock and plantain sectors (DRNA, 2016). As of 2012, only 9.12% of farmed land in Puerto Rico employed irrigation practices (United States Department of Agriculture, 2012). Although the recent losses caused by drought appear overshadowed by the agricultural devastation and economic loss induced by recent hurricanes in Puerto Rico (approximately US$2.08 billion in losses from hurricanes Irma and Maria in 2017), drought remains a persistent issue affecting regional agricultural production, yet its effects on the agricultural economy in the region are still poorly understood.
Data and methods
Spatial analysis of drought occurrence and crop exposure in Puerto Rico
Mapping accumulated drought events
We analyzed the occurrence of drought in Puerto Rico by combining weekly maps from the US Drought Monitor (USDM) available for Puerto Rico since 2000. The USDM maps are developed as a joint effort of the USDA, the National Oceanic and Atmospheric Administration (NOAA) and the National Drought Mitigation Center (NDMC) at the University of Nebraska-Lincoln. The maps portray drought conditions based on the expert opinions of climatologists, key indices and ancillary indicators of drought conditions including the Palmer Drought Index, Crop Moisture Index, Climate Prediction Center Soil Moisture Model, US Geological Survey Daily Streamflow, Percent of Normal Precipitation, USDA National Agricultural Statistics Service Topsoil Moisture, and a remotely sensed Satellite Vegetation Health Index (Svoboda, Reference Svoboda2000) (Table 1).
US Drought Monitor classification of drought severity showing typical ranges for selected parameters

(Source: US Drought Monitor, 2017 http://droughtmonitor.unl.edu/AboutUs/ClassificationScheme.aspx).
To identify areas of past drought events, we created a map exhibiting 17 years of aggregated drought zones. This period encompassed the extent of available data on Puerto Rico from the USDM. To generate the aggregated map, we used a total of 887 weekly USDM Geographic Information Systems (GIS) layers from January 4, 2000 to December 26, 2016 downloaded from the USDM website (National Drought Mitigation Center, 2017). Each layer contains polygons portraying areas that experienced drought conditions and the attribute describing the severity of the drought, from 0 (abnormally dry) to 4 (exceptional drought) (Table 1). The 887 layers were merged into a single layer that contained all the drought areas reported during the 17 years of analysis. Areas categorized as ‘abnormally dry’ were excluded from our analysis as they are not considered drought, but zones transitioning in or out of drought. To summarize the polygon data, we used a grid of homogenous hexagons 5 km2 in the area which allowed us to summarize the information without losing important variability and provided a homogeneous unit of analysis across Puerto Rico. Each hexagon was populated with the number of weeks under drought conditions and the classification of drought at the center point of the hexagon. We replicated these steps to create maps for the 2014–2016 drought, by aggregating 123 weekly USDM layers from July 8, 2014 to November 8, 2016. All GIS analyses in this study were conducted using ArcGIS Pro software (ESRI, 2017).
Crops exposed to drought conditions
We assessed the spatial extent of areas of agricultural productivity under drought conditions during the prolonged drought event of 2014–2016, using information from the Farm Service Agency (FSA) common land units (Fig. 1). A common land unit (CLU) is the smallest unit of land within a farm with a contiguous boundary, a unique land cover and a single land management and ownership. These are delineated using relatively permanent land features as references (i.e., fence lines, roads, waterways). The FSA CLU dataset consists of digitized CLU boundaries and associated attribute data for all the farms in the USA and US territories that are associated with USDA farm programs. The CLU data for Puerto Rico was obtained from the FSA Aerial Photography Field Office via a data sharing agreement and was available in a GIS layer format.
To identify specific crop types that were exposed to drought conditions, we added attribute data on crop types and acreage derived from the FSA crop reports submitted annually by farmers enrolled in FSA programs. We then calculated the average number of hectares for the different crops reported by farmers in 2014, 2015 and 2016 by the classification of drought they were geographically exposed to from 2014 to 2016. Not all land under production in Puerto Rico is enrolled in these programs; therefore, the resulting crop extent values in drought-exposed regions should be considered underestimations. We recognize that drought-exposed crops do not necessarily indicate drought-affected crops due to variability in the water sources utilized in farms and other factors. For example, farmland with an aquifer-fed irrigation system will be less vulnerable to drought effects than farmland fully reliant on rainwater.
Analyzing drought-related conservation practices and hotspots
Evaluating conservation practices related to drought
To understand EQIP conservation practices that contribute to drought resilience and adaptation, we conducted in-depth interviews with four agricultural experts from the NRCS Caribbean Office. Consensus from the interviews indicated three main groups of conservation practices or categories of resource concerns based on their ability to alleviate various effects of drought in agricultural systems (in order of relevance in mitigating drought effects): (1) water availability: practices that manage water for irrigation, moisture for land use goals and ecological processes, and quantity and quality of water for livestock; (2) soil health: practices that contribute to soil quality (increased soil organic matter) and minimize soil erosion and (3) plant health: practices that help with plant productivity and health (Table 2).
Description of the categories of resource concerns and resource concerns components that are related to drought conditions in Puerto Rico according to interviewed experts from the Natural Resources Conservation Service Caribbean Office

Once we identified the types of EQIP practices that contribute to drought resilience and adaptation, we narrowed our selection to those practices that had a substantial contribution in alleviating drought effects in Puerto Rico according to the experts interviewed. The selection of the practices was based on their valuation in the NRCS Conservation Practices Physical Effects (CPPE) tool. The CPPE is a ranking system that provides a relative value, ranging from negative 5 to positive 5 (highest value), indicating the effect that a particular conservation practice has on resource concerns (e.g., how strong is the effect of establishing windbreaks on soil erosion). Positive values indicate positive effects or improvements on the resource concern, whereas negative values indicate adverse effects on the resource and a value of zero indicates no effect. Given that the CPPE valuation generally applies to the continental USA, a conservative ranking of values >2 was suggested by the experts as an adequate ranking tailored to the Caribbean agricultural landscape. In total, there were 44 types of EQIP conservation practices that contribute to mitigate drought in one or more of the resource concerns categories: water availability, soil health, or plant health, with CPPE values >2 (Table 2 and Appendix 1).
To assess the spatial distribution of these drought-related conservation practices we then mapped the locations of practices applied through EQIP contracts from 2000 to 2016. The original data were obtained from the NRCS Caribbean Office in table format and converted into a point feature layer using ArcGIS Pro (ESRI, 2017). The resultant GIS layer had a total of 6984 locations of practices applied between 2000 and 2016. It also included associated attributes at each location, such as the acreage of the applied practice and a common identifier with the FSA data, which facilitated the comparison among databases.
Hotspot analyses
We identified clusters of drought-related EQIP conservation practices applied between 2000 and 2016 using hotspot analysis. Hotspot analysis is a spatial clustering method used to identify regions or values that are significantly higher relative to their surroundings (Getis and Ord, Reference Getis and Ord1992; Anselin, Reference Anselin1995). Hotspot maps are increasingly used to organize priority settings and to facilitate strategic planning regarding climate adaptation projects (Yusuf and Francisco, Reference Yusuf and Francisco2009; de Sherbinin, Reference de Sherbinin2014). Given their statistical and visual components, hotspot maps are a defensible tool to identify priority areas in the allocation of efforts, funds and public resources (Barnett et al., Reference Barnett, Lambert and Fry2008).
Our hotspot methodology used Moran's I and Getis-Ord Gi* spatial association procedures to identify areas with a statistically significant concentration of drought-related EQIP conservation practices. Both procedures evaluate data distribution based on a feature's location (i.e. conservation practices summarized in the hexagon unit) and corresponding attributes. Moran's I provides a measure of spatial autocorrelation for all points or areas within a study region (Burt et al., Reference Burt, Barber and Rigby2009). Getis-Ord Gi* calculates the distribution of data points in the context of its neighboring features and the areas where values of a variable are significantly greater or lower than average (Burt et al., Reference Burt, Barber and Rigby2009).
We used the 5-km2 hexagon used in the drought method (see the section Mapping accumulated drought events) as the unit of analysis for the hotspot analysis. For each hexagon, we added the number of applied EQIP conservation practices within the hexagon's borders and included the count as a new attribute in the layer's table (Appendix 2). We then performed the hotspot analysis on the hexagons grid for each category of practices: water availability, soil health and plant health. In this case, the analysis would be influenced by the distribution of farmlands across the island (Fig. 1).
In order for a hexagon to be included in a hotspot, it should contain a high count of applied practices and also be surrounded by other hexagons with high counts. Hexagons with low counts surrounded by hexagons with similar values constitute a coldspot. The concentration of high or low counts will result in large or small z-score values, respectively. For statistically significant positive Z scores, the larger the Z score is, the more intense the clustering of high values (hotspot). For statistically significant negative Z scores, the smaller the Z score is, the more intense the clustering of low values (coldspot). In Appendix 3 we present the z-score, and P-values for each of the hotspot analyses conducted, as well as the maximum peak distance bands used in for the Moran's I analysis.
Coincidence of past drought areas and applied conservation practices
Regional level: spatial coincidence of past droughts and hotspots
We analyzed the coincidence of areas of drought recurrence with the hotspots of drought conservation practices on agricultural lands. To do this, we overlaid the map of conservation practice hotspots with a P-value below 0.1 with the map of drought frequency from 2000 to 2016. We report areas of overlap and gaps between hotspots of drought conservation practices and areas of past drought events.
Farm level: spatial coincidence of past drought and farms enrolled in drought-related practices
We estimated the number of farms that established conservation practices related to drought in areas that experienced drought from 2000 to 2016. This was conducted combining the NRCS dataset on farms and conservation practices adopted from 2000 to 2016 with maps of drought classifications. Our results may be underestimated on account that not all farmlands in Puerto Rico are in NRCS programs, and some farmlands may employ conservation practices under other conservation initiatives (e.g. programs promoted by NGOs or local government) or on their own.
Results
Drought analysis and major crops exposed to drought conditions
General drought patterns from 2000 to 2016
Between 2000 and 2016, 92.01% of Puerto Rico experienced periods of drought conditions. Moderate drought was the only drought classification detected by the USDM from 2000 to 2014. After 2014, Puerto Rico experienced moderate (68.02% of the total land area), severe (45.11%) and extreme drought conditions (25.24%) (Table 3). Since some regions were affected by multiple drought severity classifications over time, there is a spatial overlap of drought classification distributions, resulting in a land area sum over 100%.
Total land area (km2) exposed to each drought classification in the two periods of analysis: 2000–2016 and 2014–2016, based on data obtained from the United States Drought Monitor Data (NDMC, 2017). Because the exposure area for drought severity classifications overlap, the sum of the land area percentages is >100
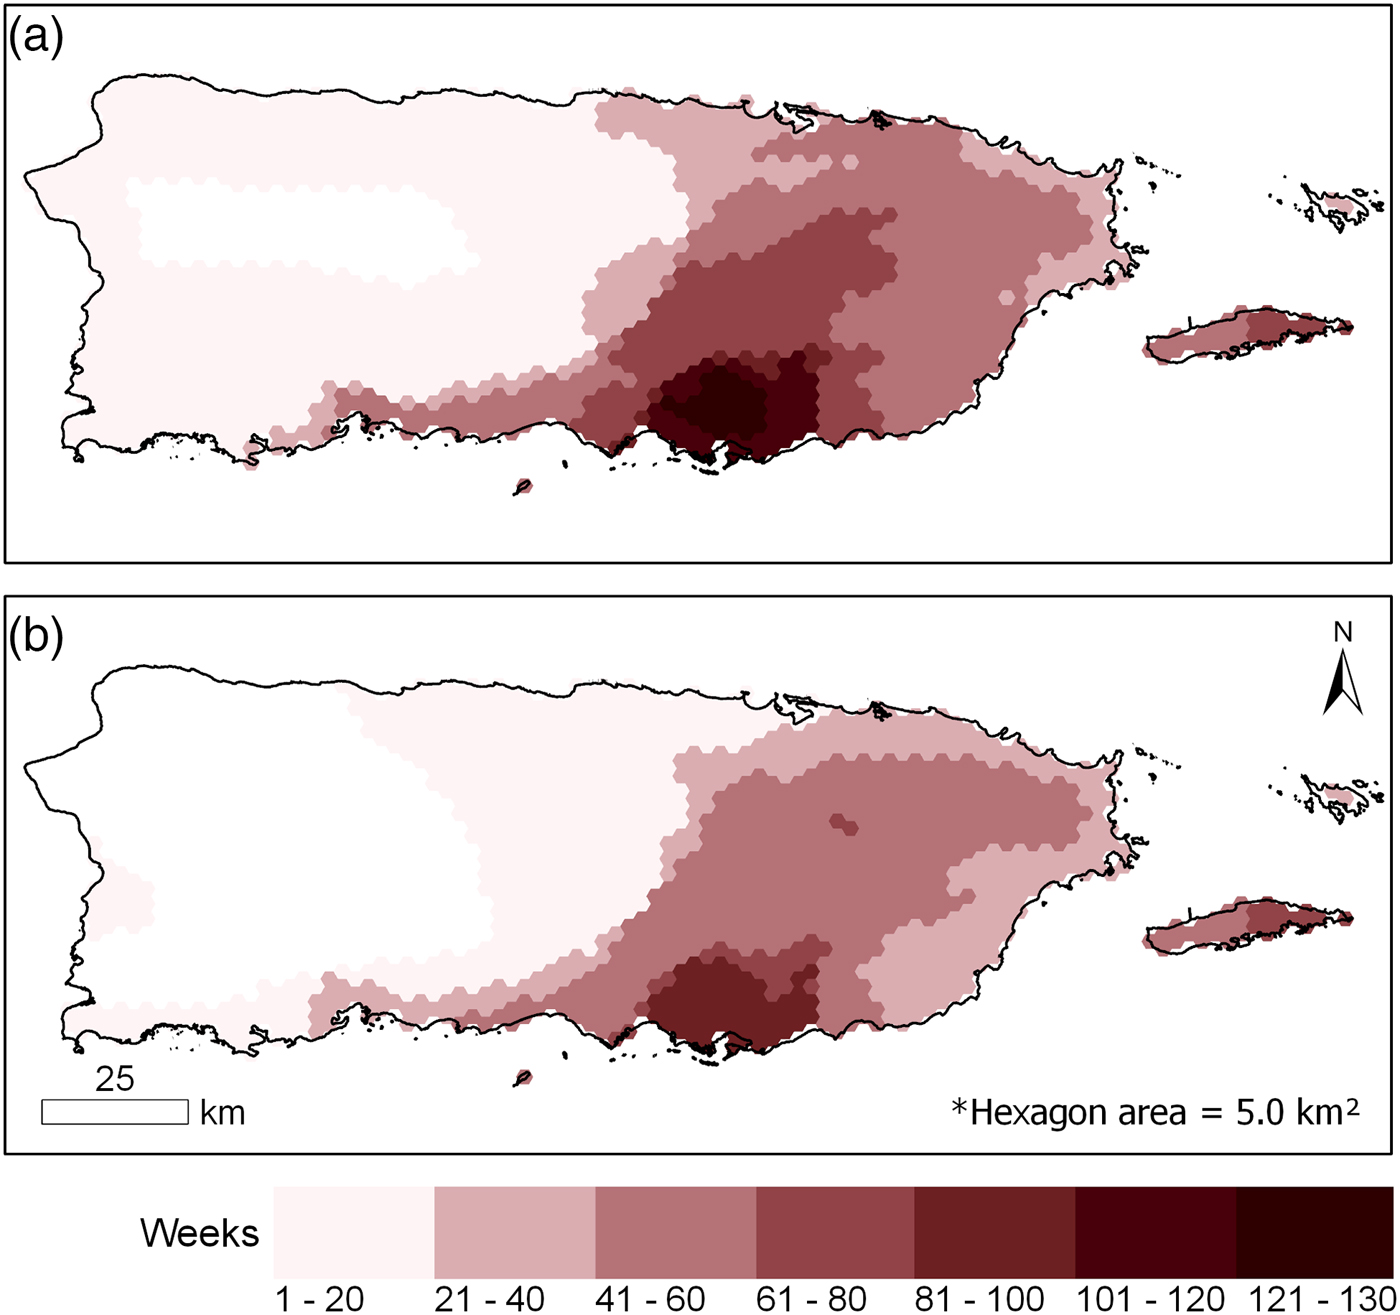
After analyzing the number of non-consecutive weeks under drought conditions across Puerto Rico, the southeastern portion of the island stands out as the area most exposed to any classification of drought. The region endured 128 non-consecutive weeks of drought conditions (i.e., in the municipalities of Salinas and Guayama). Much of eastern Puerto Rico experienced more than 41 weeks of non-consecutive droughts (Fig. 2).
Maps of the number of non-consecutive weeks under drought conditions during the periods: (a) 2000 to 2016 and (b) 2014 to 2016. The maps were created based on US Drought Monitor weekly drought reports (NDMC, 2017). Data is represented in a grid of 5 km2 hexagons.
Short-term (<6 months) episodes of moderate drought were registered in 2000, 2002, 2005, 2007, 2008, 2014 and were primarily concentrated around the south and southeastern region, except for the 2000 drought which affected the northern coast and southwestern region. The average duration of these short droughts was 10.17 weeks. While the average time lapse between the 2000 to 2008 droughts was 95.5 weeks, there were 304 weeks without any drought conditions preceding the 2014 drought (Fig. 3).
Maps display the maximum spatial extent of drought conditions and drought severity in seven drought periods from 2000 to 2016. The graph shows the weekly percent of Puerto Rico's land area that experienced drought conditions during these periods. The maps and graphs were created based on US Drought Monitor weekly drought reports (NDMC, 2017).
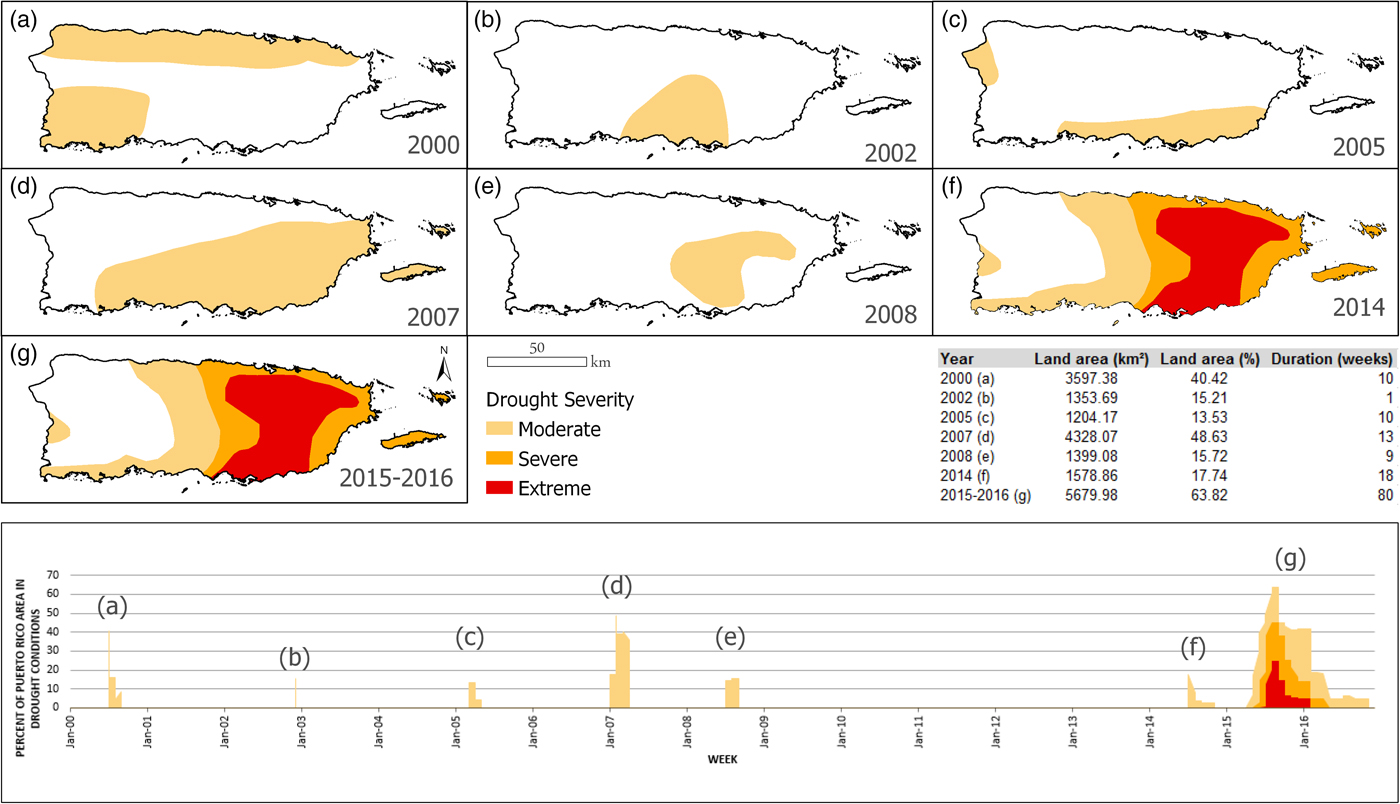
A long-term (>6 months) moderate drought was registered by USDM from May 5, 2015 to November 8, 2016. Within this period, manifestations of severe and extreme drought conditions lasted from June 2, 2015 to April, 26, 2016 and July 7, 2015 to February 16, 2016, respectively (Fig. 3). This drought covered the eastern half of Puerto Rico, the full southern coast of the island, a small patch on the west side (i.e., municipality of Mayaguez) and all of Vieques and Culebra. Given the proximity of the 2014 and 2015–2016 droughts (25 weeks apart), these were locally regarded as one drought period. For the rest of the analyses in this paper, we treat them as a single unit of analysis.
The 2014–2016 drought is the primary driver of the overall observed pattern during the study period of 2000–2016 (Figs. 2 and 3). Between 2014 and 2016, the USDM registered 80 consecutive weeks of moderate drought, 48 of severe drought and 33 of extreme drought conditions in different regions of Puerto Rico (Fig. 2). The areas (i.e., hexagon) that experienced the greatest number of weeks in severe drought were located in the southeast (42 weeks; municipality of Salinas) and the island of Vieques (40 weeks), while the area that had the greatest number of weeks in extreme drought conditions were within the southeast region, with 31 weeks of consecutive drought.
Crops exposed to drought conditions during the drought of 2014–2016
In analyzing farms enrolled in FSA programs, we calculated that areas of grasses (5959 ha) (grassland for both grazing and forage), plantains (807 ha) and coffee (312 ha) constituted the largest extent of crops that were exposed to moderate drought conditions during the 2014–2016 period (Table 4). Grasses and plantains also exhibited the highest exposure to severe (1909 ha; 663 ha) and extreme conditions (884 ha, 206 ha), followed by pumpkins in severe (41 ha) and papaya in extreme (22 ha) droughts. Several of the crops exposed to moderate to extreme drought represent significant portions of their total reported production on the island. These areas represent 56% of all grasses, 73% of all plantains and 24% of all coffee under moderate, 18, 60, 0% under severe, and 8, 18 and 0% under extreme drought conditions, respectively. Several crops had total coverage under drought conditions, including red cabbage, sugarcane, soursop and squash under moderate conditions and sugarcane and ginger under severe conditions. Sixty-eight percent of the soursop plantations were exposed to extreme drought conditions, followed by papaya (44%) and mangos (36%).
Principal crops and crop area that experienced drought conditions during the 2014–2016 drought. Crop area is reported as the mean area (in hectares) of productive lands in Farm Service Agency records for years 2014, 2015 and 2016
SD, standard deviation.
Hotspots of drought-related conservation practices
Drought-related practices applied from 2000 to 2016
Between 2000 and 2016, 44 drought-related conservation practices were applied throughout 6984 NRCS EQIP locations on over 86,174 ha of farmlands. When using 5 km2 hexagons as units of analysis, 47.17% of the hexagons covering Puerto Rico contained drought-related conservation practices. The distribution of conservation practices is island-wide, even though there are evident empty stretches around urbanized areas, such as the San Juan metropolitan area in the northeast region of the main island and in the municipality of Ponce in the south. In addition, the island of Culebra, a smaller island in the northeast of Puerto Rico, did not show any NRCS conservation practices.
The average number of applied practices by hexagons (excluding hexagons without practices) was 18.2 (standard deviation 24.78), with the highest count of practices occurring in the central mountains (up to 135 applied practices in a single hexagon). If the distribution of applied practices is analyzed by resource concern category, 1152 practices contributed to water availability, 2804 to soil health and 4364 to plant-health activities.
Moran's I Spatial Autocorrelation analysis shows that when considering all of NRCS drought-related conservation practices, they are globally highly clustered throughout Puerto Rico (z-value = 28.28). When we evaluated each category separately, the z-values were 21.62, 34.46, and 19.00 for water, soil and plant health, respectively (Appendix 3).
The interpretation of a hotspot analysis is based on the obtained z-score and p-values. When considering all EQIP drought-related practices, the hotspot analysis identified areas with local clustering in the northwest, southwest, in several patches along the central region and the southeast of the main island (Fig. 4).
Maps display the spatial coincidence of hotspots of drought-related conservation practices with drought occurrence in weeks. The hotspots, outlined in gray, represent areas with a statistically significant concentration of hexagons with a high count of conservation practices for that particular resource concern category (water availability, soil health, plant health or all practices combined). The colors of the hexagons represent the number of non-consecutive weeks under drought conditions from 2000 to 2016 as derived from US Drought Monitor drought maps (NDMC, 2017).
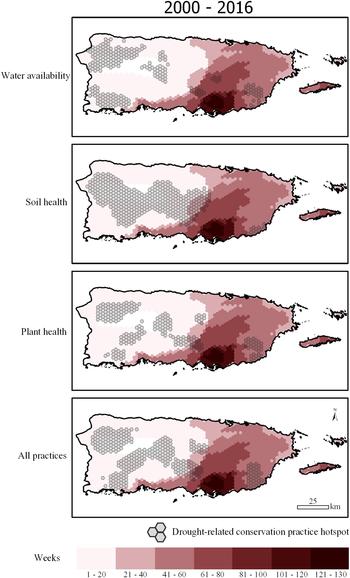
Our analysis identified three principal hotspots of water management practices. These hotspots are located in the northwest, southwest and southeast of the main island of Puerto Rico, with smaller hotspots located in the central mountainous region. These are associated with agricultural areas that primarily produce grasses. Soil conservation practices are concentrated along a large strip that extended from the northwest to the center of the island, as well as a smaller hotspot at the southeast of the main island. These areas are associated with regions that mainly produce grasses, coffee and plantains. Hotspots for plant health-related practices were more scattered. The analysis yielded a few hotspots of smaller size concentrated mainly in the northwest, southwest, southeast and central of Puerto Rico in areas associated with grasses and coffee production.
The results of all data of applied practices and those related to plant-health practices presented coldspots of varied sizes that were dispersed throughout Puerto Rico. Both presented larger coldspots around the metropolitan area of San Juan, and around the Luquillo Mountains. A smaller coldspot can also be observed in an area extending throughout the southeast (i.e., municipalities of Cayey, Guayama and Salinas).
Spatial coincidence of drought management hotspots and drought areas
In general, areas with a higher frequency of drought exposure, in particular regions that experienced more than 60 weeks of drought, are not spatially related to areas of significant concentration of conservation practices (Fig. 4). Significant concentrations of drought-related conservation practices mostly coincided with areas that experienced <20 weeks of non-consecutive droughts during the 2000–2016 period. In particular, water management practices were generally concentrated in the western half of the main island, with a small region concentrated in the southeast. In general, the location of water management hotspots was located in farmlands along the coast. The location of soil health and plant health hotspots were located in the central mountainous region. Although these estimates do not represent the real amount of land under production in Puerto Rico, it provides us with an outline of drought vulnerability by highlighting areas of high exposure that currently lack significant concentrations of drought-related conservation practices.
Table 5 shows the percentage of area overlap and gap areas between hotspots of conservation practices and the spatial extent of each drought classification. While these estimates are not absolute, they provide us with a quantitative idea of the degree of overlap between the hotspots and drought regions. From 2000 to 2016, approximately 76% of the hotspots of conservation practices coincided with areas that experienced at least 1 week in moderate drought, 19% with areas in severe drought and 7% with areas in extreme drought conditions. Hotspots of water management practices covered a greater extent of areas under moderate drought than soil and plant health practices. Plant health practices covered the largest area with severe or extreme drought conditions, followed by water and soil practices. While hotspots areas highly coincided with moderate conditions of drought, more than 80% of the hotspots area did not coincide with areas that experienced severe or extreme drought conditions (Table 5).
Percent of hotspots of drought-related conservation practices exposed to each drought category from 2014 to 2016

Because the exposure area for drought severity classifications overlap, some drought-related conservation practice locations were also exposed to multiple intensities of drought severity. As a result, the sum of all exposure percentages may be greater than 100.
At least 43% of farms with EQIP contracts, which experienced any drought class between 2000 and 2016, had established water management practices. Similarly, at least 53% of farms that experienced drought had established practices related to plant health and ~30% had practices related to soil health (Table 6).
Number of farms that applied Environmental Quality Incentives Program (EQIP) drought-related conservation practices (DCP) in regions that experienced drought between 2000 and 2016
Discussion
Between 2000 and 2016, a series of short-term moderate droughts and a prolonged period of severe and extreme drought affected Puerto Rico. Seventeen years of aggregated maps from the USDM revealed that past drought conditions were concentrated in the eastern and southern regions of the main island and in the island of Vieques. During this period, 38% of Puerto Rico experienced at least 40 weeks in non-consecutive droughts. Further, 28% experienced 40 or more weeks of consecutive drought during the drought between 2014 and 2016. While USDM data for our region is not sufficient for drought forecasting, statistically-downscaled climatic projections suggest an overall decrease of precipitation for Puerto Rico with the eastern region experiencing the greatest decline in precipitation in the next decades followed by the central mountainous region (Henareh et al., Reference Henareh, Gould, Harmsen, Terando, Quinones and Collazo2016). As such, it is highly likely that droughts will continue to intensify for the island, particularly in the eastern region of Puerto Rico.
The effects of drought constitute a major challenge in tropical agricultural landscapes. The concept of agricultural drought is defined by its effects on cropping systems and is therefore affected by the seasonal timing of meteorological drought conditions as well as land use and management decisions (Wilhite, Reference Wilhite2000). Many cultivation and conservation practices have a profound effect on evaporation, transpiration, percolation and infiltration rates that in turn affect soil water moisture levels and the onset of agricultural drought. Soil organic matter content, which strongly correlates to soil moisture retention, can be increased through the implementation of soil health practices such as no-till cultivation and cover-crops (Cruse et al., Reference Cruse, Flanagan, Frankenberger, Gelder, Herzmann, James, Krajewski, Kraszewski, Laflen, Opsomer and Todey2006). While agricultural droughts occur in many climates, tropical agriculture systems are particularly sensitive to their effects due to a high reliance on rainfall (Nieuwolt, Reference Nieuwolt1986). Consequently, even short periods of agricultural drought are associated with reduced yields, complete harvest losses, and livestock mortality. In Puerto Rico, where 90% of the agriculture is rainfed, the 2015–2016 drought caused losses of ~US$8.6 million USD in grasses (62.2% of all reported losses) and US$750,000 due to livestock malnutrition or death (5.4%) (Appendix 4). Of the total losses, 22% was attributed to plantains, one of the staple crops of the island. The remaining 10% of the losses were attributed to a wide variety of 21 crops, including plantains, root and tuber crops, herbs, fruits and coffee (Appendix 4). Much of the economic losses during this drought occurred in the southeast region that was exposed to the highest number of weeks of drought conditions as identified in our study (Appendix 5). The economic losses match our observation that the highest levels of exposure to drought from 2014 to 2016 occurred on grassland (50%) and plantain (76%) systems. Given the economic strain, drought can place on small-scale agriculture, agricultural and water management planning may greatly benefit by incorporating information about the probability of future drought.
When the outputs of the drought analysis and hotspots of drought-related conservation practices are examined together, agricultural regions of Puerto Rico that were exposed to frequent drought and that likely lacked drought preparedness are highlighted (Fig. 4). The spatial concentration of drought-related conservation practices did not generally coincide with areas of high exposure to drought conditions. For example, water management practices, the most important for water-related issues, were largely concentrated in the western half of the island, with a small region of concentration in the southeast. In contrast, areas of drought conditions in the past that were concentrated in the eastern and southern regions. While drought patterns are primarily driven by a lack of precipitation, the allocation of conservation practices are driven by many factors, such as landscape characteristics, distribution of agricultural lands (Fig. 1), previous weather events that may have motivated farmers to seek solutions, access to financial and technical assistance, and decisions of conservation professionals on where to focus their efforts. In the continental USA, studies indicate a strong relationship between drought risk and conservation program participation at the county scale (Wallander et al., Reference Wallander, Aillery, Hellerstein and Hand2013). In Puerto Rico, however, patterns of farmer's participation may be responding to different motivations unrelated to drought. For instance, hotspots of water availability conservation practices coincide with the location of state-owned agricultural lands (i.e., Agricultural Reserves) where water availability practices are promoted. In addition, there is a historical component to the clustering of water availability practices along the coasts. Sugar cane production was long concentrated in the coastal valleys and primarily relied on flood irrigation. As sugar cane was replaced by other crops in the early 20th century, irrigation practices transitioned from flood to drip irrigation for water conservation purposes. Drip irrigation and other water availability practices continued to be adopted in this region (Mario Rodríguez, personal communication May 30, 2017). Hotspots of soil health practices in the mountains may be related to concerns over soil erosion on steep slopes. Conservation practices associated with soil health and erosion mitigation modify the effects of droughts on agriculture. Soil conservation hotspots also coincide with areas where the US Forest Service and Fish and Wildlife Service (FWS) promote initiatives for shade-grown coffee. Much of Puerto Rico's coffee is grown on steep slopes with shade and cover crops showing substantial erosion mitigation benefits (Hartemink, Reference Hartemink2006). Funds from FWS are typically assigned to coffee growers with cover crops and conservation cover practices on their farms. Hotspots of plant health could also be associated to areas of steeper slopes that are more susceptible to erosion, but they also appear to also coincide with areas of grasslands for which there are many plant-health practices available. The NRCS was historically known as the Soil Conservation Office and was created largely to deal with the large-scale erosion associated with the Dust Bowl. Consequently, many farmers primarily associate NRCS initiatives with soil issues and may be more comfortable working with the agency to adapt soil health practices (José Castro, personal communication May 6, 2017). Another possible reason for the general mismatch could be that most historic drought events have been of short duration and regional extent. The 2014–2016 event in this study may be too recent to demonstrate any changes in patterns of drought conservation practices.
Our analyses indicate that the general mismatch we observed corresponds to multiple causal factors and do not necessarily indicate a failure in the response of farmers or NRCS to drought conditions.
Nonetheless, our study highlights the areas that were subject to drought in the past and lacked drought preparedness. Taking into consideration projections of drought, our analysis highlights past drought areas that will also be vulnerable to drought conditions in the future. This indicates that, at a landscape scale, encouraging drought conservation practices in the eastern and southern portions of Puerto Rico could be beneficial in building resilience to the anticipated effects of climate change.
Given projected increases in drought events and intensity, the allocation of program recruitment efforts should be an important consideration in designing future drought adaptation programs in farmlands. A possible challenge to implementing conservation practices where most needed relates to factors influencing landowner's willingness to participate in government incentive-driven conservation programs. A case study of farmers’ participation in US Forest Service Land Conservation Programs found that two of the top five reasons mentioned by landowners for not being interested in taking part in conservation programs included lack of trust in government program, and lack of interest in being involved with government bureaucracy (López-Marrero et al., Reference López-Marrero, Meyn and Hermansen-Baez2011). This study also found a general lack of knowledge of programs and their offerings. In personal conversations, NRCS personnel indicated other factors could be limiting farmer's participation in NRCS conservation programs including fear of land grabbing by the federal authorities if contract agreements are not met, unresolved land tenure issues and an unwillingness to complete procedural steps required for enrollment. In addition, NRCS personnel also observed a greater willingness on the part of young farmers to institute drought mitigation practices (Vivian Vera, personal communication May 30, 2017). Other farmers were reluctant to incorporate NRCS recommendations, such as cover crops because they ran counter to customary practices of clearing the land of vegetation. All of these examples indicate the need to investigate the awareness and attitudes of landowners towards incentive-driven conservation programs and their willingness to participate (López-Marrero et al., Reference López-Marrero, Meyn and Hermansen-Baez2011). Overall, the social aspects of droughts should be deemed as important as the physical aspects when assisting farmers in regards to drought preparedness and in planning to mitigate drought effects across the agricultural sector.
Concluding remarks
Agricultural drought is one of the major challenges faced by tropical farming systems. In the US Caribbean, where the majority of the food is imported and where the agricultural sector is striving to grow, drought constitutes a critical yet understudied climatic stressor. This study provided insights on the location and extent of recent droughts in Puerto Rico and the coverage of agriculture conservation practices that mitigate drought conditions. From 2000 to 2016, a total of seven droughts were registered by the USDM, with the most profound event occurring in 2014 to 2016. Drought exposure did not drive the allocation of drought-related practices nor did it motivate significant farmer participation. Future planning for drought adaptability in farmlands is a matter of utmost importance given scientific consensus of increasing drought frequencies and intensities in the region. This planning would be most effective if it were accompanied by practices supporting the implementation of water storage systems in rainfed farms such as cisterns, as well as other conservation measures that have been proven successful elsewhere in the Caribbean (e.g., Saint Croix). The extent to which specific conservation practices can reduce drought vulnerability is an important area for future research. Additionally, conservation program planners benefit from understanding farmers’ critical vulnerabilities and their willingness to enroll in conservation programs, particularly those that are related to drought adaptation.
Supplementary material
The supplementary material for this article can be found at https://doi.org/10.1017/S174217051800011X
Acknowledgements
The authors acknowledge the following for their indispensable help and expertise in completing this paper: Ileana Curbelo, Edwin Más, José Castro, Odalys Martínez, Mariano Arguelles, Mario Rodríguez, José Santiago, Vivian Vera, Winston Martínez, Isabel Parés-Ramos, Serge Aucoin and Maya Quiñones. The authors also like to thank all reviewers and the International Institute of Tropical Forestry staff for their support. All research at the International Institute of Tropical Forestry is done in collaboration with the University of Puerto Rico.


