

Current treatments of schizophrenia mostly target dopamine receptors and are effective at alleviating positive symptoms, but are often unable to reduce negative and cognitive symptoms. Drugs that can treat all symptoms typically come with undesirable side- effects, and their mechanism is only partly understood.Reference Poels, Kegeles, Kantrowitz, Slifstein, Javitt and Lieberman 1 To better understand the source of the symptoms of schizophrenia, alternative/supplemental mechanisms to dopamine abnormalities must be explored. Glutamatergic theories of schizophrenia propose that positive, negative and cognitive symptoms in the disorder share a common origin in dysfunction of glutamate (Glu) neurotransmission.Reference Coyle and Tsai 2 , Reference Gilbert-Rahola and Villena-Rodriguez 3 This proposal originated from animal studies, and then human studies, that observed agonists of the N-methyl-D-aspartate (NMDA) glutamate receptor–specifically, ketamine and phencyclidine (PCP)–induce similar symptoms to schizophrenia in their otherwise healthy hosts.Reference Javitt, Zukin, Heresco-Levy and Umbricht 4 The mechanism by which Glu dysfunction occurs is not yet understood, but the NMDA receptor may be involved. Both Glu and glutamine (Gln) have been implicated in schizophrenia through studies using proton magnetic resonance spectroscopy (1H-MRS) that show a tendency for Gln to be increasedReference Théberge, Bartha, Drost, Menon, Malla and Takhar 5 and Glu to be decreased early in the illness, with faster declines with age relative to controls.Reference Marsman, Van Den Heuvel, Klomp, Kahn, Luijten and Hulshoff Pol 6 Another possible source of dysfunction in glutamatergic neurotransmission is glycine (Gly), a necessary co-agonist for the NMDA receptor. For Glu to bind with the NMDA receptor, Gly needs to bind with the receptor at a separate site. The Gly pathway has been the target of new drug interventions for schizophrenia, with limited success so far.Reference Poels, Kegeles, Kantrowitz, Slifstein, Javitt and Lieberman 1 , Reference Gilbert-Rahola and Villena-Rodriguez 3 , Reference Harvey and Yee 7 To date, there have been no 1H-MRS studies of Gly in schizophrenia.
Of interest in schizophrenia is the involvement of Glu, Gln and Gly in a critical brain circuit putatively implicated in schizophrenia known as the limbic basal ganglia-thalamocortical (BGTHC) pathwayReference Williamson 8 by which motivation translates into behaviour. The limbic BGTHC is one of the five BGTHC circuits identified that communicate between the basal ganglia and thalamus before reaching back out to the cortex. The thalamus, a central component of the BGTHC circuits, has previously been implicated in schizophrenia.Reference Théberge, Bartha, Drost, Menon, Malla and Takhar 5 , Reference Marsman, Van Den Heuvel, Klomp, Kahn, Luijten and Hulshoff Pol 6 , Reference Théberge, Al-Semaan, Williamson, Menon, Neufeld and Rajakumar 9 The anterior cingulate cortex (ACC) is another node of the limbic BGTHC that has been implicated in schizophrenia through 1H-MRS,Reference Théberge, Bartha, Drost, Menon, Malla and Takhar 5 , Reference Marsman, Van Den Heuvel, Klomp, Kahn, Luijten and Hulshoff Pol 6 functional 1H-MRSReference Taylor, Neufeld, Schaefer, Densmore, Rajakumar and Osuch 10 and functional magnetic resonance imaging (MRI) studies.Reference Boksman, Théberge, Williamson, Drost, Malla and Densmore 11 Therefore, both the thalamus and the ACC are candidate brain areas to study potential dysfunction in glutamatergic neurotransmission in schizophrenia.
Disease specificity of results is difficult to ascertain in studies comparing a psychiatric group to healthy controls. Major depressive disorder (MDD) has previously been assessed with 1H-MRS although findings have been inconsistent.Reference Yildiz-Yesiloglu and Ankerst 12 Traditional negative symptoms of schizophrenia can overlap with common symptoms of MDD, and Glu abnormalities have been implicated in mood disorders.Reference Yildiz-Yesiloglu and Ankerst 12 Therefore, the purpose of this study was to examine metabolite signals in voxels located in the ACC and thalamus of individuals with schizophrenia, compared to healthy controls and a psychiatric control group (MDD) using 1H-MRS with a 7 Tesla MRI scanner. Because of the previous findings of increased GlnReference Théberge, Bartha, Drost, Menon, Malla and Takhar 5 , Reference Marsman, Van Den Heuvel, Klomp, Kahn, Luijten and Hulshoff Pol 6 and decreased GluReference Marsman, Van Den Heuvel, Klomp, Kahn, Luijten and Hulshoff Pol 6 in frontal brain areas in early schizophrenia, these changes were expected in the ACC and thalamus of volunteers with schizophrenia relative to the healthy controls and the MDD group. Gly abnormalities were also expected, but it is unknown which direction to expect the abnormalities. It has recently been shown that there is reduced myo-inositol (Myo)Reference Yildiz-Yesiloglu and Ankerst 12 – Reference Coupland, Ogilvie, Hegadoren, Seres, Hanstock and Allen 14 and reduced GluReference Yildiz-Yesiloglu and Ankerst 12 in MDD, which were also hypothesised in this study.
Method
Participants
Sixteen volunteers with schizophrenia, 17 with MDD and 18 healthy controls gave informed written consent according to the guidelines of the Review Board for Health Sciences Research Involving Human Subjects at the University of Western Ontario. Volunteers with neurological or major medical illnesses, clinically significant head injury, other psychiatric disorders, MRI contraindications or substance abuse within the previous year were excluded from the study. Any healthy volunteer with a known family history of psychiatric disorder in a first- or second-degree relative was excluded.
A consensus diagnosis was established on all participants by a psychiatrist and a trained assistant with the Structured Clinical Interview for DSM-IV.Reference First, Spitzer, Gibbon and Williams 15 Participants with schizophrenia were rated with the Scale for the Assessment of Negative Symptoms and the Scale for the Assessment of Positive Symptoms,Reference Andreasen 16 , 17 and participants with MDD were assessed with the Montgomery–Åsberg Depression Scale,Reference Montgomery and Asberg 18 the Young Mania Rating ScaleReference Young, Biggs, Ziegler and Meyer 19 and the Hamilton Depression Rating Scale.Reference Hamilton 20 Fourteen participants with schizophrenia were being treated with atypical antipsychotics with chlorpromazine equivalent 409 (293) mg (three taking olanzapine, four taking paliperidone, two taking risperidone, and the remaining individuals taking the following, respectively: quetiapine/venlafaxine; quetiapine/paliperidone/escitalopram; clozapine; risperidone/escitalopram; quetiapine/escitalopram) and two patients were not medicated. Ten of the 17 MDD participants were being treated with antidepressant medications at the time of the scan (bupropion/citalopram/methylphenidate, venlafaxine, lamotrigine, desvenlafaxine, bupropion/citalopram, escitalopram, citalopram, sertraline, citalopram/mirtazapine/quetiapine, levothyroxine/melatonin). Demographic information was collected as in our previous studyReference Aoyama, Théberge, Drost, Manchanda, Northcott and Neufeld 21 and is shown in Table 1.

| Group | Controls | MDD | Schizophrenia | P |
|---|---|---|---|---|
| n | 18 | 17 | 16 | |
| Age | 23.9 (4.6) | 22.5 (4.6) | 22.7 (2.9) | 0.570 |
| M/F | 11/7 | 6/11 | 13/3 | 0.018 |
| R/L | 16/2 | 15/2 | 15/1 | 0.824 |
| Educ | 3.1 (0.8) | 2.6 (0.6) | 2.2 (0.8) | 0.010 |
| PEduc | 3.1 (0.9) | 2.9 (0.8) | 3.3 (0.8) | 0.424 |
| Smokers/not | 0/18 | 2/15 | 8/8 | <0.001 |
| HAM-A | 12.8 (10.5) | |||
| HAM-D | 12.8 (8.9) | |||
| Mania | 5.1 (6.7) | |||
| Montg | 18.0 (10.4) | |||
| CPZ (mg) | 358 (307) | |||
| SANS | 9.7 (7.7) | |||
| SAPS | 7.6 (10.4) | |||
| Illness duration (months) | 28.6 (14.4) | 29.5 (15.7 |
M/F, male/female; R/L, right/left; Educ, education rating of the participant (1, gr. 10 or lower; 2, completed high school; 3, 1–3 years of college/university; 4, >3 years of college/university); PEduc, education rating of the participant's parent (1, gr.10 or lower; 2, completed high school; 3, 1–3 years of college/university; 4, >3 years of college/university); HAM-A, Hamilton Anxiety Scale; HAM-D, Hamilton Depression Scale; Mania, mania rating from the Young Mania Rating Scale; Montg, result of the Montgomery Asberg Depression Scale; CPZ, chlorapromazine equivalent; SANS, Scale for Assessment of Negative Symptoms, SAPS, Scale for Assessment of Positive Symptoms; MDD, major depressive disorder; P, ANOVA test for significance (alpha=0.05, two-tailed), bolded values indicate significance.
1H-MRS data collection and analysis
Most 1H-MRS studies of the ACC and thalamus in schizophrenia have been quantified at lower MRI magnetic field strengths (B0), where Glu and Gln spectral signatures overlap and are difficult to reliably quantify individually. Stronger B0 translate to increased sample magnetisation and a linear increase in the signal-to-noise ratio (SNR), assuming body noise dominance. An additional essential feature of stronger B0 is increased metabolite separation in the 1H-MRS spectra, as the ratio of the magnitude of metabolites’ J-coupling constants to their chemical shift dispersion (both measured in Hertz) decreases. Also, strongly coupled metabolites like Glu and Gln (featuring first- and second-order J-coupling) become more weakly coupled at higher B0 (first-order J-coupling only). Similarly, the Gly resonance separates from the large Myo peaks with increasing B0. Higher SNR and improved metabolite spectral signature separation should result in improved metabolite quantification. For these reasons, all measurements were acquired on a 7 T Agilent/Magnex head-only MRI (Agilent, Inc., Walnut Creek, California, USA) with a Siemens AC84 head gradient coil (Siemens, Erlangen, Germany), located at the Center for Functional and Metabolic Mapping at the University of Western Ontario. A transmit-only, receive-only (TORO) head coil with 15 transmitters and 23 receiversReference Gilbert, Curtis, Gati, Klassen and Menon 22 was used for all scans. A map of the transmit field for each transmitter was acquired at the beginning of the session to facilitate homogeneity optimisation using an automated B1-shimming approach.Reference Curtis, Gilbert, Klassen, Gati and Menon 23 The B0 uniformity was adjusted automatically over the field of view (FOV) with first- and second-order shims using RASTAMAPReference Klassen and Menon 24 before all acquisitions.
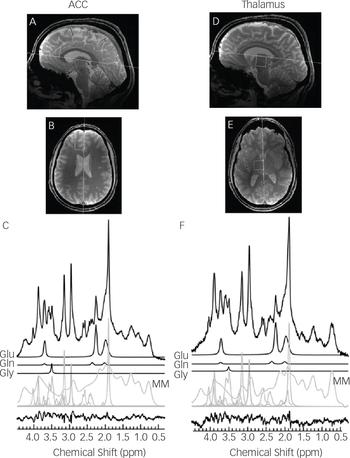
The 1H-MRS voxels were 2.0×2.0×2.0 cmReference Gilbert-Rahola and Villena-Rodriguez 3 in size and located in the left thalamus and left dorsal anterior cingulate. The left locations were chosen based on previous results by this group at lower B0.Reference Théberge, Bartha, Drost, Menon, Malla and Takhar 5 , Reference Théberge, Al-Semaan, Williamson, Menon, Neufeld and Rajakumar 9 Voxels were placed and angled using anatomical landmarks (Fig. 1) on two fast low-angle shot 2D anatomical imaging sequences in the sagittal (45 slices, repetition time (TR)=950 ms, echo time (TE)=5.23 ms, flip-angle (α)=30°, gap=1 mm, thickness=2 mm, field of view 220×220 mm, matrix size=220×220) and axial (20 slices, TR=500 ms, TE=5.23 ms, α=30°, gap=1 mm, thickness=2 mm, FOV=220×220 mm, matrix size=220×220) directions, with lipid saturation.
Spectra were acquired using an ultra-short TE stimulated echo acquisition mode (STEAM) sequence with outer volume suppressionReference Tkac and Gruetter 25 (TR=3 s, TE=10 ms, mixing time=32 ms, 4000 complex pairs, 4 steady-state scans, 1 s acquisition time, 8 step phase cycle). There were 64 averages of water-suppressed spectra acquired individually for each voxel location, with 16 water-unsuppressed spectra acquired to correct metabolite lineshapes and act as an internal concentration reference. The VAPOR preparation sequenceReference Tkac and Gruetter 25 was used for water suppression. Separate metabolite-suppressed spectra were acquired to assess the macromolecule content individually for each participant with two inversion times as published in Penner & Bartha.Reference Penner and Bartha 26 This macromolecular spectrum was then fit and included in the individual fitting template. Each acquisition produced one spectrum for each of the 23 receivers that needed to be combined prior to use.Reference Brown 27 Spectra were then frequency and phase corrected before averaging. Quality Eddy Current Correction (QUECC)Reference Bartha, Drost, Menon and Williamson 28 reduced linewidth distortions before spectral fitting with fitMAN, a time-domain fitting algorithm.Reference Bartha, Drost and Williamson 29 Metabolite concentrations were corrected for grey and white matter content using the segmentation algorithm in Statistical Parametric Mapping 8 (SPM8, Wellcome Trust Centre for Neuroimaging, London, UK). All spectra were inspected visually for quality by a trained spectroscopist. Metabolite concentration estimates were screened for outliers at the group level. Only metabolites with Cramer-Rao lower bounds (CRLB) less than 20% were included in the analysis, with the exception of Gly, which had a limit of 30%. The CRLB limit for Gly was increased because it has a lower metabolite concentration and is inherently difficult to quantify. Estimates of the CRLB depend largely on the mean signal from the metabolite. Therefore, a stricter limit for Gly could then potentially skew the results by specifically excluding lower concentration measurements.
One-tailed t-tests (P<0.05/3) were employed to explore the directional hypotheses of decreased Glu and increased Gln in schizophrenia group, and decreased Glu in the MDD group (three comparisons each). One-tailed t-tests (P<0.05/2) evaluated decreased Myo in the MDD group relative to controls and the schizophrenia group, and two-tailed t-tests (P<0.05/2) evaluated Gly differences in the schizophrenia group compared to the MDD group and controls (two comparisons each). The authors felt that these corrections for multiple comparisons struck a reasonable balance between Type 1 and Type 2 error risks.Reference Marascuilo and Levin 30 A multivariate analysis of variance (MANOVA) tested for significant differences in both brain areas for these metabolites (Glu, Gln, Gly and Myo), and another MANOVA examined the remaining metabolites (glutathione (GSH), taurine (Tau), aspartate (Asp), scyllo-inositol (Scy), ascorbate (Asc), total choline (TCH; choline + phoshporylcholine + glycerophosphorylcholine), total creatine (TCR; creatine + phosphocreatine) and total N-acetylaspartate (TNAA; N-acetylaspartate + N-acetylaspartylglutamate)). All statistical tests were completed using SPSS v.20 (IBM Corp, Armonk, New York, USA).
Each metabolite's spectral signature was simulated using GAVAgui, an in-house program designed by a medical physicist (J.T.). The program is an interface to code designed by Brian Soher that uses the GAMMA simulations packageReference Soher, Young, Bernstein, Aygula and Maudsley 31 to predict the response of spin systems to the STEAM pulse sequence. The interface allows the selection of a given echo time (TE), mixing time (TM), B0 and spin system and transforms the output of the GAMMA simulation in a list of the predicted resonances and their relative parameters compatible with the file format of the Lawson Fitman Spectral Analysis Suite (Dr. Théberge J. Lawson's imaging website, https://www.lawsonimaging.ca/imaging/user/22/profile).Reference Bartha, Drost and Williamson 29 J-coupling constants and chemical shifts used were derived from the literature.Reference Krawczyk and Gradowska 32 , Reference Govindaraju, Young and Maudsley 33
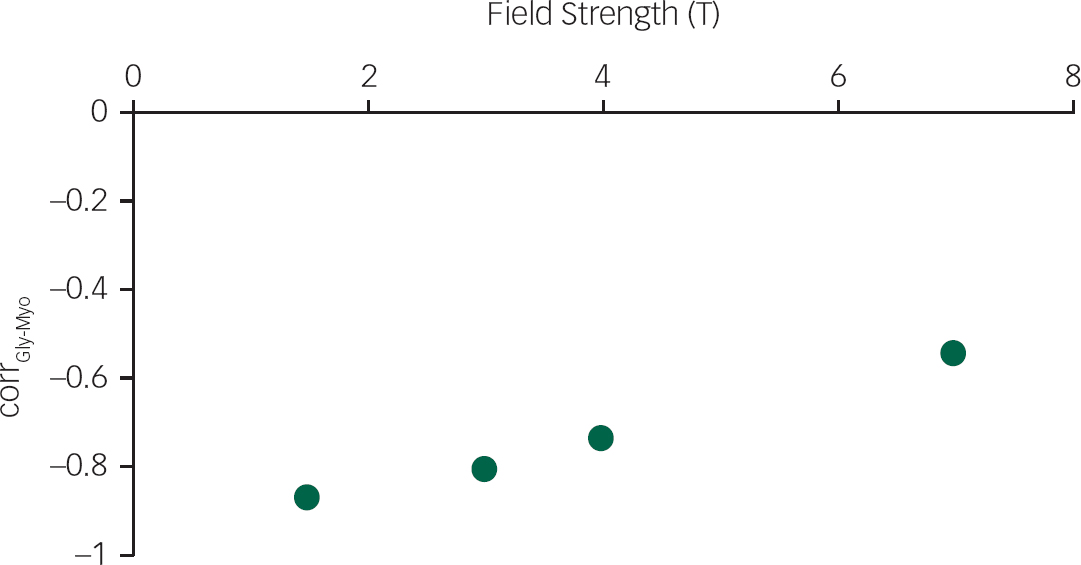
To demonstrate the feasibility of quantifying Gly separately from Myo at 7 T, 500 simulations of Gly and Myo spectral signatures with known concentrations for the same STEAM sequence (TE=10 ms, TM=32 ms) at each of the 4 B0 (1.5 T, 3 T, 4 T and 7 T) were created and given random noise comparable to a 64 average spectrum, and then fit. The amount of noise was determined using the SNR value for a single 7 T scanReference Mangia, Tkác, Gruetter, Van de Moortele, Maraviglia and Uğurbil 34 and assuming a linear SNR change with B0. Correlations between Gly and Myo concentrations were then calculated.
Results
The simulations of Gly and Myo demonstrated significantly improved separation of the two metabolites at 7 T compared to 1.5 T (P<0.001), 3 T (P<0.001) and 4 T (P<0.001) (Fig. 2). In vivo 1H-MRS spectra were acquired with voxels in the ACC and thalamus of all participants with the exception of one healthy control who did not wish to finish the scan of the thalamus because of dizziness. Average water linewidths were 13.2 (1.3) Hz and 16.9 (2.1) Hz for the healthy controls, 12.1 (0.9) Hz and 16.0 (1.8) Hz for the MDD group, and 12.8 (1.6) Hz and 16.9 (2.2) Hz for the schizophrenia group in the ACC and thalamus, respectively, indicating well shimmed data. There were no significant differences in the water linewidths between groups, and there were no significant differences in grey matter, white matter or cerebrospinal fluid volume per voxel between groups. One spectrum from the ACC of volunteers from each of the MDD and schizophrenia groups needed to be excluded because of poor-quality spectra, likely because of excessive movement. Example spectra from each brain region with spectral fits of Glu, Gln, Gly and the macromolecular spectrum can be seen in Fig. 1. In the thalamus, one patient from the schizophrenia group and one healthy control each presented with Gly concentrations that had CRLB of 35% and were excluded.
Although we had a priori grounds for our contrasts involving Gln, Glu, Gly and Myo concentrations, we nevertheless would note in passing that a MANOVA between groups in both regions was significant (P=0.002), whereas the MANOVA for the remaining metabolites was not significant (P=0.212). Increased Gln concentrations were observed in the thalamus of the schizophrenia group relative to the healthy controls (P=0.009) but not the MDD group (P=0.072). There were no significant between-group differences in Glu concentrations in either the ACC (Table 2) or the thalamus (Table 3). Gly concentrations were significantly reduced in the thalamus of the schizophrenia group relative to both the healthy controls (P=0.017) and the MDD group (P=0.012), but no differences in Gly were observed in the ACC (P=0.385, P=0.184, respectively). If the two patients with thalamic Gly concentrations with >30% CRLB were included, Gly concentrations were even more significantly reduced (P=0.016, healthy controls; P=0.008, MDD). Myo was reduced in the MDD group relative to the healthy controls (ACC: P=0.009; thalamus: P=0.014) and the schizophrenia group (ACC: P=0.001; thalamus: P=0.002). Concentrations of each metabolite with the pairwise comparisons for each group are shown for the ACC and the thalamus in Tables 2 and 3, respectively.

| ACC | ||||||
|---|---|---|---|---|---|---|
| HC | MDD | Schizophrenia | P(HC-MDD) | P(HC-SZ) | P(MDD-SZ) | |
| Glu | 10.0 (1.3) | 10.4 (0.7) | 10.7 (1.2) | 0.354 | 0.064 | 0.363 |
| Gln | 2.0 (0.5) | 1.9 (0.7) | 2.0 (1.0) | 0.592 | 0.385 | 0.408 |
| Gly | 0.9 (0.3) | 1.0 (0.2) | 0.9 (0.2) | 0.234 | 0.837 | 0.184 |
| Gsh | 1.3 (0.4) | 1.2 (0.2) | 1.4 (0.4) | 0.334 | 0.303 | 0.060 |
| Tau | 1.6 (0.3) | 1.6 (0.4) | 1.7 (0.4) | 0.671 | 0.484 | 0.284 |
| Asp | 2.8 (1.5) | 2.1 (1.2) | 2.9 (1.3) | 0.134 | 0.925 | 0.128 |
| Myo | 8.0 (0.8) | 7.2 (0.7) | 8.4 (1.3) | 0.009 | 0.327 | 0.002 |
| Scy | 0.5 (0.2) | 0.4 (0.1) | 0.6 (0.2) | 0.026 | 0.406 | 0.004 |
| Asc | 1.1 (0.4) | 1.1 (0.7) | 1.4 (0.7) | 0.984 | 0.237 | 0.249 |
| TCH | 2.4 (0.3) | 2.4 (0.2) | 2.4 (0.3) | 0.805 | 0.792 | 0.625 |
| TCR | 8.9 (1.0) | 8.9 (0.7) | 9.5 (1.0) | 0.929 | 0.052 | 0.075 |
| TNAA | 11.0 (1.4) | 11.5 (0.6) | 11.6 (0.8) | 0.236 | 0.107 | 0.673 |
AC, anterior cingulate cortex; HC, healthy controls; MDD, major depressive disorder; SZ, schizophrenia; Glu, glutamate; Gln, glutamine; Gly, glycine; Gsh, glutathione; Tau, taurine; Asp, aspartate; Myo, myo-inositol; Scy, scyllo-inositol; Asc, ascorbate; TCH, total choline; TCR, total creatine; TNAA, total NAA. Bolded values indicate statistical significance (alpha<0.05/2, one-tailed, for Myo; alpha<0.05/3, two-tailed, for Scy).

| Thalamus | ||||||
|---|---|---|---|---|---|---|
| HC | MDD | Schizophrenia | P(HC-MDD) | P(HC-Schizophrenia) | P(MDD-Schizophrenia) | |
| Glu | 7.4 (0.6) | 7.8 (0.9) | 7.4 (1.0) | 0.161 | 0.493 | 0.173 |
| Gln | 1.3 (0.6) | 1.5 (0.7) | 1.9 (0.6) | 0.309 | 0.009 | 0.072 |
| Gly | 0.9 (0.3) | 0.9 (0.3) | 0.7 (0.1) | 0.906 | 0.017 | 0.012 |
| Gsh | 1.3 (0.3) | 1.2 (0.2) | 1.4 (0.3) | 0.355 | 0.295 | 0.054 |
| Tau | 1.9 (0.5) | 2.2 (0.6) | 2.3 (0.4) | 0.142 | 0.034 | 0.496 |
| Asp | 2.5 (1.4) | 3.2 (1.8) | 3.4 (1.9) | 0.273 | 0.180 | 0.786 |
| Myo | 7.2 (0.8) | 6.4 (1.2) | 7.4 (1.0) | 0.014 | 0.447 | 0.004 |
| Scy | 0.4 (0.1) | 0.4 (0.1) | 0.4 (0.1) | 0.235 | 0.422 | 0.052 |
| Asc | 0.9 (0.7) | 0.7 (0.5) | 1.2 (0.5) | 0.289 | 0.259 | 0.033 |
| TCH | 2.2 (0.2) | 2.2 (0.2) | 2.2 (0.2) | 0.892 | 0.764 | 0.665 |
| TCR | 6.5 (0.8) | 6.4 (0.9) | 6.5 (0.8) | 0.702 | 0.795 | 0.907 |
| TNAA | 11.1 (0.9) | 11.0 (1.0) | 10.8 (0.9) | 0.722 | 0.465 | 0.703 |
HC, healthy controls; MDD, major depressive disorder; Glu, glutamate; Gln, glutamine; Gly, glycine; Gsh, glutathione; Tau, taurine; Asp, aspartate; Myo, myo-inositol; Scy, scyllo-inositol; Asc, ascorbate; TCH, total choline; TCR, total creatine; TNAA, total NAA. Bolded values indicate statistical signficance (alpha<0.05/3, one-tailed, for Gln; alpha<0.05/2, two-tailed, for Gly; alpha<0.05/2, one-tailed, for Myo).
Although the MANOVA was not significant, the pairwise comparisons reveal a significant decrease in Scy in the ACC of the MDD group relative to the schizophrenia group (P=0.004), and there was a near-significant contrast to the healthy controls (P=0.027). These results should be taken with caution, considering the non-significant result at the multivariate level; they nevertheless may provide grounds for future hypothesis.
Discussion
Glutamate and glutamine
The significant increase in thalamic Gln concentrations in the schizophrenia group relative to healthy controls (P=0.009) is consistent with the original hypothesis and agrees with previous studies.Reference Théberge, Bartha, Drost, Menon, Malla and Takhar 5 , Reference Marsman, Van Den Heuvel, Klomp, Kahn, Luijten and Hulshoff Pol 6 Glu is stored in neuronal vesicles until it is required for neurotransmission and released into the synaptic cleft. Glu then binds with receptors on the post-synaptic membrane, including the NMDA receptor. When Glu has been released, it is actively transported into adjacent glial cells where it can be converted to Gln via glutamine synthetase and transported back into the neuron.Reference Mark, Prost, Ulmer, Smith, Daniels and Strottmann 35 The increased Gln could mean a reduced efficiency of converting back to Glu via phosphate-activated glutaminase and may underlie a contributing mechanism to NMDA receptor hypofunction. Perhaps more likely, the increased Gln could be directly because of reduced NMDA receptor activation, which would lead to increased Gln via increases in the glutamine synthetase activity.Reference Kosenko, Llansola, Montoliu, Monfort, Rodrigo and Hernandez-Viadel 36 Catalytic action of Gln synthetase is highly regulated by the concentration of ammonium ions.Reference Kosenko, Llansola, Montoliu, Monfort, Rodrigo and Hernandez-Viadel 36 Our results found no change in Glu concentrations, whereas increased levels of Gln may indicate an increased concentration of ammonium ions in the thalamic astrocytes in patients with schizophrenia, a potential biochemical alteration that deserves further investigation.
The lack of significant Glu and Gln comparisons in the ACC and Glu comparisons in the thalamus did not agree with our original hypothesis. The absence of significant Gln increases in the ACC could be because of the duration of illness of this sample of patients with schizophrenia (29.50 (17.50) months), as it has been shown that patients with schizophrenia have increases at the onset of the illness but then have decreases with age at a rate faster than healthy controls.Reference Marsman, Van Den Heuvel, Klomp, Kahn, Luijten and Hulshoff Pol 6
There were no significant differences in Glu or Gln in the schizophrenia group compared to the MDD group, although a non-significant (trend-level) increase in Gln in the thalamus was observed (P=0.072). It is possible that significant differences may be observed with increased statistical power occurring to a larger sample. It is also possible that Gln changes in the schizophrenia group are larger than in the MDD group because of the greater severity of symptoms.
The MDD group did not significantly differ from the healthy control in Glu and Gln concentrations. It has previously been shown that decreased Glu (often observed as Glx (Glu+Gln)) is a common finding in MDD compared to healthy controls.Reference Yildiz-Yesiloglu and Ankerst 12 This was not observed in this study, potentially because of variations in the duration of illness.
Gly as a potential therapeutic target
Studies have examined Gly within the serum and plasma of people with schizophrenia,Reference Yamamori, Hashimoto, Fujita, Numata, Yasuda and Fujimoto 37 , Reference Hons, Vasatova, Cermakova, Doubek and Libiger 38 but no studies have examined Gly concentrations in people with schizophrenia using 1H-MRS. This is partly because of the difficulty in examining Gly in vivo. At lower B0, the Gly peak overlaps strongly with the Myo peak. The use of a 7 T MRI provided adequate peak separation and signal for quantifying Gly separately from Myo. Indeed, Gly has previously been quantified at 7 T using a similar STEAM sequence.Reference Lin, Stephenson, Xin, Napolitano and Morris 39
The reduction in Gly observed in the thalamus of the schizophrenia group corresponds with the observed increases in Gln. Without an adequate supply of Gly, Glu neurotransmission, via the NMDA receptor, will be impeded. The synaptic supply of Gly is normally maintained below the level of saturationReference Harvey and Yee 7 and any decrease in Gly could directly reduce NMDA activity. Decreases in NMDA activity lead to decreased inhibition of glutamine synthetase and, as a result, increased Gln concentrations.Reference Kosenko, Llansola, Montoliu, Monfort, Rodrigo and Hernandez-Viadel 36
Many strategies towards altering glutamatergic activity via pharmacological interventions have been explored. Glu does not cross the blood–brain barrier well, and extracellular concentrations need to be controlled to prevent excitotoxicity.Reference Mark, Prost, Ulmer, Smith, Daniels and Strottmann 35 Other strategies have targeted Gly or Gly transporters. Gly is rapidly metabolised and does not cross the blood–brain barrier well either,Reference Harvey and Yee 7 but oral administrations have led to detectable changes in the brain using 1H-MRS.Reference Kaufman, Prescot, Ongur, Evins, Barros and Medeiros 40 Gly activity is modulated by Gly transporter proteins, GlyT2 and GlyT1.Reference Gilbert-Rahola and Villena-Rodriguez 3 GlyT2 is involved in the inhibitory function of Gly neurotransmission, whereas GlyT1 regulates concentrations of Gly in the synaptic cleft.Reference Harvey and Yee 7 New drug therapies are selectively targeting this GlyT1 transporter protein to increase the synaptic availability of Gly and hence to increase NMDA receptor activity.Reference Umbricht, Alberati, Martin-Facklam, Borroni, Youssef and Ostland 41 One study found that Gly concentrations increased in the plasma of patients with schizophrenia after receiving clozapine treatment,Reference Yamamori, Hashimoto, Fujita, Numata, Yasuda and Fujimoto 37 and another study found that serum levels were significantly lower in patients taking clozapine.Reference Hons, Vasatova, Cermakova, Doubek and Libiger 38 A recent study examined how the administration of sarcosine, a GlyT1 inhibitor, affected metabolite concentrations in the hippocampus and found that Glx/Cr and Glx/Cho were decreased after treatment.Reference Strzelecki, Podgorski, Kaluzynska, Gawlik-Kotelnicka, Stefanczyk and Kotlicka-Antczak 42 A potential future study could use high-field 1H-MRS to detect Gly, Gln and Glu concentrations in the thalamus before and after a Gly- or Glu-modulating medication.
Inositol in MDD
The main observations in the MDD group were reduced Myo in the ACC and thalamus and reduced Scy in the ACC. Myo has many functions, including being an important osmolyte, a structural component of eucaryotic cells and a precursor for second messengers involved in neurotransmission.Reference Fisher, Novak and Agranoff 43 Myo is readily lost from brain tissue when cell integrity is compromised.Reference Fisher, Novak and Agranoff 43 It has commonly been described as a marker of glial cell integrity, but this has been brought into question as many neurons contain as much Myo, or more, than glial cells.Reference Fisher, Novak and Agranoff 43 There is a possibility that reduced Myo in this study is because of the significant gender differences between the groups (P=0.018), but that is unlikely given that reduced Myo has been previously reported in MDD frontal lobes,Reference Yildiz-Yesiloglu and Ankerst 12 , Reference Chen, Dai, Dai, Xu and Wu 13 in post-mortem brain tissueReference Coupland, Ogilvie, Hegadoren, Seres, Hanstock and Allen 14 and in cerebrospinal fluid.Reference Barkai, Dunner, Gross, Mayo and Fieve 44 Other studies have shown a normalisation or increase in Myo in recovered MDD patients,Reference Chen, Dai, Dai, Xu and Wu 13 and it is believed that drugs that reduce mania in bipolar disorder act by reducing Myo content.Reference Kofman and Belmaker 45 A recent meta-analysis by Mukai et al Reference Mukai, Kishi, Matsuda and Iwata 46 examined seven studies of mixed MDD, bipolar and premenstrual dysphoric disorder patients and suggests that inositol may have some therapeutic effect for people with depression. The reduction in Scy, an isomer of Myo, may indicate an involvement in the same process. It is becoming increasingly plausible that there exists a role for Myo in the manifestation of MDD. More studies are necessary to further elucidate the role played and whether Myo (or even Scy) could be a target of pharmacological intervention.
Limitations
There a few limitations of this study to address. The participants with schizophrenia and MDD were not considered first-episode, and as a result, many were medicated at the time of the scan. The participants were still scanned early in their illness to limit the influences of medication and to limit long-term metabolic changes that may develop as the disorders progress, but medications could still very well have influenced the results.
Another limitation is the 30% CRLB limit used for Gly measurements. Even at 7 T, the Gly concentrations can be difficult to quantify. Extending the CRLB limit to 30% allowed more concentrations to be included in the comparisons and prevented skewing of the data because of preferentially excluding patients with lower Gly concentrations.
Finally, smoking status was not controlled for between subject groups. It cannot be ruled out that some of the differences observed were due to the greater proportion of smokers in the schizophrenia group.
Future studies
Investigating Gly concentrations in the thalamus usingReference Poels, Kegeles, Kantrowitz, Slifstein, Javitt and Lieberman 1 H-MRS as influenced by the administration of oral Gly supplementation while tracking symptoms would be a worthwhile study. Gly concentrations in patients with schizophrenia taking clozapine should also be compared to those taking first- or second-generation antipsychotics. Similarly, in the MDD group, a 1H-MRS study investigating before and after effects of Myo supplementation in the diet should be explored.
As far as we are aware, this is the first 1H-MRS study examining the ACC and thalamus of patients with schizophrenia or MDD using a 7 T MRI and the first 1H-MRS study looking at Gly in patients with schizophrenia. No Glu differences were observed in either the ACC or the thalamus, but decreased Gly and increased Gln were observed in the thalamus in the schizophrenia group relative to healthy controls, supporting the notion of NMDA receptor hypofunction in the schizophrenia group. Decreased Myo was observed in the MDD group relative to the healthy control and schizophrenia groups in both the ACC and the thalamus, suggesting a possible role in the manifestation of the disorder.
Funding
This work was supported in part by a New Investigator Fellowship grant (J.T.) from the Ontario Mental Health Foundation (OMHF) and in part by operating funds from the Canadian Institute of Health Research (P.C.W., MT-12078). Additional salary support for R.T. was provided by the Ontario Graduate Scholarship of Science and Technology (OGSST) and the Ontario Graduate Scholarship (OGS).


 Open access
eLetters
No eLetters have been published for this article.