


1 Introduction
Fused silica optics are widely employed in high-energy/power laser systems such as inertial confinement fusion facilities[ Reference Betti and Hurricane 1 ] and laser weapons[ Reference Kaushal and Kaddoum 2 ] owing to their excellent optical transmittance and uniformity. Nevertheless, unavoidable surface defects such as scratches, pits and cracks are introduced during fabrication[ Reference Suratwala, Wong, Miller, Feit, Menapace, Steele, Davis and Walmer 3 – Reference Li, Hou, Xu, Wang, Yang and Guo 5 ]. Surface defects can induce sub-bandgap light absorption under high-energy ultraviolet laser pulses[ Reference Carr, Bude and DeMange 6 ], thereby triggering damage at the rear surface of optical components[ Reference Bercegol, Boscheron, Di-Nicola, Journot, Lamaignère, Něauport and Razě 7 ] and reducing their laser-induced damage threshold (LIDT). Moreover, the initial damage sites grow exponentially under subsequent pulses[ Reference Mary, Adra, Carr, Eugene, Michael, William, Zhi, Raluca, Alexander and Wegner 8 ], degrading downstream beam quality and further intensifying local fields[ Reference Zheng, Ma, Li, Liu and Chen 9 ]. This cascade of effects has become a key factor limiting both the output power and the lifetime of laser systems.
Studies on artificially introduced scratches on fused silica surfaces show that the damage threshold decreases as the scratch width increases[ Reference Alberto, Francois, Yoshiyama, Christopher and Mark 10 ], and scratches produced by larger abrasive particles during polishing enlarge the damaged area[ Reference Ye, Li, Xu, Jiang and Wang 11 ]. For real scratches on fused silica surfaces, studies have shown that trailing indent scratches exhibit lower damage performance, whereas radial scratches display higher damage performance[ Reference Jiang, Yuan, Xiang, Wang, Xu, Chen, Li, Zheng and Zu 12 ]. Current research on the damage performance of surface defects on fused silica optics is mainly based on defects artificially introduced by nano-indentation[ Reference Ye, Li, Xu, Yang and Jiang 13 , Reference Gu, Yao, Wang, Yang, Liu, Yan, Jiang, Geng, Wu, Li and Huang 14 ], laser irradiation[ Reference Rho, Miller, Yancey, Laurence, Carr and Yoo 15 ] or polishing[ Reference Ye, Li, Xu, Jiang and Wang 11 , Reference Li, Ye, Yuan, Liu, Zheng, Zhang, Zhao, Wang and Xu 16 ]. However, artificially introduced defects differ significantly in morphology and damage behavior from real defects, which limits their practical applicability. The damage performance and non-destructive testing methods for real surface defects on fused silica optics remain to be studied.
This study focuses on the multimodal characterization and damage performance testing of real scratches on fused silica optics surfaces. Atomic force microscopy (AFM) was employed to characterize the nanoscale structural properties of the scratches. Subsequently, low-magnification dark-field scattering images, high-magnification bright-field microscopic images and fluorescence decay images of the scratches were obtained. Statistical analysis was then performed to examine the correlations among the dark-field scattering intensity, scratch width, fluorescence intensity and their damage threshold. This approach validates the effectiveness of multimodal characterization techniques in assessing the damage performance of surface defects.
2 Experimental method
2.1 Multimodal detection of scratches
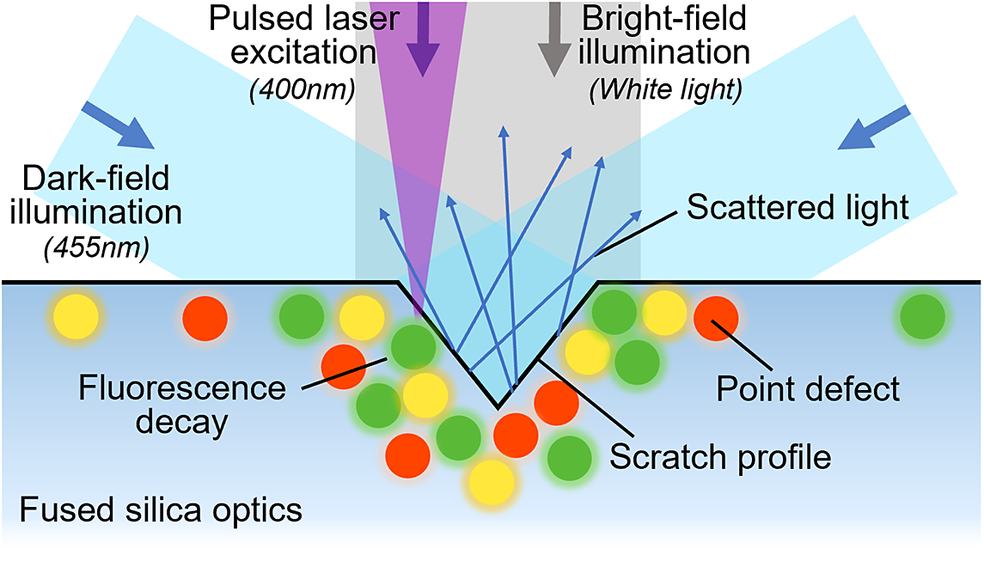
The samples used in this work were polished fused silica windows with dimensions of 20 mm × 20 mm × 5 mm, made of JGS-1 material. Real scratches on the sample surfaces were detected with the previously established multimodal surface defect detection system[ Reference Liu, Wang, Wang, Zhang, Zheng, Wu, Liu, Wang, Jin, Deng, Cheng and Liu 17 ], which integrates the dark-field imaging module, the bright-field imaging module and the fluorescence lifetime imaging module. A schematic diagram of the multimodal detection system is illustrated in Figure 1. The microscopic structure of surface defects on optical components typically manifests as micrometer-to-nanoscale indentations on a smooth surface, where the material undergoes plastic deformation or brittle fracture[ Reference Suratwala, Steele, Feit, Wong, Miller, Menapace and Davis 4 ], resulting in an increased density of point defects[ Reference Cheng, Ren, Zhang and Cheng 18 , Reference Zhang, Wang, Tan and Qiu 19 ].
Schematic diagram of the multimodal surface defect detection system.

The light source for the dark-field imaging module consists of collimated uniform light-emitting diodes (LEDs) arranged in an annular configuration. At each defect location, the incident light (455 nm) is scattered by the surface indentation, and the scattered light is collected by a low-magnification objective (numerical aperture (NA) 0.28) to generate dark-field images. A two-axis translation stage enables large-area detection and localization of defects. The bright-field imaging module employs a white-light LED for coaxial illumination and a high-magnification objective (NA 0.75) for imaging. Defect dimensions are extracted from the resulting bright-field images. The fluorescence lifetime imaging module utilizes a confocal time-resolved photoluminescence microscopy configuration[ Reference Becker, Bergmann, Hink, König, Benndorf and Biskup 20 – Reference Huang, Li, Yao, Yang, Lam, Zhang, Yan and Qu 23 ]. Point defects generate sub-bandgap energy states in fused silica[ Reference Yang, Zhao, Cheng, Chen, Liu, Wang, Han and Sun 24 ], inducing short-lifetime fluorescence under pulsed laser excitation[ Reference Laurence, Bude, Shen, Shen, Feldman, Miller, Steele and Suratwala 25 , Reference Deng, Cao, Tang, Zhou, Liu, Liu, Zhang, Chang, Ruan, Guo, Wang and Liu 26 ]. The sample is excited by the picosecond pulse laser (400 nm, 50 ps, 80 MHz), and the fluorescence decay is detected by a single-photon avalanche diode. The integration time for each sampling point is 500 ms. Photon counts in every time channel are summed to obtain the fluorescence intensity at each sampling point. The decay curve is fitted with a stretched-exponential model[ Reference Johnston 27 ] to extract the fluorescence lifetime. Time-resolved spatial maps are acquired through galvanometer mirror scanning.
2.2 Laser damage testing of scratches
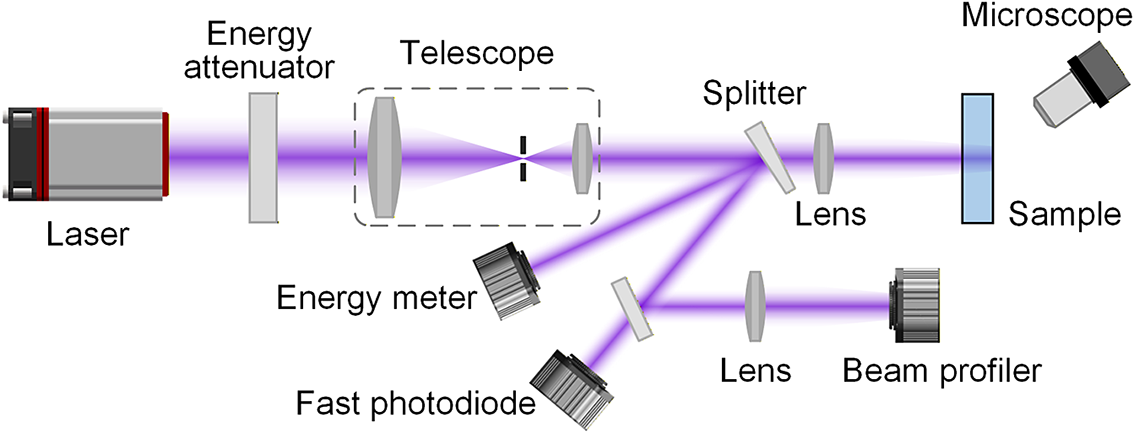
Following multimodal defect detection, the samples were relocated in the laser damage test system. These defects were then subjected to ultraviolet nanosecond laser irradiation for laser damage resistance evaluation. The experimental layout of the laser damage test system is illustrated in Figure 2. The third-harmonic neodymium-doped yttrium aluminum garnet (Nd:YAG) laser (Powerlite DLS 9000, Continuum) emits laser at 355 nm, with a pulse width of 4 ns. The output energy is adjusted via an attenuator, followed by a beam-expanding telescope system that filters high-frequency modulations and reduces beam diameter. After passing through a lens with a focal length of 2 m, the beam is focused onto the scratch on the rear surface of the sample, producing a spot size of 200 μm (1/e2). A long-working-distance microscope (VHX-950F, Keyence) with large depth of field provides real-time observation of the damage state. An energy meter (LabMax-TOP, Coherent), a fast photodiode (Model 1621, Newport) and a beam profiler (SP620U, Ophir) continuously record the pulse energy, temporal profile and spatial energy distribution, respectively.
Experimental layout of the laser damage test system.

The damage-onset fluence (DOF) of each scratch was evaluated based on the R-on-1 method[ Reference Jean, Pierre, Jean and Philippe 28 ], representing the maximum laser fluence the scratch can sustain. In practice, each scratch is irradiated with several laser pulses, the fluence of each pulse being increased by a small increment until initial damage is observed in situ via the microscope objective. One laser pulse is delivered at every energy step. The initial fluence was set at approximately 1 J/cm2, with increments of 0.5 J/cm2. The laser fluence at which the initial damage is observed is taken as the measured DOF of the scratch. The uncertainty mainly stems from measurement errors in parameters such as the laser pulse energy and beam spot area. The uncertainty of the laser damage test system is ±4.3%.
3 Results and discussion
3.1 Multimodal detection and laser damage test results of scratches
The real scratches on the surface of fused silica components are detected based on the multimodal detection system. In addition, the three-dimensional structural characteristics of the scratches are examined via AFM. Subsequently, the DOF of each scratch is determined through the laser damage testing system. The experimental results show that the real scratches on fused silica components fall into two main categories: trailing indent scratches and plastic continuous scratches. Trailing indent scratches consist of a series of discontinuous pits and cracks, where the material undergoes brittle fracture, while plastic continuous scratches involve only plastic modification, manifesting as a smooth groove[ Reference Suratwala, Steele, Feit, Wong, Miller, Menapace and Davis 4 , Reference Alberto, Francois, Yoshiyama, Christopher and Mark 10 ].
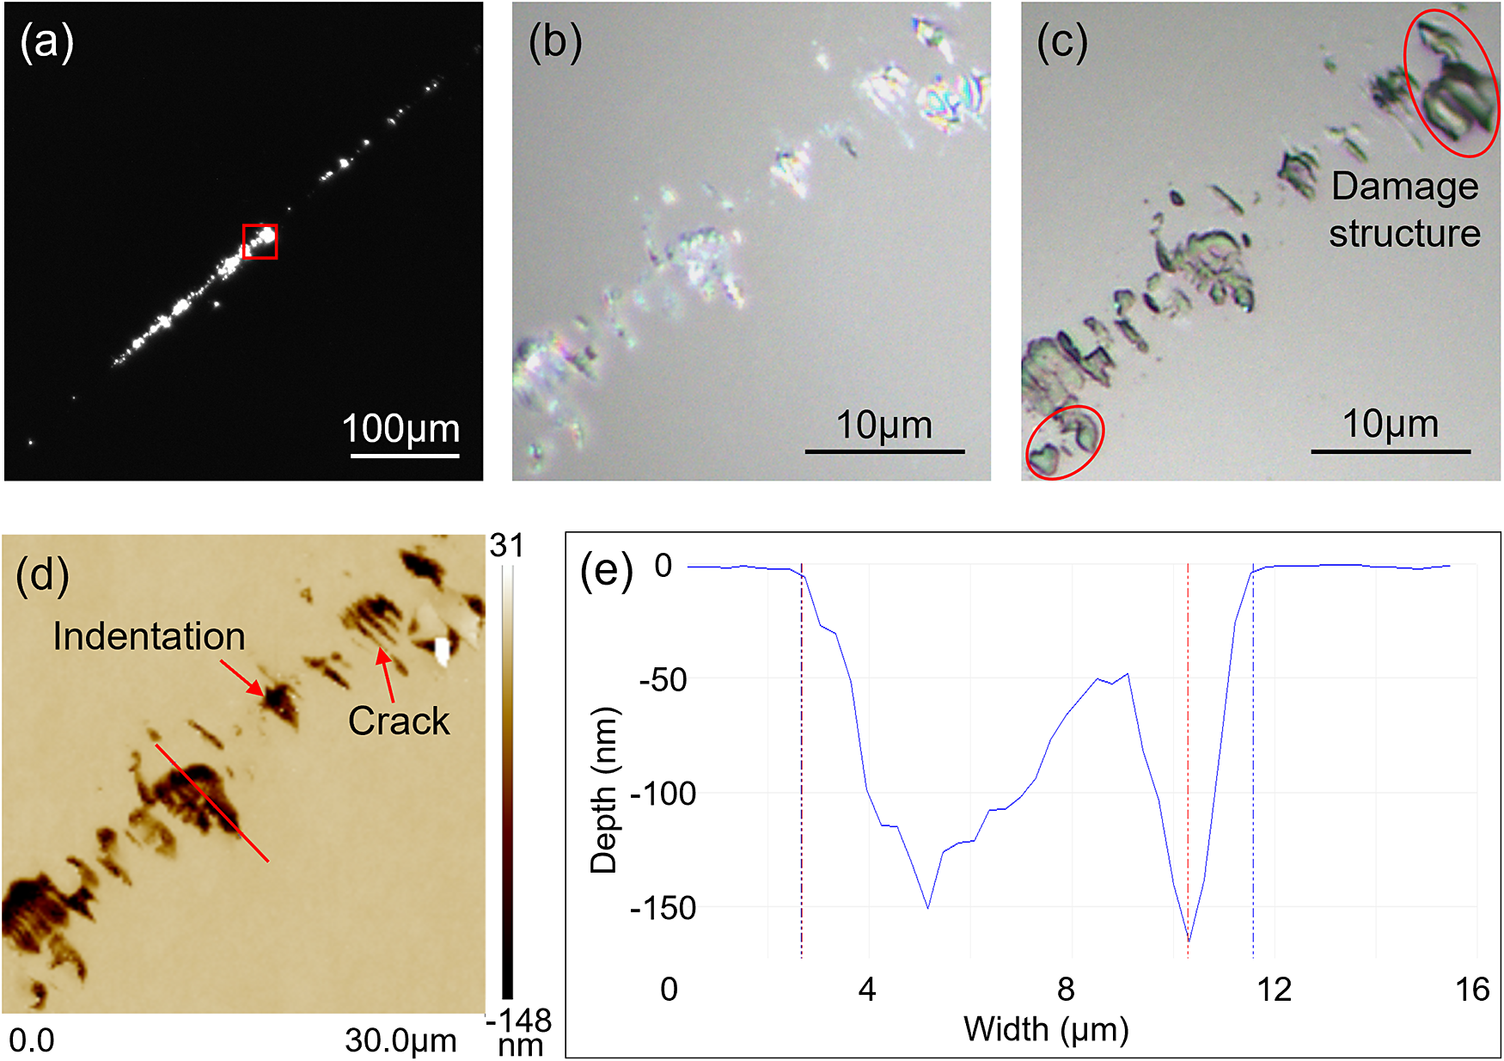
The multimodal characterization of a typical trailing indent scratch is presented in Figure 3, where Figures 3(b)–3(d) correspond to the boxed regions marked in Figure 3(a), and the cross-sectional profile in Figure 3(e) corresponds to the location indicated by the line in Figure 3(d). The high-magnification bright-field microscopy image and AFM test results reveal that the scratch exhibits distinct trailing features. The AFM cross-sectional profile displays a serrated morphology, indicating that the scratch consists of a series of indentations and micro-cracks, which are characteristic of brittle fracture. At the measured cross-section, the scratch has a width of 8.85 μm and a depth of 159 nm. Laser damage testing shows that the scratch has a DOF of 1.27 J/cm2. The scratch appears darker in bright-field microscopy images, accompanied by localized structural expansion after laser irradiation.
Multimodal characterization of a typical trailing indent scratch: (a) dark-field image; (b) bright-field image; (c) bright-field image after laser irradiation; (d) AFM topography; (e) cross-sectional profile.

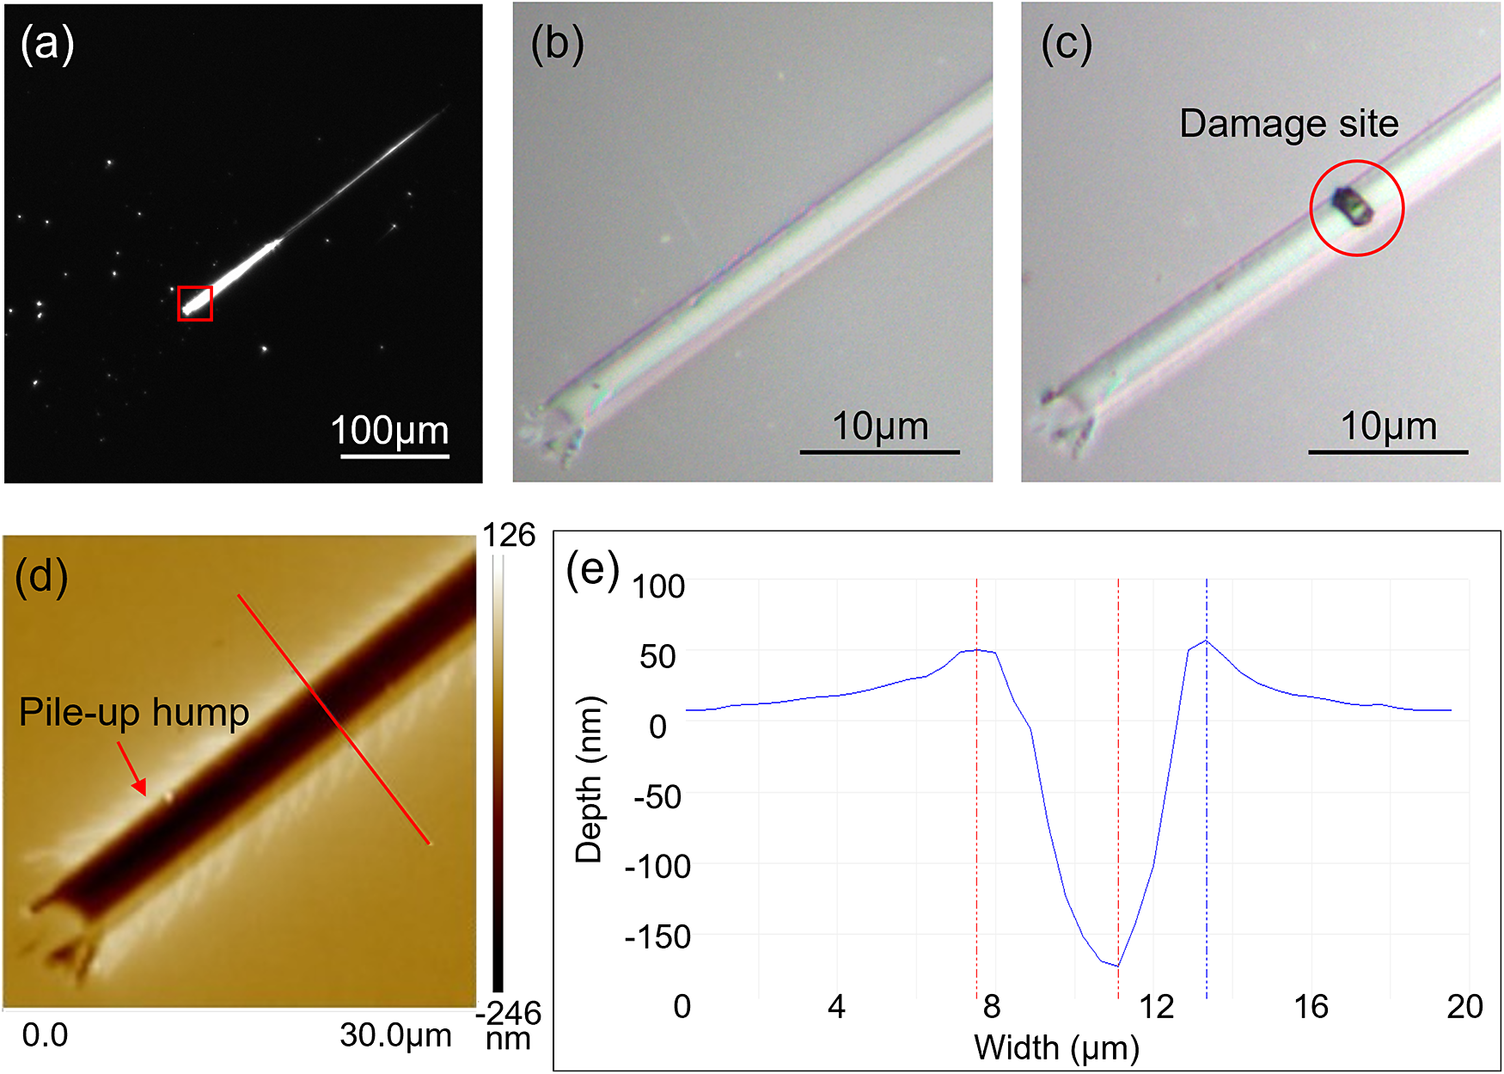
The multimodal characterization of a typical plastic continuous scratch is presented in Figure 4, where Figures 4(b)–4(d) correspond to the boxed regions marked in Figure 4(a), and the cross-sectional profile in Figure 4(e) corresponds to the location indicated by the line in Figure 4(d). The AFM test results indicate that the scratch exhibits an approximately inverted triangular cross-sectional profile. The scratch sidewalls and bottom display continuous smooth structures, which are characteristic of plastic scratches. The scratch appears nearly straight, while material pile-up at the junction between the sidewalls and the component surface produces a raised deformation. AFM measurements reveal that the scratch has a width of 5.85 μm and a depth of 166 nm at the measured cross-section. The laser damage testing reveals that the scratch exhibited a DOF of 12.3 J/cm2. The image after laser irradiation shows a distinct damage site covering both the pile-up zone and the scratch bottom. The plastic continuous scratch possesses a DOF one order of magnitude higher than that of the trailing indent scratch, indicating a significant difference. Consequently, practical engineering applications must distinguish the material fracture characteristics of scratches to accurately assess the damage threshold of optical components.
Multimodal characterization of a typical plastic continuous scratch: (a) dark-field image; (b) bright-field image; (c) bright-field image after laser irradiation; (d) AFM topography; (e) cross-sectional profile.

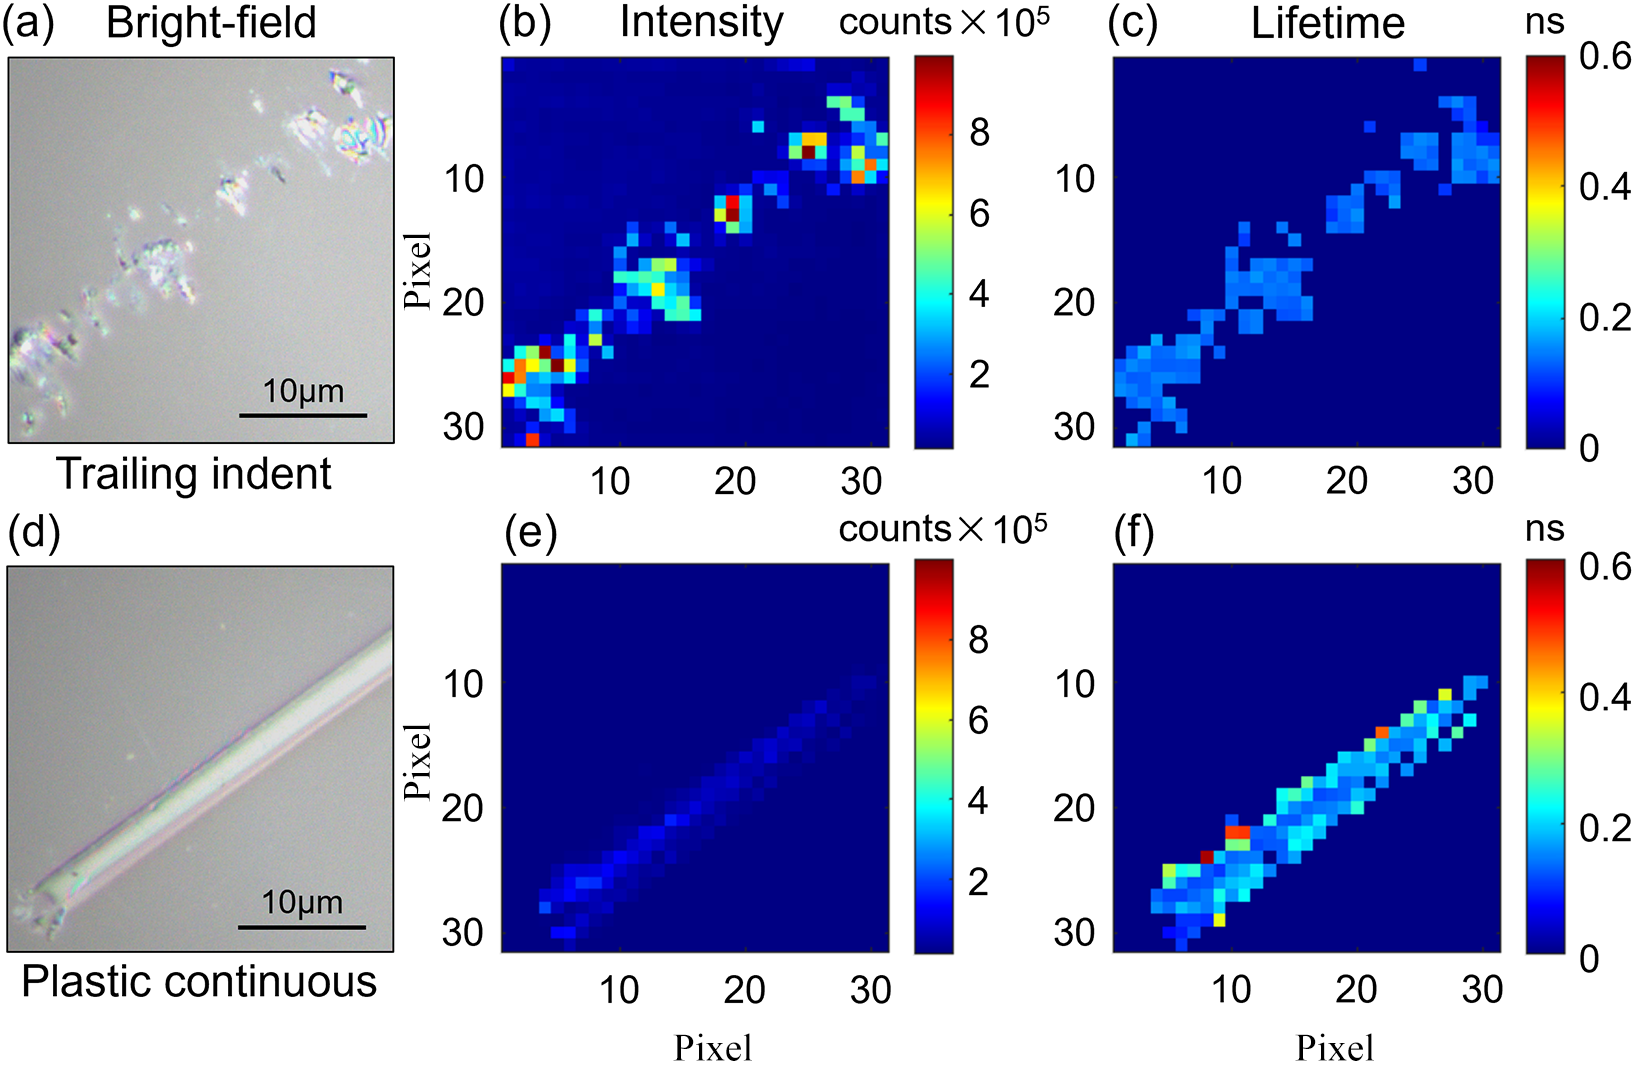
The fluorescence characterization results of the two scratches are shown in Figure 5. Since the fluorescence lifetime of the substrate has no specific significance, the fluorescence lifetime map only displays the lifetime distribution values within the scratched region. For the trailing indent scratch, the average fluorescence intensity is 3.59 × 10⁵ photons and the average fluorescence lifetime is 0.137 ns. For the plastic continuous scratch, the corresponding values are 5.84 × 10⁴ photons and 0.187 ns. The trailing indent scratch shows an average fluorescence intensity one order of magnitude higher than that of the plastic continuous scratch, with a shorter average fluorescence lifetime, indicating a stronger laser absorption capability and a significantly higher density of point defects.
Bright-field images and fluorescence characterization results: (a)–(c) trailing indent scratch; (d)–(f) plastic continuous scratch. (a), (d) Bright-field images. (b), (e) Fluorescence intensity maps. (c), (f) Fluorescence lifetime maps.

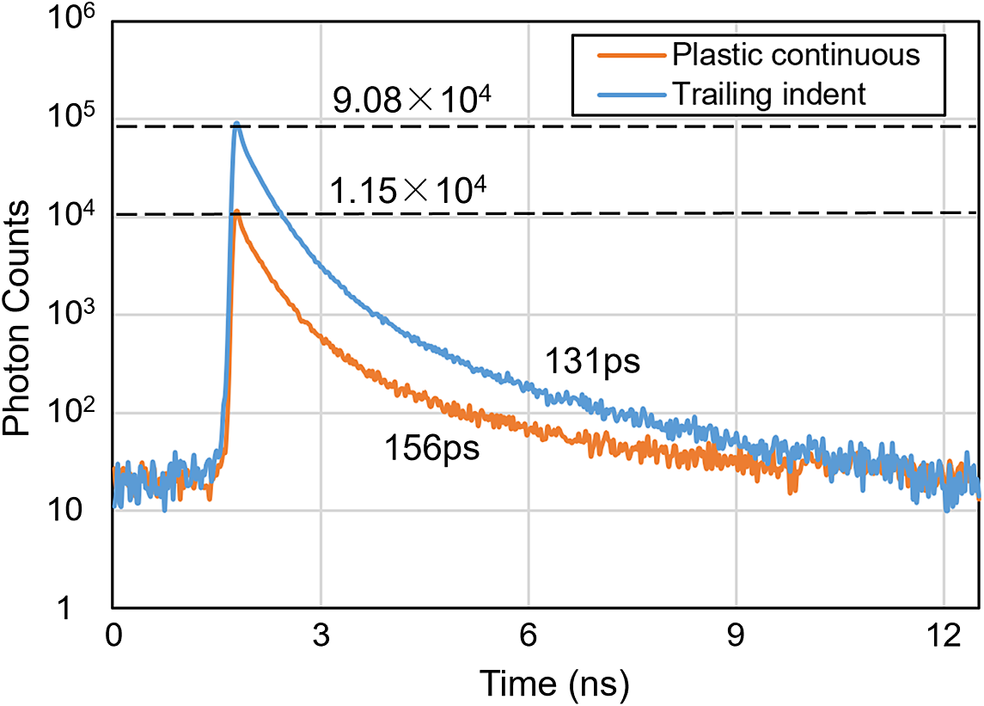
Figure 6 presents the fluorescence decay curves recorded at the points of maximum intensity in the fluorescence images of the two scratches. The data were acquired with a sampling period of 12.5 ns (80 MHz repetition rate). The two decay curves differ markedly: the plastic continuous scratch exhibits a fluorescence peak of 1.15 × 10⁴ photons and a lifetime of 156 ps, whereas the trailing indent scratch reaches 9.08 × 10⁴ photons with a lifetime of 131 ps. Thus, the trailing indent scratch shows both a higher fluorescence peak and a shorter lifetime, indicating a higher defect density[ Reference Wang, Tan, Jie, Dong, Hu, Zhou, Zhang, Zhong, Liang, Zhang, Xie and Xu 29 ].
Comparison of the fluorescence decay curves for the two scratches.

3.2 Correlation analysis between multimodal parameters and DOFs
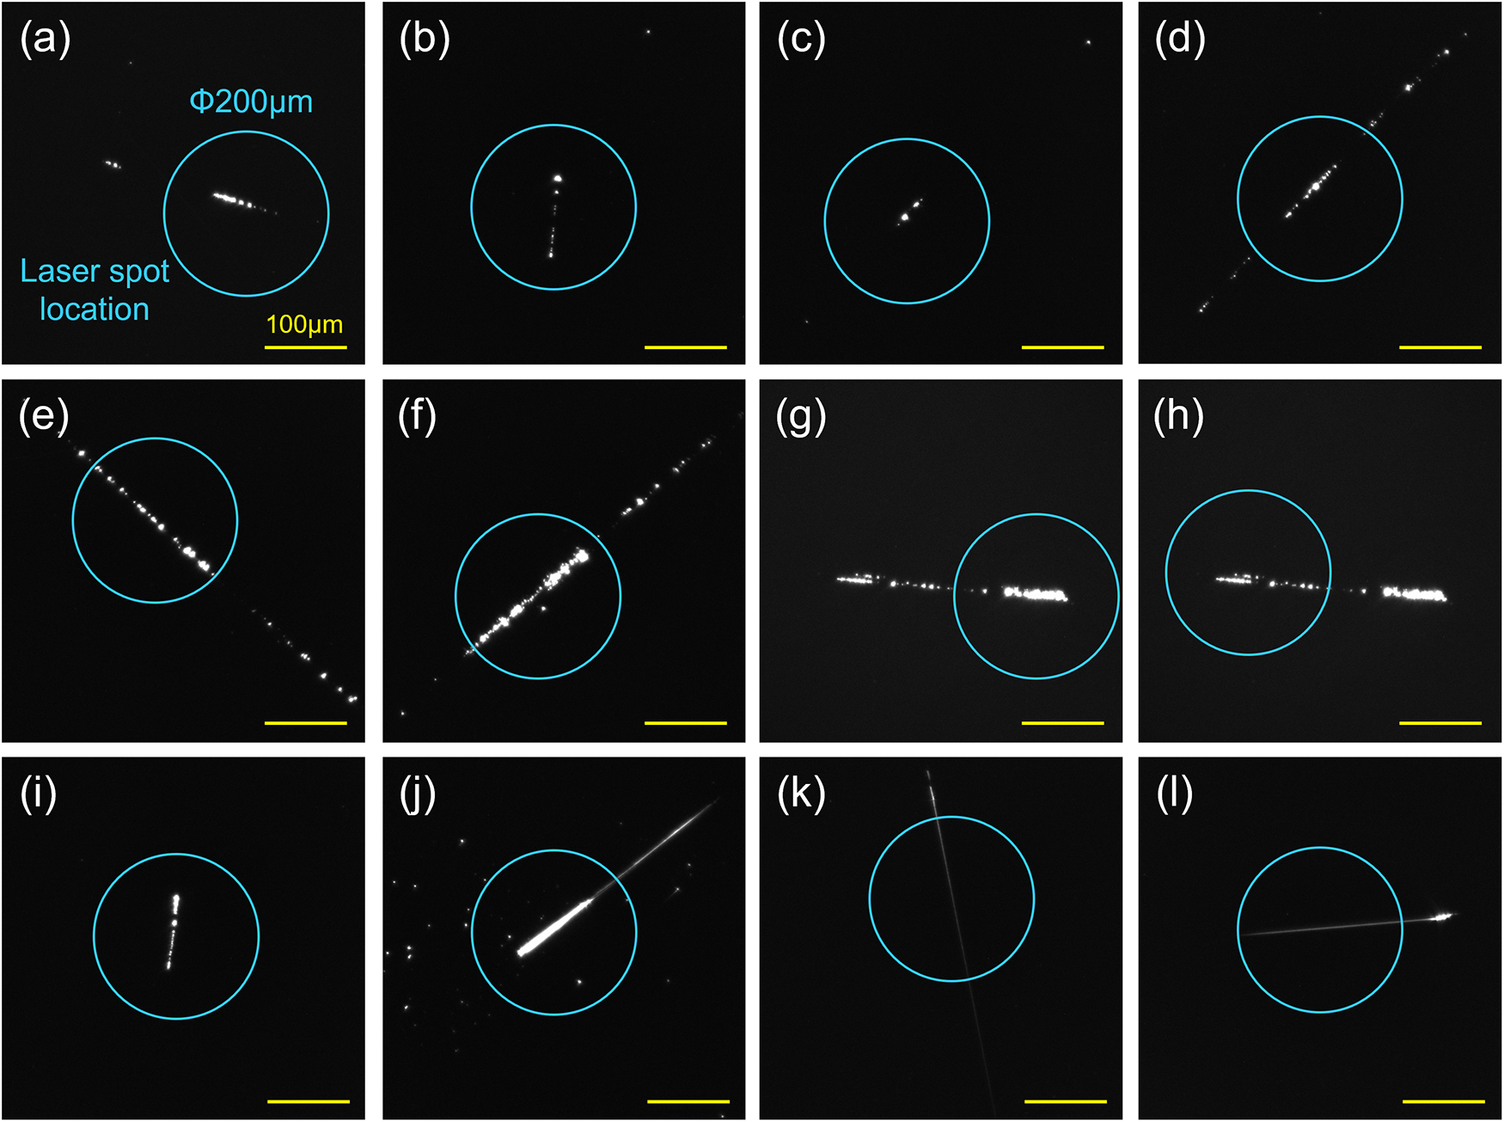
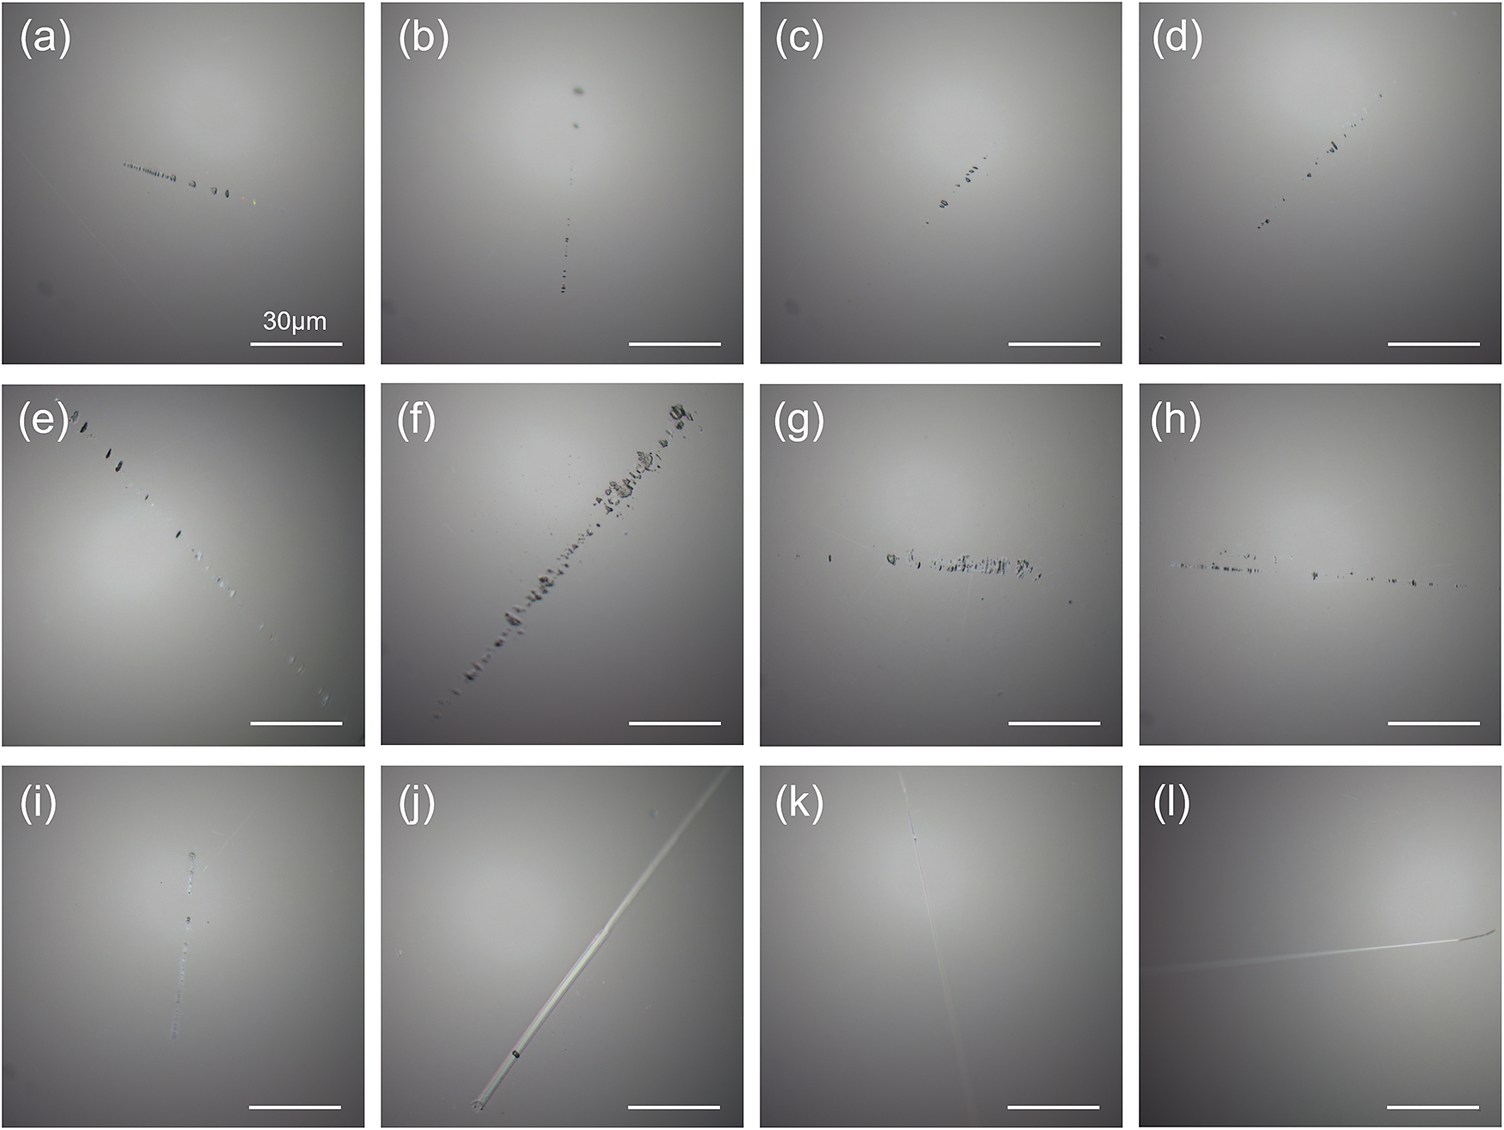
To investigate the correlation between multimodal characterization parameters and damage resistance of real scratches, we performed multimodal detection on a set of real scratches on fused silica components, followed by laser damage testing. The correlations between the measured parameters and the DOFs were then statistically evaluated. A total of 12 scratches were evaluated and classified into two groups based on their dark-field morphological characteristics, as shown in Figure 7. Each panel includes a 100 μm scale bar, with a 200-μm-diameter blue circle marking the laser irradiation spot location for laser damage testing. Based on the dark-field images, the defects can be categorized as follows: nine trailing indent scratches (Figures 7(a)–7(i)) and three plastic continuous scratches (Figures 7(j)–7(l)).
Dark-field images of the 12 real scratches on fused silica optics, where (a)–(l) correspond to scratches #1–#12, respectively. Scale bar: 100 μm. The blue circle (200 μm diameter) indicates the laser irradiation spot.

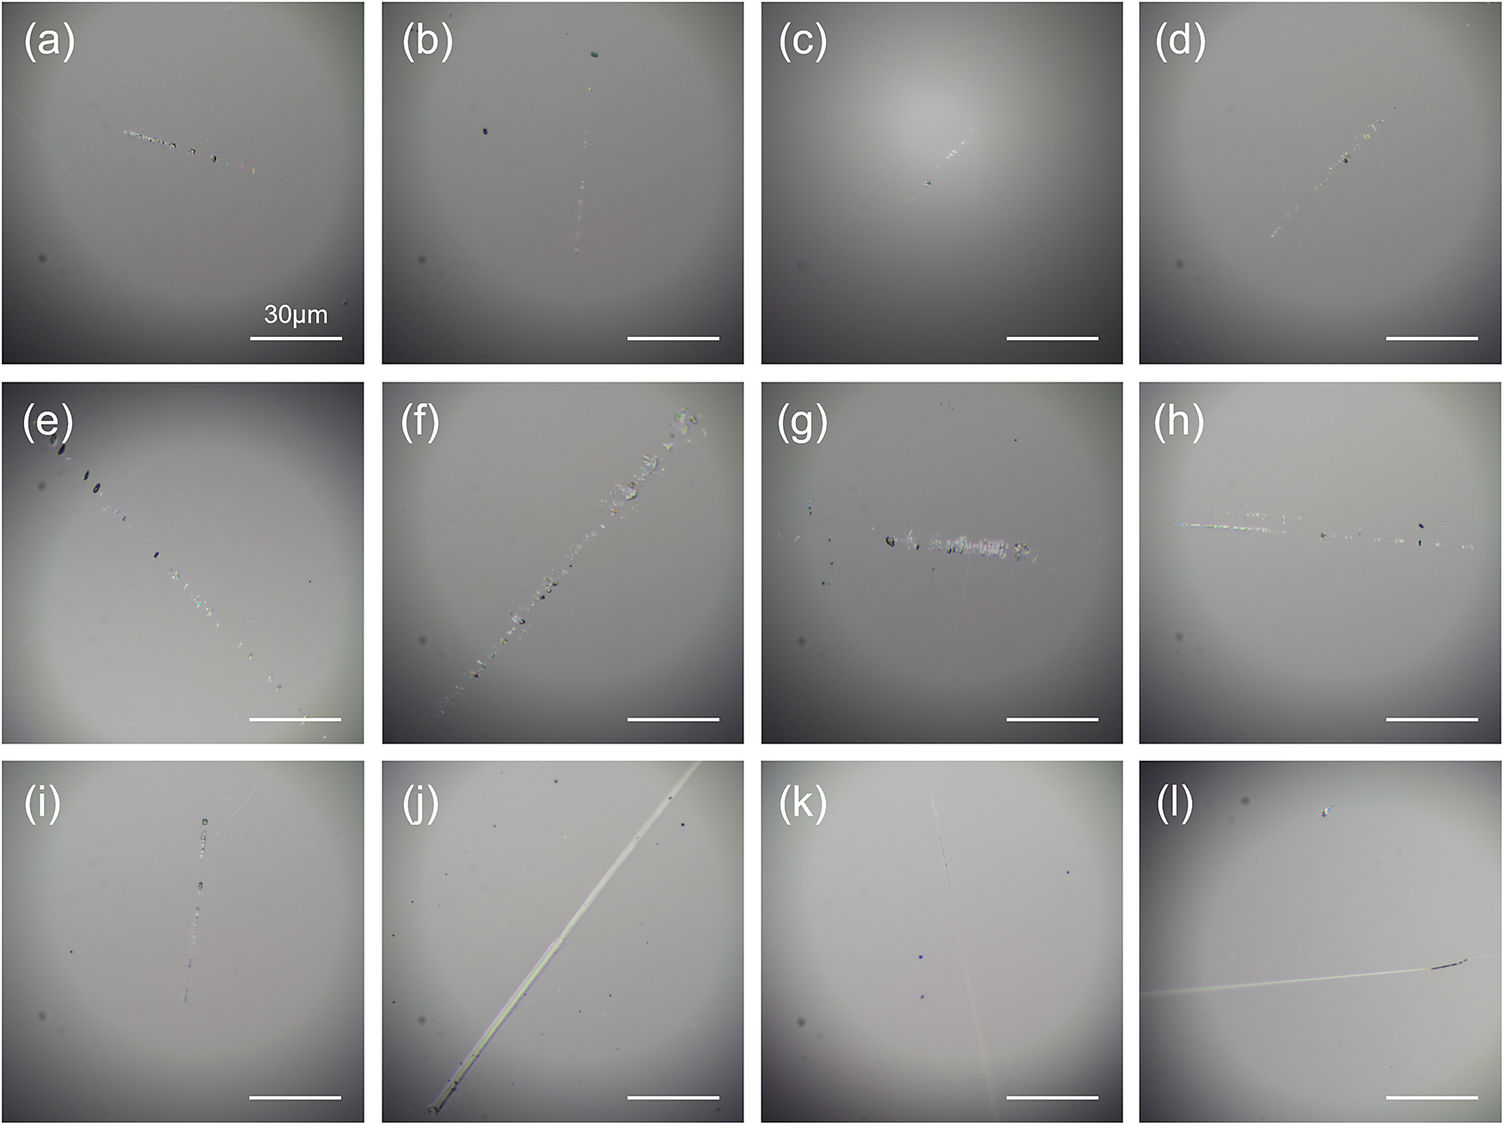
Bright-field images of the 12 scratches before and after the laser damage test are shown in Figures 8 and 9, respectively. For trailing indent scratches, the damage appears as darkening of the scratch and expansion of local structures in the bright-field image. For plastic continuous scratches, only scratch #10 is damaged, indicating a lower laser damage resistance compared to the substrate. For scratches #11 and #12, damage preferentially occurs on the substrate rather than on the scratches, implying that the DOF is close to that of the substrate.
Bright-field images of the 12 real scratches on fused silica optics before laser irradiation, where (a)–(l) correspond to scratches #1–#12, respectively. Scale bar: 30 μm.

Bright-field images of the 12 real scratches on fused silica optics after laser irradiation, where (a)–(l) correspond to scratches #1–#12, respectively. Scale bar: 30 μm.

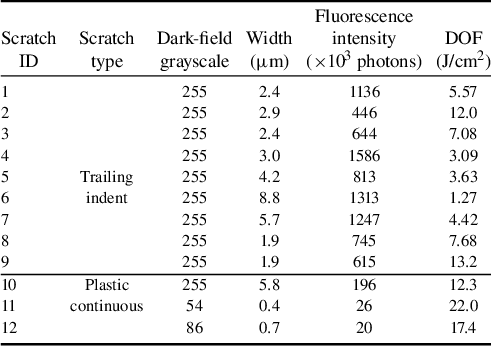
The multimodal detection parameters and DOFs for the 12 scratches are presented in Table 1. The multimodal detection parameters include the grayscale value in the dark-field imaging module, the scratch width obtained from the bright-field imaging module and the fluorescence intensity acquired by the fluorescence lifetime imaging module. For trailing indent scratches, the dark-field image grayscale, width and fluorescence intensity are taken as the maximum values. For plastic continuous scratches, the dark-field image grayscale, width and fluorescence intensity are consistent across different locations, so their average values are reported. Only the scratch parameters within the laser irradiation zone are considered.
Summary of multimodal detection results and DOFs for real scratches.

Table 1 demonstrates that trailing indent scratches exhibit strong scattering under dark-field illumination, with their maximum grayscale values consistently saturated at 255 (8-bit image), widths ranging from 1.9 to 8.8 μm, fluorescence intensities between 4.46 × 10⁵ and 1.59 × 10⁶ photons and DOFs spanning 1.27–13.2 J/cm2. In comparison, plastic continuous scratches show weaker scattering characteristics, displaying grayscale values from 54 to 255, widths of 0.4–5.8 μm and fluorescence intensities ranging from 1.97 × 10⁴ photons (approaching substrate level) to 1.96 × 10⁵ photons, with DOFs between 12.3 and 22.0 J/cm2. For scratches #11 and #12 in Table 1, a direct comparison of their fluorescence intensities and DOF values does appear to deviate from the overall statistical trend. Both scratches exhibit fluorescence intensities that are noticeably lower than those of the other scratches and are close to the baseline level of the substrate, indicating that the densities of the point defects are low. Under these conditions the width of the scratch (and possibly other geometrical parameters) is likely to dominate the local optical-field enhancement produced by the irradiating laser, thereby determining the DOF of the scratches. The sample size of plastic continuous scratches is relatively limited. This is attributed to the tilted configuration of the online monitoring microscope in the laser damage testing system, which compromises imaging quality. Consequently, the system encounters difficulties in repeatedly locating subtle scratches with small widths and depths.
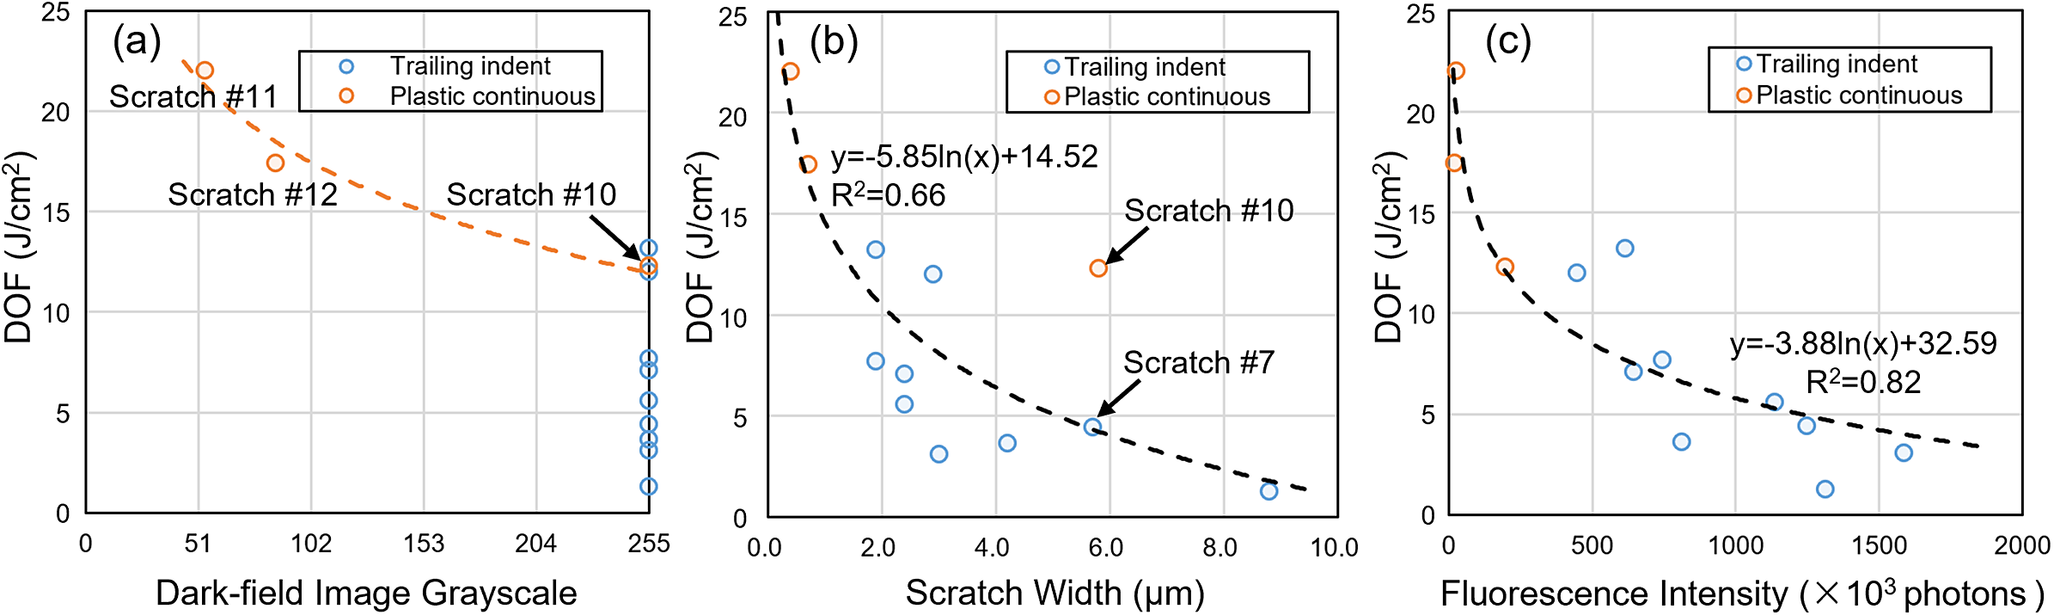
Plots of the DOF of scratches versus multimodal detection parameters are shown in Figure 10. Figure 10(a) shows the plot of DOF of scratches versus dark-field image grayscale value. For plastic continuous scratches, the intensity of dark-field scattered light increases with scratch width, leading to a higher grayscale value and correspondingly lower DOF, as demonstrated by the trend line. However, for trailing indent scratches, their damage resistance cannot be effectively distinguished based on dark-field scattering intensity. In practical engineering applications, to maximize defect detection sensitivity of the dark-field imaging module and reduce missed detection rates for subtle defects, operators typically increase both the irradiance of the illumination source on the target surface and the camera exposure time. However, this approach frequently causes saturation effects when imaging trailing indent scratches with larger widths and depths. Consequently, the dark-field scattering intensities of different trailing indent scratches become indistinguishable through grayscale value differentiation due to pixel overexposure.
Plot of the DOF of scratches versus multimodal detection parameters: (a) plot of the DOF of scratches versus dark-field image grayscale value; (b) plot of the DOF of scratches versus scratch width; (c) plot of the DOF of scratches versus fluorescence intensity.

Figure 10(b) presents the plot of the DOF of scratches versus scratch width. The results indicate that the overall trend is a negative correlation between the DOF and width, with one notable outlier deviating significantly from the trend line. After excluding this outlier, the coefficient of determination (R 2) of the fitted curve increases from 0.66 to 0.83. Further analysis reveals that the outlier corresponds to the plastic continuous scratch #10, which has a width of 5.8 μm and a DOF of 12.3 J/cm2. The trailing indent scratch #7 of comparable width (5.7 μm) exhibits a DOF of only 4.42 J/cm2. Thus, for scratches of identical morphology, the DOF generally decreases with increasing width. However, when comparing trailing indent and plastic continuous scratches of similar width, the former exhibit significantly lower laser damage resistance than the latter due to the brittle fracture morphology. Consequently, scratch width alone is insufficient for accurately assessing damage performance.
Figure 10(c) illustrates the plot of the DOF of scratches versus fluorescence intensity. The data reveal a logarithmic decay trend between the DOF and fluorescence intensity, with an R 2 of 0.82 for the fitted curve. Plastic scratches typically show lower fluorescence intensities and higher DOFs than brittle scratches. Thus, fluorescence intensity can be used to assess the fracture behavior at defect sites, reliably discriminate plastic from brittle defects and serve as a key metric for evaluating damage performance.
Based on the Spearman rank correlation coefficient[ Reference Zar 30 – Reference Al-Hameed 32 ], a quantitative evaluation of the correlation between the DOF and the multimodal detection parameters was performed. As one of the most widely used nonparametric statistical methods, the Spearman rank correlation coefficient reflects the strength and direction of the relationship between two variables, and is calculated as follows:
 $$\begin{align}{r}_{\mathrm{S}}=1-\frac{6\cdot \sum {\left(R\left({x}_i\right)-R\left({y}_i\right)\right)}^2}{n\left({n}^2-1\right)}.\end{align}$$
For variables $X$
and
$X$
and $Y$
,
$Y$
, $\left({x}_i,{y}_i\right)$
denote the observation in the sample and
$\left({x}_i,{y}_i\right)$
denote the observation in the sample and $n$
is the sample size;
$n$
is the sample size; $R\left({x}_i\right)$
and
$R\left({x}_i\right)$
and $R\left({y}_i\right)$
represent the ranks of
$R\left({y}_i\right)$
represent the ranks of ${x}_i$
and
${x}_i$
and ${y}_i$
within their respective sequences. The absolute value of
${y}_i$
within their respective sequences. The absolute value of ${r}_{\mathrm{S}}$
is 1, which indicates a perfect positive or negative monotonic relationship between the two variables. The sign of
${r}_{\mathrm{S}}$
is 1, which indicates a perfect positive or negative monotonic relationship between the two variables. The sign of ${r}_{\mathrm{S}}$
indicates whether the relationship is monotonically increasing (positive) or decreasing (negative). When the absolute value of
${r}_{\mathrm{S}}$
indicates whether the relationship is monotonically increasing (positive) or decreasing (negative). When the absolute value of ${r}_{\mathrm{S}}$
does not exceed 0.5, the correlation is considered weak; when it exceeds 0.7, the correlation is regarded as strong.
${r}_{\mathrm{S}}$
does not exceed 0.5, the correlation is considered weak; when it exceeds 0.7, the correlation is regarded as strong.
The test statistic $t$
was calculated using Equation (2) to perform a significance test on the Spearman rank correlation coefficient[
Reference Zar
33
], where
$t$
was calculated using Equation (2) to perform a significance test on the Spearman rank correlation coefficient[
Reference Zar
33
], where $n-2$
is the degrees of freedom. The purpose of the significance test is to determine whether the observed correlation is unlikely to be due to random factors, thereby assessing its statistical significance:
$n-2$
is the degrees of freedom. The purpose of the significance test is to determine whether the observed correlation is unlikely to be due to random factors, thereby assessing its statistical significance:
 $$\begin{align}t=\frac{r_{\mathrm{S}}\sqrt{n-2}}{\sqrt{1-{r}_{\mathrm{S}}^2}}.\end{align}$$
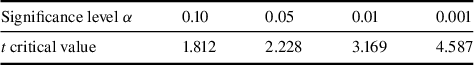
In the significance test, a two-tailed test only examines whether a correlation exists, without regard to its direction. Therefore, by referring to the standard $t$
-distribution table for a two-tailed test with 10 degrees of freedom, the critical values corresponding to different significance levels
$t$
-distribution table for a two-tailed test with 10 degrees of freedom, the critical values corresponding to different significance levels $\alpha$
were obtained[
Reference Brereton
34
], as shown in Table 2. By comparing the calculated test statistic
$\alpha$
were obtained[
Reference Brereton
34
], as shown in Table 2. By comparing the calculated test statistic $t$
with these tabulated critical values, the
$t$
with these tabulated critical values, the $p$
-value interval for each of the three detection parameters was determined. The
$p$
-value interval for each of the three detection parameters was determined. The $p$
-value quantifies the extent to which the sample data support the null hypothesis.
$p$
-value quantifies the extent to which the sample data support the null hypothesis.
Critical values of the $t$
-distribution (two-tailed, 10 degrees of freedom).
$t$
-distribution (two-tailed, 10 degrees of freedom).

The correlation coefficients ${r}_{\mathrm{S}}$
, test statistics
${r}_{\mathrm{S}}$
, test statistics $t$
and
$t$
and $p$
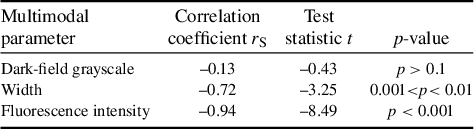
-values between the multimodal parameters and the DOF are presented in Table 3. All three parameters showed negative correlation coefficients, indicating an inverse relationship with the DOF. The closer
$p$
-values between the multimodal parameters and the DOF are presented in Table 3. All three parameters showed negative correlation coefficients, indicating an inverse relationship with the DOF. The closer $\left|{r}_{\mathrm{S}}\right|$
is to 1, the stronger the correlation. The dark-field image grayscale yields
$\left|{r}_{\mathrm{S}}\right|$
is to 1, the stronger the correlation. The dark-field image grayscale yields $\left|{r}_{\mathrm{S}}\right|$
= 0.13 (<0.5), indicating a weak correlation, whereas scratch width and fluorescence intensity give
$\left|{r}_{\mathrm{S}}\right|$
= 0.13 (<0.5), indicating a weak correlation, whereas scratch width and fluorescence intensity give $\left|{r}_{\mathrm{S}}\right|$
= 0.72 and 0.94 (>0.7), respectively, denoting strong correlations. The
$\left|{r}_{\mathrm{S}}\right|$
= 0.72 and 0.94 (>0.7), respectively, denoting strong correlations. The $p$
-values show that fluorescence intensity is significantly negatively correlated with the DOF at the
$p$
-values show that fluorescence intensity is significantly negatively correlated with the DOF at the $\alpha$
= 0.001 significance level (
$\alpha$
= 0.001 significance level ( $p$
< 0.001). Both scratch width and fluorescence intensity are significantly negatively correlated at the
$p$
< 0.001). Both scratch width and fluorescence intensity are significantly negatively correlated at the $\alpha$
= 0.01 significance level (
$\alpha$
= 0.01 significance level ( $p$
< 0.01).
$p$
< 0.01).
Statistical analysis of multimodal parameters versus the DOF.

3.3 Discussion
Scratches on the fused silica surface host a high density of point defects, such as non-bridging oxygen hole centers (NBOHCs) and oxygen-deficient centers (ODCs). These point defects introduce sub-bandgap states within the band gap, allowing valence-band electrons to absorb photon energy and transition to the conduction band. Under 355 nm nanosecond pulsed laser irradiation, the absorbed energy is effectively converted into lattice thermal vibrations, leading to an extremely high localized temperature rise and thus causing damage.
For the nanosecond pulse laser-induced breakdown process in fused silica materials, avalanche ionization is one of the dominant mechanisms[
Reference Vainos
35
]. During laser irradiation, the evolution in conduction band electron density $n(t)$
can be expressed as follows[
Reference Stuart, Feit, Rubenchik, Shore and Perry
36
, Reference Ristau
37
]:
$n(t)$
can be expressed as follows[
Reference Stuart, Feit, Rubenchik, Shore and Perry
36
, Reference Ristau
37
]:
 $$\begin{align}\frac{\mathrm{d}n(t)}{\mathrm{d}t}=\alpha E(t)n(t),\end{align}$$
where $\alpha$
is the impact ionization coefficient and
$\alpha$
is the impact ionization coefficient and $E(t)$
is the laser intensity. Thus, the critical conduction band electron density
$E(t)$
is the laser intensity. Thus, the critical conduction band electron density ${n}_{\mathrm{crit}}$
at breakdown can be expressed as follows:
${n}_{\mathrm{crit}}$
at breakdown can be expressed as follows:
 $$\begin{align}{n}_{\mathrm{crit}}={n}_0\cdot \exp \left(\alpha {\int}_0^{\tau }E(t)\mathrm{d}t\right)={n}_0\cdot \exp \left(\alpha \cdot {F}_{\mathrm{th}}\right),\end{align}$$
where ${n}_0$
is the initial conduction band electron density and
${n}_0$
is the initial conduction band electron density and ${F}_{\mathrm{th}}$
is the DOF. Thus, the expression for the DOF as a function of the
${F}_{\mathrm{th}}$
is the DOF. Thus, the expression for the DOF as a function of the ${n}_0$
can be written as follows:
${n}_0$
can be written as follows:
 $$\begin{align}{F}_{\mathrm{th}}={C}_1\ln \left({n}_0\right)+{C}_2.\end{align}$$
Here, ${C}_1=-1/\alpha$
,
${C}_1=-1/\alpha$
, ${C}_2=\ln \left({n}_{\mathrm{crit}}\right)/\alpha$
. Surface defects introduce lower electronic energy levels into the band structure of fused silica, providing initial conduction band electrons for the avalanche ionization process. The fluorescence intensity of surface defects reflects the microscopic defect density and is proportional to the initial conduction band electron density[
Reference Yang, Cheng, Zhao, Chen, Liu, Wang, Han, Liu, Wang, Geng, Sun and Xu
38
]. Consequently, the DOF decreases logarithmically with increasing fluorescence intensity of surface defects, which is consistent with experimental observations.
${C}_2=\ln \left({n}_{\mathrm{crit}}\right)/\alpha$
. Surface defects introduce lower electronic energy levels into the band structure of fused silica, providing initial conduction band electrons for the avalanche ionization process. The fluorescence intensity of surface defects reflects the microscopic defect density and is proportional to the initial conduction band electron density[
Reference Yang, Cheng, Zhao, Chen, Liu, Wang, Han, Liu, Wang, Geng, Sun and Xu
38
]. Consequently, the DOF decreases logarithmically with increasing fluorescence intensity of surface defects, which is consistent with experimental observations.
4 Conclusion
In this study, real scratches on fused silica components were characterized by a multimodal detection system and subjected to laser damage testing. We further analyzed the correlations among scratch characteristics (dark-field scattering intensity, width, fluorescence intensity) and the DOF. Experimental results reveal that for mechanically polished fused silica components, the surface defects mainly consist of two types: trailing indent scratches and plastic continuous scratches. Trailing indent scratches exhibit typical brittle fracture characteristics, demonstrating strong dark-field scattering with widths ranging from 1.9 to 8.8 μm and DOFs between 1.27 and 13.2 J/cm2. In contrast, plastic continuous scratches show smoother cross-sectional profiles with weaker scattering, measuring 0.4–5.8 μm in width and achieving higher DOFs of 12.3–22.0 J/cm2. Fluorescence intensity effectively characterizes material fracture properties at defect sites, enabling discrimination between plastic and brittle defects. Statistical analysis shows that fluorescence intensity is significantly negatively correlated with the DOF at the α = 0.001 level (p < 0.001), while both scratch width and fluorescence intensity are significantly negatively correlated with the DOF at the α = 0.01 level (p < 0.01). These findings demonstrate that fluorescence intensity reflects the laser absorption capacity and serves as a reliable indicator for evaluating the damage performance of defects. This work provides critical insights for surface quality assessment and machining process optimization of optical components.
Acknowledgements
This work was supported by the National Key Research and Development Program of China (Grant Nos. 2022YFB3403404 and 2022YFC2203904) and the Natural Science Foundation of Zhejiang Province (Grant No. LQ24F050007).


 Open access