





Policy Significance Statement
One of the biggest challenges that governments face when trying to achieve the Sustainable Development Goals (SDGs)—or any development agenda—is prioritizing resources across hundreds of interdependent policy issues while, at the same time, dealing with the political economy of policymaking. A complexity view is necessary to cope with such problem and to assess the feasibility of development goals, inefficiencies in the use of public funding, policy coherence, identifying accelerators, and other critical matters. This paper introduces a framework and a computational tool—developed in close collaboration with policymakers—that combines insights from Complexity Economics, Computational Social Science, Behavioral Sciences, and Policy Sciences. With this framework, governments, multilateral organizations, NGOs, development consultants, and other stakeholders can address the challenges of the SDGs with better designed budgetary strategies.
1 Introduction
In its 2030 Agenda Declaration (UN General Assembly, 2015, p. 2), the United Nations acknowledges the importance of understanding development as a process with numerous dimensions interacting with each other: “The interlinkages and integrated nature of the SDGs are of crucial importance in ensuring that the purpose of the new Agenda is realized.” While the multidimensionality of development has been extensively discussed in the literature (McGillivray and Shorrocks, Reference McGillivray and Shorrocks2005; Chambers, Reference Chambers2007; Alkire and Foster, Reference Alkire and Foster2011), the complexity of development expressed through interlinkages is certainly a novel aspect. This perspective opens the door to new ways of thinking about development and, consequently, calls for suitable methodologies emanating from Complexity Science and Computational Social Science.Footnote 1 Given that complexity principles live at the core of the Sustainable Development Goals (SDGs), the design of public policies for the 21st century needs to be open to alternative visions if governments truly want to achieve their ambitious objectives.
This paper introduces a new research program to study the allocation of budgetary resources through the lens of complexity theory and computational tools: “Policy Priority Inference” (PPI).Footnote 2 The proposed framework defines a series of causal mechanisms that establish a theoretical link between an allocation profile (distributing public funds) and the evolution of SDG indicators. Thus, it helps to guide policymakers in setting a budget or development plan to pursue specific goals for these indicators. As we show throughout the paper, PPI allows tackling different macro-level questions that are central to the current discussions of the 2030 Agenda; for example, assessing the temporal feasibility of goals and identifying development accelerators that ought to be fostered with public funding.
So far, the practice for establishing policy priorities in terms of budgetary allocations can be backed by three main analytical approaches: benchmark studies, interdependency networks, and system dynamics models. In benchmark studies (e.g., Huggins, Reference Huggins2010), policymakers and consultants compare a large set of indicators across countries (or regions) to set standards—sometimes established by combining countries with structural affinities. For each of these indicators, analysts define the gap between the maximum level observed in the database and that of a particular country. In this fashion, priorities are usually defined depending on how lagged an indicator is with respect to its goal. The shortcomings of this method are plenty: (a) indicators are analyzed in isolation since their interdependencies are ruled out, (b) it does not present a theoretical framework to specify a causal link between budgetary allocations and outcomes, (c) a political economy account is missing, and (d) it does not provide a framework to produce ex-ante evaluations of specific allocations.
In studies of interdependency networks, indicators are conceived as nodes and their links’ weights as measures of their direct impact. For instance, in Bayesian networks (e.g., Cinicioglu et al. (Reference Cinicioglu, Ulusoy, Ekici, Ülengin and Ülengin2017)), these impacts are defined using conditional probabilities that are helpful to infer how improvements in specific indicators are associated with changes in the performance of other indicators (directly and indirectly). There are several drawbacks in this framework: (a) it requires pooling large sets of countries and hence context specificity is lost, (b) the results must be interpreted as structural interdependencies and, thus, it is not possible to estimate a causal relationships between indicators, (c) political economy issues are left aside since the analysis is only based on detecting patterns in the data without a theory that incorporates incentives and social influences, and (d) there is no explicit mechanism that explains how priorities can be described in terms of budgetary allocations.
In system dynamics models, the web of interdependencies among indicators is combined with input-output data and a social accounting matrix (e.g., Pedercini and Barney, Reference Pedercini and Barney2010). Therefore, these models can simulate how alternative budgetary allocations may affect the evolution of socioeconomic and environmental indicators. Unfortunately, in spite of introducing conduits to explain how these resources are converted into indicator improvements, these models have received a lot of criticisms due to their weak internal and external validity. Likewise, an important channel is left aside by excluding political economy considerations related to the discrepancies between the policy design and its implementation through government programs.
PPI tries to overcome the limitations previously described. First, it takes into account the complex structure of linkages among development indicators, as opposed to the disconnected silos assumed in benchmark analyses. Second, it establishes a policymaking process, which allows to specify a theoretical link between budgetary allocations and the indicators’ evolution, in contrast to network analyses that only attempt to measure statistical dependencies among indicators. Third, it defines several micro-macro causality chains (through an agent-computing model) that help to understand how budgetary resources can be detoured as a consequence of mismanagement or corrupt practices, a critical aspect of budgetary discussions that are not considered in systems dynamics analyzes. Fourth, it helps to operationalize context specificity, not only in terms of initial conditions and goals to be achieved, but also in terms of structural dependencies by using methods for estimating SDG networks that employ information for just one or relatively few countries.
The rest of the paper is structured in the following way. In Section 2, we discuss why a complexity approach is necessary to meet the 2030 Agenda. Then, in Section 3, we provide a detailed explanation of the model underpinning the proposed framework. In Section 4, we present the data assembled for the project. For the empirical analysis, we implement two types of simulation exercises: a retrospective one, and a prospective one. In Section 5, we use the historical data to produce the calibration needed for the rest of the paper, and show how to compute allocation profiles. Then, in Section 6, we present the outcomes of different applications of the prospective simulations. Finally, in Section 7, we clarify some limitations and discuss future directions in this research program.
2 On the Complexity of Development
Often, complexity is equated to the interconnectivity of networks; certainly a feature of complex systems but not its sole defining characteristic (many complicated systems also exhibit nontrivial interconnectivity). While networks of interlinkages reveal some of the complexity behind the development process, the veil remains at large because socioeconomic systems exhibit other types of intricacies; some of them already part of academic discussions and public discourse. Here, we mention a few that we find relevant according to the writings of scholars and our interactions with numerous policymakers. First, there is the problem of inefficiencies dampening the effectiveness of the resources spent in transformative policies. A typical symptom of such wastage is corruption; a problem that is part of public discourse and international agendas (Izquierdo et al., Reference Izquierdo, Pessino and Vuletin2018; Baum et al., Reference Baum, Hackney, Medas and Sy2019).
Second, and related to inefficiencies, we have to analyze the institutional dimension of development (World Bank, 2017; IMF, 2019). Given that the monitoring efforts and the strength of the rule of law shape the incentives of those who can profit from wasting resources, institutions that facilitate public governance are key to the outcome of development policies. Third, while these variables have traditionally been studied by economists from the principal-agent point of view (Rose-Ackerman, Reference Rose-Ackerman1975; Klitgaard, Reference Klitgaard1988), today we know that the lack of a committed principal (a common feature in developing countries) leads to collective-action problems (Persson et al., Reference Persson, Rothstein and Teorell2013), rendering traditional individual-incentive-driven interventions ineffective or ambiguous (Kwon, Reference Kwon2014). The complexity arising from collective-action dynamics—such as social norms—explains why recent reforms to the rule of law by various developing countries have failed in curbing corruption (World Bank, 2017; Guerrero and Castañeda, Reference Guerrero and Castañeda2019).
Fourth, in the real world, one only observes budgetary data (if any), but the process through which governments arrive to these priorities remains opaque since it is the result of numerous micro-level interactions. As Jones et al. (Reference Jones, Baumgartner, Breunig, Wlezien, Soroka, Foucault, François, Green-Pedersen, Koski, John, Mortensen, Varone and Walgrave2009, p. 857) put it “Budgets set public priorities; they are the outcome of complex policy processes involving the nature of the decision-making institutions, the preferences of decision-makers (organized by political parties), and informational signals from a changing environment. In many real-world information-processing situations, we do not have the luxury of observing the actual informational input, because we observe only whether the decision-maker attends to that information and what action they subsequently takes.”
Fifth, in the macroscale of international agendas, causation between policy interventions and development outcomes is almost impossible to infer from available data sources such as development indicators.Footnote 3 This is so because policy interventions take place at a micro-level, while development indicators are typically macro-level variables. Thus, in the absence of highly granular multilevel data, vertical causal mechanisms cannot be properly addressed by traditional statistical tools (Casini and Manzo, Reference Casini and Manzo2016; Ospina-Forero et al., Reference Ospina-Forero, Castañeda and Guerrero2020). Instead, a production account of causation is more adequate and, once again, Complexity Science has developed the relevant tools.
Sixth, since data on the amount of public money spent in fostering specific development indicators is practically nonexistent in many countries, a commonly used second-best approach consists in assuming that some development indicators are exogenous variables. Analysts presuppose that the chosen “independent” variables can be directly intervened or manipulated. Consequently, they justify interventions in those policy issues if the associated regression coefficients are statistically significant. In reality, development indicators are the result of government actions that are partly motivated by the performance of the indicators themselves. Thus, the apparent “exogenous” change in a covariate might originate from policy outcomes associated with the dependent variable. Thus, it is necessary to develop data-generating models where political economy considerations—such as the reallocation of resources—are explicit. Computational Social Science provides us with tools to build such models.
The previous argument points to a political-economy aspect of development located at the very core of our macro strategy for policy prioritization. Understanding how governments establish the allocation of resources across numerous policy issues is a relevant—but rarely accounted for—challenge that requires a complexity perspective. This paper introduces a computational tool that facilitates the analysis of budgetary priorities and associated matters under this vision. The proposed framework models how governments allocate resources across different topics, while intending to achieve a set of goals in an environment characterized by the complexity features previously discussed. The method generates (bottom-up) development-indicator dynamics from these allocations. Thus, by matching the features of these synthetic indicators to those of empirical ones, this approach allows inferring the policy priorities that, arguably, were partly responsible for the observed macro-level dynamics. Thus, we call it Policy Priority Inference (PPI).
PPI builds on a model previously developed by Castañeda et al. (Reference Castañeda, Chávez-Juárez and Guerrero2018) (referred to as “the CCG model” from here onward), consisting of a central authority allocating resources across a multidimensional and interlinked policy space. The CCG model has been previously applied to the study of policy resilience (Castañeda and Guerrero, Reference Castañeda and Guerrero2018), ex-ante policy evaluation (Castañeda and Guerrero, Reference Castañeda and Guerrero2019), policy coherence (Guerrero and Castañeda, Reference Guerrero and Castañeda2020), and corruption (Guerrero and Castañeda, Reference Guerrero and Castañeda2019). However, its ability to provide detailed policy advice is limited by not being able to account for negative interlinkages between indicators (so environmental issues cannot be considered) and by the need to build international datasets for calibration purposes. Despite these limitations, the CCG model represents an early attempt to study policy prioritization from a complexity perspective. In this paper, we overcome all those limitations.
The application of PPI presented in this paper is an early proof of concept, not an evaluation of previous administrations of the Mexican government. Throughout the paper, we elaborate on novel ways in which PPI can be used to address salient concepts of the 2030 Agenda such as policy coherence for sustainable development, accelerators, and SDG budgeting. By demonstrating the benefits of PPI in tackling these problems, we hope to make a case for why PPI should become part of any government’s planning toolkit.
Finally, to help setting realistic expectations about the paper, enlisting some caveats is in order. As in any other model, assumptions must be made to highlight certain causal mechanisms that could be considered critical for defining connections between policy interventions and their impact on observed endogenous variables. Therefore, our aim is not to model the entire ecosystem of actors and processes that take part in the coevolution of all the SDG indicators. Instead, the proposed framework only models—explicitly—the behavior of public servants/institutions; a subset of the actors associated to the SDGs. Nevertheless, we do not discard the fact that entities such as firms, consumers, the civil society, NGOs, and multilateral organizations, to mention a few, also play an important role. This is why PPI takes a “residual” approach by introducing free parameters that account for unexplained contributions to the indicators’ dynamics. The question of how explicit should the model be regarding the specification of the relevant agents is a matter of relevance to the research questions, of data availability, and of calibration/overfitting issues. Our choice for this particular study is justified by both the academic literature and our interactions with policymakers. After all, scientists need to produce tractable models for helping governments to establish policies based on educated conjectures (i.e., based on data and analytical frameworks) even if scant information is available (such as coarse-grained development indicators).
3 Model
PPI should be thought of as a research program rather than as a specific model. Therefore, it is natural to think that more realistic and context-relevant models could be constructed in the future, once additional information at different levels of granularity becomes available. The distinctive feature of the said program is that, in order to understand policy prioritization, a production account of causation is necessary (Casini and Manzo, Reference Casini and Manzo2016). In other words, it is not enough to study dependencies between aggregate variables; it is also important to model the micro-level processes that give rise to aggregate dynamics. This is so because, ultimately, policy priorities lead to micro-level policy interventions that affect agents’ choices in the policymaking process. These interventions, in turn, generate aggregate outcomes in nonlinear and nontrivial ways.Footnote 4 Therefore, the PPI research program advocates for the use of computational models that are suitable when the analysis stems from a vision of complexity. Here, we adopt one such tool: agent-computing, also known as agent-based modeling, multi-agent-systems, individual-based, and multi-agent simulations.
3.1 Overview
Before elaborating on the model’s details, we provide a summary diagram through Figure 1. The left panel presents some policy interventions that are considered exogenous variables in PPI; for example, reforms to the judicial system to strengthen the rule of law (by modifying the relevant parameter), aligning the countries’ development goals to the SDGs, or promoting synergistic relations between sectors (re-wiring interlinkages). Note that all the interventions take place at the micro-level and, in particular, involve agents in the government arena. Of course, in the long run, and in real life, every aspect of development could be considered endogenous. Here, we have made an exogeneity assumption based on the typical duration of administrative terms (for democratic and semi-democratic governments). In our view, for example, concepts like development goals are more exogenous than indicators. This is so because goals represent the government’s aspirations, and these, in turn, come from much broader processes such as societal consensus, the interests of a small elite, or from the influence of multilateral organizations and international agendas. Endogenizing the formation of aspirations implies modeling cultural and societal changes that involve working on a long-term horizon. Having said that, we should point out that, in contrast to most existing analytic tools that support the 2030 Agenda, PPI focuses on short and midterm analyses. That is, PPI is not designed to forecast indicator levels in 30 or 50 years, but to aid in assessing the feasibility of reaching development goals within a few government terms. Thus, PPI is most useful to national and subnational governments designing development plans; treasuries planning budgets; political parties crafting campaigns; consultants and grading agencies assessing a government’s commitment to development; NGO’s evaluating development strategies; and multilateral organizations coordinating international agendas, to mention a few.
Structure of the PPI model.

The panel at the center of Figure 1 shows that the model makes explicit the linkages between the micro and the macro. At the micro-level, the central authority formulates a strategy and allocates budgetary resources, while the public servants receiving such funds implement the relevant policies (although with objectives that may not coincide with those of the central authority). At the macro level, the network of interdependencies produces spillover effects that contribute, up to a certain extent, to the evolution of the development indicators. In the upward causation component (right vertical arrow), functionaries make effective use of some of the resources they receive from the central government. In the downward causation (left vertical arrow), the overall dynamic produces a continuous reduction in each of the development gaps (i.e., the difference between the goals and the indicators’ current levels). This channel also transmits signals that reflect certain misuse of resources which, in turn, causes the government to penalize inefficient functionaries and reallocate resources. Furthermore, the three circling arrows in the middle of the bottom panel represent a horizontal causation mechanism responsible for social norms of inefficiency that guide the functionaries’ behavior. Finally, the left panel presents the outcomes generated by the model: one observable—the evolution of the indicators—and two non-observable—policy priorities and sectoral inefficiencies.
3.2 Micro-foundations 1: inefficiencies
3.2.1 Public servant benefits
Let us assume that there are  $ n $ agents, each in charge of a public policy that is specific to a single policy issue.Footnote 5 To implement the mandated policy in a given period $ t $, agent $ i $ receives $ {P}_{i,t} $ resources from the central authority. With these resources, the functionary tries to leverage two potential benefits: (a) the reputation from being a proficient public servant and (b) the utility derived from being inefficient. Proficiency, on the one hand, is beneficial because it signals competence to the central authority and the political system. Therefore, proficient agents gain the political status that may catapult their careers in the future. Inefficiency, on the other hand, is also beneficial because it appeals to the utility derived from private gains.Footnote 6 That is, by devoting time and resources to other activities, such as shirking, diverting funds, or benefiting friends (through favorable public tenders), an agent may substitute the benefits from proficiency with the private gains of being inefficient. Of course, there is no free lunch in being inefficient since the central authority exerts monitoring activities and takes punitive actions to increase proficiency. The effectiveness of such mechanisms, however, is bound to the institutional setting of each nation. Accordingly, we elaborate on that below.
We formalize the trade-off between proficiency and inefficiency through
 $$ {F}_{i,t+1}=\Delta {I}_{i,t}^{\ast}\frac{C_{i,t}}{P_{i,t}}+\left(1-{\theta}_{i,t}\tau \right)\frac{\left({P}_{i,t}-{C}_{i,t}\right)}{P_{i,t}}, $$
where  $ {F}_{i,t+1} $ represents the benefit or utility obtained in the next period. Superficially, equation (1) may suggest that, by specifying the personal gain in absolute terms, the difference $ {P}_{i,t}-{C}_{i,t} $ provides no new information (since proficiency is measured in the same units). As we show ahead, this is not the case because $ {\theta}_{i,t} $ is a function of societal inefficiencies. Therefore, personal gains are a (nonlinear) outcome that depends on the agent and the population’s inefficiencies.
The first summand of equation (1) captures the benefit of being proficient.  $ \Delta {I}_{i,t}^{\ast } $ is the change in indicator $ i $ with respect to the previous period (its performance), relative to the changes of all other indicators. More specifically, the relative change in indicator $ i $ is computed as
 $$ \Delta {I}_{i,t}^{\ast }=\frac{I_{i,t}-{I}_{i,t-1}}{\sum \limits_j\mid {I}_{j,t}-{I}_{j,t-1}\mid }, $$
and it captures the idea that the central authority evaluates the performance of each policy through development indicators.
Going back to the first summand of equation (1), we find that the relative change in the indicator is pondered by  $ \frac{C_{i,t}}{P_{i,t}} $. Here, $ {C}_{i,t} $ is the fraction of the allocated resources $ {P}_{i,t} $ that are effectively used toward the policy. We call it the contribution of agent $ i $. As we will show ahead, $ 0\le {C}_{i,t}\le {P}_{i,t} $, so the factor $ \frac{C_{i,t}}{P_{i,t}} $ represents the efficiency with which resources are being used in policy issue $ i $.
Next, let us focus on the second addend of equation (1), which corresponds to the utility derived from being inefficient. Here,  $ {P}_{i,t}-{C}_{i,t} $ is the benefit extracted from not devoting resources to the policy. Thus, when dividing by $ {P}_{i,t} $, it represents the level of inefficiency. We previously mentioned that monitoring and penalties may hinder inefficiencies. This is captured by factor $ \left(1-{\theta}_{i,t}\tau \right) $. Variable $ {\theta}_{i,t} $ is the binary outcome of monitoring inefficiencies. If $ {\theta}_{i,t}=1 $, it means that the government has spotted agent $ i $ in inefficient behavior. In that case, $ i $ is penalized by a factor $ \tau $, such that the benefit from these private gains are reduced. In the literature of public governance, $ \theta $ and $ \tau $ represent two fundamental institutional factors: the potential outcomes of monitoring efforts and the strength of the rule of law. Footnote 7
In order to model the binary outcomes of monitoring efforts, we assume that, every period, an independent realization of  $ {\theta}_{i,t} $ takes place for each indicator. This is nothing else than a Bernoulli process with a probability of success $ {\lambda}_{i,t} $ determined by
 $$ {\lambda}_{i,t}=\frac{\varphi }{1+{e}^{-{D}_{i,t}}}. $$
 Parameter  $ \varphi $ in equation (3) corresponds to the quality of the monitoring efforts. Note that both $ \varphi \in \left[0,1\right] $ and $ \tau \in \left[0,1\right] $, and that they are time and indicator-independent. This means that these parameters can be directly calibrated from empirical data such as development indicators of public governance.Footnote 8
The second factor that determines whether inefficiencies are spotted in equation (3) is  $ {D}_{i,t} $. This represents the level of the private gain extracted by agent $ i $, relative to the private gains of all other agents. Formally, this quantity is obtained from
 $$ {D}_{i,t}=\frac{\left({P}_{i,t}-{C}_{i,t}\right)-\min \left({P}_{\cdot, t}-{C}_{\cdot, t}\right)}{\max \left({P}_{\cdot, t}-{C}_{\cdot, t}\right)-\min \left({P}_{\cdot, t}-{C}_{\cdot, t}\right)}-\frac{1}{2}, $$
where the term -1/2 is necessary to specify a balanced logistic function in equation (3).
Our motivation to correlate the probability of being spotted with the relative level of inefficiency is rather intuitive. Large inefficiencies, such as corruption scandals, come under the spotlight when they stand out from the norm. Thus, in contrast with the traditional principal-agent view, PPI considers the collective-action problem of social norms that prevent the principal from aligning the agents’ incentives.Footnote 9
Now that we have established how the benefit function in equation (1) works, the task of the agent is to determine the level of contribution  $ {C}_{i,t} $. Since agents face an environment with uncertainty and, as we will show ahead, there are interdependencies between the indicators, we adopt a robust and empirically validated reinforcement learning model: directed learning (Dhami, Reference Dhami2016).
3.2.2 Public servant learning
The principle behind directed learning is that actions can go in one of two directions: positive or negative; and outcomes encourage or discourage future actions in the same direction.Footnote 10 For example, if an agent becomes more inefficient and their benefits increase, then, they become even more inefficient in the next period. If, in contrast, the government was able to penalize the agent so that their benefits decreased, they would become more proficient in the next period. Formally, action  $ {X}_{i,t} $ of agent $ i $ can be modeled as
 $$ {X}_{i,t+1}={X}_{i,t}+\operatorname{sgn}\left(\left({X}_{i,t}-{X}_{i,t-1}\right)\left({F}_{i,t}-{F}_{i,t-1}\right)\right)\mid {F}_{i,t}-{F}_{i,t-1}\mid, $$
where  $ \operatorname{sgn}\left(\cdot \right) $ is the sign function. $ {X}_{i,t} $ is an abstraction of any type of action that an agent may take to be inefficient (e.g., shirking, diverting funds, or favoring friends), so $ X $ may take any real value. In order to map action $ {X}_{i,t} $ into the value of the effective resources, we define
 $$ {C}_{i,t}=\frac{P_{i,t}}{1+{e}^{-{X}_{i,t}}}. $$
 Equation (6) incorporates the directed learning model into the policymaking process while making sure that  $ {C}_{i,t}\le {P}_{i,t} $. This completes the micro-foundations that give place to a specific type of inefficiencies—technical inefficiencies—that arise from the policymaking process.Footnote 11 This part of the model has no free parameters (since $ \varphi $ and $ \tau $ can be imputed from data). Therefore, the learning model does not require calibration.
3.3 Micro-foundations 2: government policy priorities
The policy priorities are represented by the allocation profile  $ P={P}_1,\dots {P}_n $. At this point, it is important to introduce a distinction between those indicators that can be intervened via public policies: instrumental; and those that cannot: collateral. An instrumental indicator exists if the government has a policy or program to impact it (i.e., it receives resources). In contrast, a collateral indicator cannot be directly impacted; it is a composite aggregation of various topics, for example, GDP per capita or financial development.Footnote 12 Naturally, policy priorities can only be defined on the $ n $ instrumental indicators, while there can only be $ n $ public servants (one in charge of each instrumental indicator). When talking about all the indicators together, we say that there are $ N\ge n $ policy issues in total.
While a government determines its policy priorities over the  $ n $ instrumental issues, it may have aspirations to improve all $ N $ indicators, even without explicit policy instruments for the collateral ones (political campaigns promising unrealistic GDP growth are a good example). Such aspirations are captured in a vector of goals $ {T}_0,\dots, {T}_N $. Note that we have established a clear difference between goals and priorities, two concepts that are often confused in the literature of sustainable development. Goals, on the one hand, represent the aspirations of a government. They are exogenous variables in PPI and consist of specific values that the central authority wants to reach. Priorities, on the other hand, are not aspirations, but actions. Because of the political economy of the policymaking process, priorities are endogenous variables.
The objective of the government is to close the gap between the goals and the indicators by solving the problem
 $$ \min \left[\sum \limits_i^N{\left({T}_i-{I}_{i,t}\right)}^2\right] $$
through the allocation of budgetary resources across policy issues. The central authority achieves this by adapting its allocation profile  $ P $. This formulation implies that the government wants to achieve goals for topics in which it may not necessarily have policy instruments. This is why concepts such as accelerators Footnote 13 are so important to the 2030 Agenda.
What determines the distribution of resources  $ P? $ Different countries and their governments may have various motivations for allocating resources in specific ways. For example, a welfare state may be more welcoming of pro-social policies, such as unemployment benefits and social housing, while a technologically oriented one may prioritize R&D investment. PPI is flexible enough to allow any function or algorithm to model how a government steers its priorities. This, of course, requires certain priors and data. In absence of such information, we remain agnostic about the specificity of each government and provide a simple yet empirically valid policy prioritization heuristic. First, the government agent uses the rule of prioritizing laggard topics because there is a generalized belief that these issues are bottlenecks to development. In fact, this was a promoted approach during the Millennium Development Goals agenda (Garmer, Reference Garmer2017, p. 1). Thus, the government measures the normalized gaps between goals and indicators
 $$ {G}_{i,t}=\frac{\left({T}_i-{I}_{i,t}\right)-\min \left({T}_{\cdot }-{I}_{\cdot, t}\right)}{\max \left({T}_{\cdot }-{I}_{\cdot, t}\right)-\min \left({T}_{\cdot }-{I}_{\cdot, t}\right)}. $$
 The index with a  $ \cdot $ symbol indicates that we perform an operation on one of the indices while holding a specific value for the other. For example, if we want the maximum value across time for the ith quantity of $ I $, then we write $ \max \left({I}_{i,\cdot}\right) $. Similarly, if we want the lowest indicator in a given period $ t $, then we write $ \min \left({I}_{\cdot, t}\right) $.
Besides supporting poorly developed issues, the government avoids systematically allocating resources to inefficient policies. Therefore, our government heuristic also takes into account the normalized history of spotted inefficiencies of each agent, represented by
 $$ {H}_{i,t}=\frac{\sum_l^t{\theta}_{i,l}\left({P}_{i,l}-{C}_{i,l}\right)-\min \left[{\sum}_l^t{\theta}_{\cdot, l}\left({P}_{\cdot, l}-{C}_{\cdot, l}\right)\right]}{\max \left[{\sum}_l^t{\theta}_{\cdot, l}\left({P}_{\cdot, l}-{C}_{\cdot, l}\right)\right]-\min \left[{\sum}_l^t{\theta}_{\cdot, l}\left({P}_{\cdot, l}-{C}_{\cdot, l}\right)\right]}. $$
 The goal-indicator gap encourages prioritization, while a reputation of inefficiency discourages it. However, international experience suggests that the gaps play a more central role than the inefficiencies (Izquierdo et al., Reference Izquierdo, Pessino and Vuletin2018). Thus, we look for a function where the allocation  $ {P}_{i,t} $ depends mainly on $ {G}_{i,t} $ and, in a lesser measure, on $ {H}_{i,t} $. We adopt the functional form.
 $$ {q}_{i,t}={G_{i,t}}^{1+{H}_{i,t}}, $$
which can be normalized to obtain the policy priorities
 $$ {P}_{i,t}=\frac{q_{i,t}}{\sum_j{q}_{j,t}}. $$
 Equation (10) is rather intuitive. In the term  $ {G}_{i,t}^{1+{H}_{i,t}} $, the base is always fractional while the exponent is always greater than one. This means that policy issues with more visible inefficiencies will be penalized more. Appendix D.5 shows that the estimated allocation profiles are robust across different functional forms that follow the same logic as equation (10).
Up to this point, it is important to recall that the allocation profile  $ P $ refers to transformative resources. Transformative refers to those resources allocated to generate changes in development indicators beyond those already set in motion by committed expenditure (like maintaining highways and hospitals). While there may be committed expenditure that contributes to the natural growth of the indicator, this is accounted for in a growth factor that we explain below. In economic terms, PPI models public expenditure that, on the margin, improves the indicators. That is, $ {P}_{i,t} $ should not be interpreted as an absolute value (and neither monetary), but as the transformative resources currently spent in relation to those historically assigned in policy issue $ i $.Footnote 14 For example, $ {P}_{i,t}>{P}_{j,t} $ should be interpreted as: policy issue $ i $ receives, in period $ t $, more priority than $ j $ in relation to what each one has been historically allocated.
3.4 Macro-dynamics: development indicators
Now that we have built the micro-foundations of the model, we connect them to the evolution of the development indicators. In doing so, we aim at generating indicator dynamics that resemble empirical data in three aspects: (a) that each indicator starts at a given value and reaches a specific final value and, (b) that all indicators arrive at their final values at the same time, and (3) that these data present a certain level of volatility. We address attribute (a) here and leave (b), and (c) for the calibration procedure explained in Appendix D in the supplemental materials.
3.4.1 Indicator dynamics
From the micro-foundations, we know that a fraction  $ {C}_{i,t} $ (the contribution) of an allocation $ {P}_{i,t} $ is used in the implementation of public policies. In conjunction with the incoming spillover effects $ {S}_{i,t} $ (these could be positive or negative), public policies transform the associated indicator $ {I}_{i,t} $. We model this transformation through a random growth process. Let $ {\gamma}_i $ denote a probability associated with the growth process experienced by indicator $ i $. This probability depends on a combination of a parameter $ {\alpha}_i $, network effects, and budgetary allocations. The value of $ {\gamma}_i $ may be above the lower-bound $ {\alpha}_i/\left({\alpha}_i+1\right) $, due to the contributions fostering the public policy, and the existence of incoming spillovers. Therefore, the growth process is modeled as independent Bernoulli trials with a probability of success
 $$ {\gamma}_{i,t}=\frac{\alpha_i+{C}_{i,t}/{P}_t^{\ast }}{\alpha_i+{e}^{-\frac{NS_{i,t}}{\sum_j\left({T}_j-{I}_{j,t}\right)/\left({T}_j-{I}_{j,0}\right)}}}, $$
where  $ {P}_t^{\ast } $ is the maximum amount of allocated resources across all policy issues in period $ t $. Note that $ \frac{C_{i,t}}{P_t^{\ast }}=\frac{C_{i,t}}{P_{i,t}}\frac{P_{i,t}}{P_t^{\ast }} $, which means that the effect of the contribution is the combination of how efficiently are the resources being used ( $ {C}_{i,t}/{P}_{i,t} $) and how much resources policy issue $ i $ receives in comparison with all other issues ( $ {P}_{i,t}/{P}_t^{\ast } $). The sum dividing the spillover term $ {S}_{i,t} $ is a correction that we explain ahead.
Next, we define the growth equation of indicator  $ i $ as
 $$ {I}_{i,t+1}={I}_{i,t}+{\alpha}_i\left({T}_i-{I}_{i,t}\right)\xi \left({\gamma}_{i,t}\right), $$
where  $ \xi \left(\cdot \right) $ is the binary outcome (0 or 1) of a growth trial. The growth factor $ {\alpha}_i $ lives in $ \left(0,1\right) $, and it shapes both the probability of success—as indicated in equation (12)—and the amount of growth. We can think of $ {\alpha}_i $ as all the other determinants responsible for an indicator’s growth that are not explicit in the model.Footnote 15 This factor needs to be calibrated to match the second attribute of the data: all indicators reach their final values at the same time. Note that the gap $ {T}_i-{I}_{i,t} $ shrinks as the indicator grows and that $ {I}_{i,t} $ is always lower than $ {T}_i $. This means that the indicator is guaranteed to converge to $ {T}_i $, which takes care of the first attribute of the data: reaching the indicator’s specific final value. Because of these logistic-like convergence dynamics, the change in the indicator becomes, on average, smaller as it approaches $ {T}_i $, so the magnitude of spillover effects $ {S}_{i,t} $ decreases with time. In order to correct this artifact, equation (12) divides the spillover term, in the exponential function, by the average normalized gap at time $ t $.
Note that the probabilistic nature of equation (13) is consistent with the fact that indicators are not directly manipulable, but rather, governments try to affect them through policy interventions, which sometimes succeed and sometimes fail, depending on the efficiency and efficacy of their implementation. It also implies that the interlinkages do not represent causal relations, but conditional dependencies that increase or decrease the chance of improving an indicator. This is consistent with our earlier point on the impossibility to establish causation in aggregate data. We elaborate on the impossibility of causal networks of development indicators in the next section.
3.4.2 SDG networks and spillovers
Let us define a network with  $ N $ nodes, each one corresponding to an indicator. An arrow $ i\to j $ represents a change in indicator $ j $ conditioned by a change by indicator $ i $, not a causal link. That is, the existence of $ i\to j $ means that, if we observe a change in $ j $, a change in $ i $ was likely to have taken place. However, a change in $ i $ does not necessarily trigger a change in $ j $ (otherwise it would be a causal link).Footnote 16 In terms of the model, a positive edge $ i\to j $ indicates a higher likelihood of $ j $ growing, while a negative one translates into a lower likelihood. This is consistent with conditional dependencies. A further discussion of why SDG networks—by themselves—cannot capture causal relations is provided by Ospina-Forero et al. (Reference Ospina-Forero, Castañeda and Guerrero2020).
We say that a spillover from  $ i $ to $ j $ takes place through the interaction of $ i $’s change $ \Delta {I}_{i,t}={I}_{i,t}-{I}_{i,t-1} $ and the intensity of the conditional dependency specified in the adjacency matrix $ \unicode{x1D538} $. Therefore, the incoming spillovers from $ i $ to $ j $ in period $ t $ are
 $$ {S}_{i\to j,t}=\Delta {I}_{i,t-1}{\unicode{x1D538}}_{ij}, $$
which can be positive, negative, or zero. We are interested in the strength of incoming spillovers that each node receives. Thus, the relevant measure to consider is the net incoming spillovers
 $$ {S}_{j,t}=\sum \limits_i\Delta {I}_{i,t-1}{\unicode{x1D538}}_{ij}, $$
which is one of the determinants of successful growth in equation (12).
3.5 Summary
Appendix B provides a list with all the model variables presented above, specifying whether they are endogenous or exogenous, and the nature of their imputation/calibration. We would like to point out that PPI takes five exogenous sources of information as inputs: (a) initial conditions, (b) spillover network, (c) goals, (d) governance parameters, and (e) growth factors. The first one is usually collected by governments and international organizations. The second one can be estimated via quantitative or qualitative methods (see Ospina-Forero et al., Reference Ospina-Forero, Castañeda and Guerrero2020 for a review on network-estimation methods). The third is an exogenous variable that can be built from societal consensus, political platforms, and public consultations, to mention a few. The fourth can be obtained from international datasets, such as the Worldwide Governance Indicators. The fifth is calibrated (see Appendix D). Algorithm 1 summarizes the model in a few lines. Without priors on the initial values of the endogenous variables, we use random assignments and Monte Carlo simulations. Appendix D.4 elaborates on the stability of simulations in a Monte Carlo setting. Finally, while Algorithm 1 considers four types of exogenous inputs (boundary conditions, edge weights, governance indicators, and growth factors), we should point out that there can be additional sources of information, for example, a vector specifying how flexible are the transformative resources to be reallocated in each policy issue. This is common among federations, where the subnational governments may receive resources from the federal authority with “strings attached”; that is these resources have to be spent in specific topics. Of course, such kind of data may only be available to certain governmental authorities. Nevertheless, the possibility of incorporating them into the analysis of PPI speaks to its flexibility and usefulness.
PPI pseudocode.

4 Data
This implementation of PPI focuses in Mexico because it grew out of a collaboration with the UNDP Office for Mexico. However, its methodology can be relevant for many other countries since it requires mainly information about development indicators; although, for certain simulation exercises, we also make use of budgetary information aggregated at the level of the 17 SDGs. The data on the values that governments want to achieve for the different development indicators (the goals) is critical for the application of the model (but not for the retrospective analysis); unfortunately, this information is not readily available in many countries. Therefore, the use of PPI requires government officials to make an important effort for establishing goals with a certain degree of granularity. In this paper, for illustration purposes, we employ broad goals that were specified in official documents by the Mexican government. In this section, we present all these data, leaving further details about their preprocessing and normalization for Appendix A in the supplementary materials.
4.1 Development indicators
We compiled a dataset with 141 national-level development indicators of Mexico, covering the period 2006–2016, such that each SDG contains at least one indicator. Given the current social context of Mexico and the interest of the stakeholders of the project, special attention was given to collecting indicators associated with SDG 16. We split SDG 16 into its two components: peace and justice (SDG 16a) and strong institutions (SDG 16b). This separation is important in the Mexican context as the former covers violence issues while the latter touches on anti-corruption policies. All indicators have been pre-processed so that their values are in the range [0,1], and larger magnitudes denote better outcomes.
A limitation of the official UN SDG database is that many indicators lack comprehensive time coverage. For this reason, we collected data from additional sources and performed a manual classification into the SDGs. Finally, we labeled each indicator as instrumental or collateral according to the inputs received in a stakeholder workshop co-organized with the UNDP and the Mexican National Laboratory for Public Policy. Figure 2 shows the total number of instrumental and collateral indicators by SDG. Accordingly, there are enough instrumental topics to define policy priorities across all the SDGs.
Number of indicators by type and sustainable development goal.
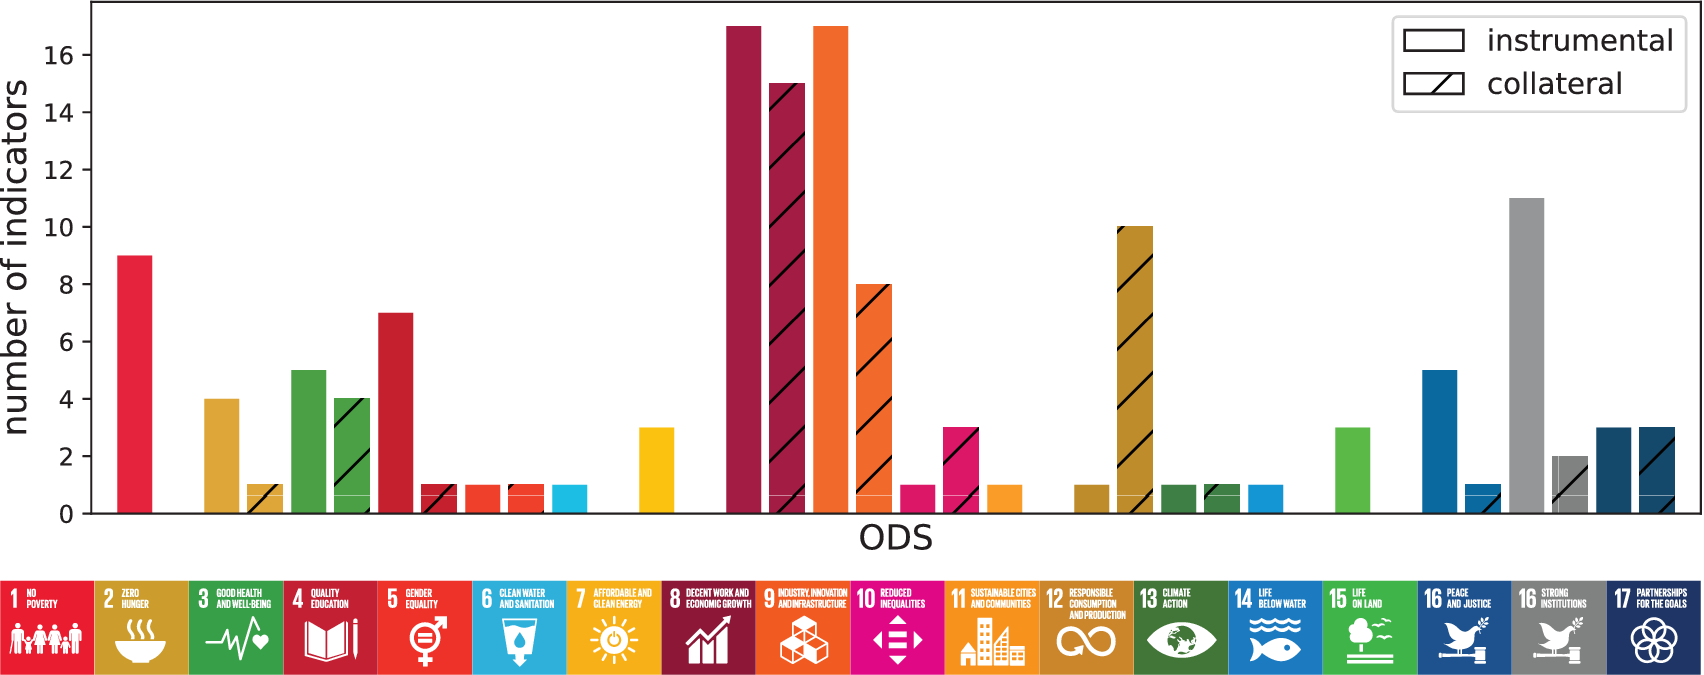
Table 1 shows the summary statistics of the data by source.Footnote 17 The most salient feature in this table is the relatively large number of missing observations coming from CONEVAL (the watchdog of social policy in Mexico). This is because CONEVAL’s indicators are constructed on a biannual basis. Overall, whenever we encounter missing values, we impute them through linear interpolations. Further details can be found in Appendix A.Footnote 18
Development-indicator data by source

Note. CONEVAL: Mexican institution responsible for the evaluation of social policy. INEGI: Mexican national statistics bureau.
Abbreviations: FAO, Food and Agriculture Organization of the United Nations; SDG, sustainable development goal; UN, United Nations; WDI, World Development Indicators.
4.2 Governance
For the governance parameters related to the quality of monitoring efforts  $ \varphi $ and the strength of the rule of law $ \tau $, we use data from the Worldwide Governance Indicators. These indicators reflect the perception of citizens, entrepreneurs, experts in the public/private sector, and NGOs. Although perception-based indices have well-known limitations, they are still one of the best metrics used in corruption studies like those described by Guerrero and Castañeda (Reference Guerrero and Castañeda2019). The indicator of control of corruption reflects the quality of the monitoring efforts by the central authority, which is an important element in the model. The indicator of rule of law, on the other hand, captures the quality of institutions designed to reassure a law-abiding society. Just like with the SDG data, we normalize these indicators across all countries in the sample, and for the years corresponding to the sampling period of the dataset. The normalized values fall within [0,1]. Therefore, the values of $ \varphi $ and $ \tau $ reflect Mexico’s quality of monitoring and rule of law relative to the rest of the world (Appendix G provides a thorough analysis on the relevance of these parameters for curbing inefficiencies).
4.3 Network
The network of conditional dependencies between development indicators can be obtained through various methods, each one implying certain assumptions about the data and its underlying generating mechanisms. Ospina-Forero et al. (Reference Ospina-Forero, Castañeda and Guerrero2020) provide a comprehensive survey on this topic. We must highlight that estimating large networks from time series is a burgeoning research area, so there is no strongly preferred method or accepted gold standard, especially given that development-indicator series tend to be quite short; with generally no more than 10 observations.Footnote 19 Our method of choice is the Sparse Gaussian Bayesian Networks approach, developed by Aragam et al. (Reference Aragam, Gu and Zhou2019) and accessible through the R package sparsebn. We employ sparsebn to estimate the conditional dependencies network of Mexico using the time series constructed from its development indicators. The method estimates a structural equation model and returns a weighted directed network of conditional dependencies where the edges have been filtered in order to minimize potential overfitting (hence the sparseness of the topology).Footnote 20
The sparsebn method is applied to the first differences of the indicators’ time series (for the period 2006–2016). This is recommended to eliminate potential false positives due to inertial trends that are attributable to the natural temporal evolution of the data (and not to their interdependencies). Next, to improve the estimation, those edges considered—by expert knowledge—to be false positives are removed. Finally, to prevent distorting effects due to extreme values in edge weights (outliers), the magnitude of the maximum and minimum weights is bound by the 95th percentile of the weights’ magnitude distribution (the distribution of the absolute values of the weights).
We represent the network as a matrix  $ \unicode{x1D538} $ where the dependencies or edges go from rows to columns. Hence the strength of a dependency $ i\to j $ is indicated by the weight $ {\unicode{x1D538}}_{i,j} $. If the sign of the weight is positive (negative), we have a synergy (trade-off). $ \unicode{x1D538} $ should be interpreted as a stylized fact—a collection of conditional dependencies—that the model takes into account to explain the dynamics of the indicators. Table 2 provides descriptive statistics of the estimated network.
Network statistics

Note. The network has been divided into synergies and trade-offs. Due to the uneven distribution of indicators across SDGs, we normalize the statistics by the number of indicators in the relevant SDG. In(out)-degree is the number of incoming(outgoing) connections to(from) a node. The in(out)-strength is the sum of the weights of all incoming(outgoing) connections to(from) a node.
Abbreviations: SDG, sustainable development goal.
4.4 Goals
When calibrating the model to historical data, we can assume that the government’s aspirations or goals are the final values of the indicators. However, for a prospective analysis, the aspirations may be any hypothetical combination of values for the indicators (higher than their initial values). In Mexico, and other Latin American countries, governments are required by law to publish a development plan at the beginning of their term. The purpose of such a document is to provide clarity on development strategies and objectives, as well as to facilitate ex-post evaluations. For the Mexican federal government, this document is the National Development Plan (NDP) and, in its 2019–2024 edition, consists of 234 objectives (i.e., policy issues), 67 of which have concrete development indicators. That is, this document presents the goals that the administration—taking office in 2019—wants to achieve in a 6-year term. Each of these indicators has been assigned a development goal, which is a specific value to be achieved for the indicator. Thus, we use this information as a guideline to conduct the prospective analysis. Figure 3 shows extracts of the Annex XVIII-Bis of the NDP (Cámara de Diputados, Reference de Diputados2019) containing some of its development goals.
Example of official development goals.
Note: Extracts from the Annex XVIII-Bis of Mexico’s National Development Plan. Each box describes an indicator used to evaluate progress in a specific policy issue of the NDP, as well as its baseline value (Línea base) and its goal (Meta). From left to right, the indicators track the following policy issues: carbon emissions from burning fuels; poor access to health services; energetic independence; informal labor. In the same order, the extracts were obtained from pages 187, 103, 166, and 128.
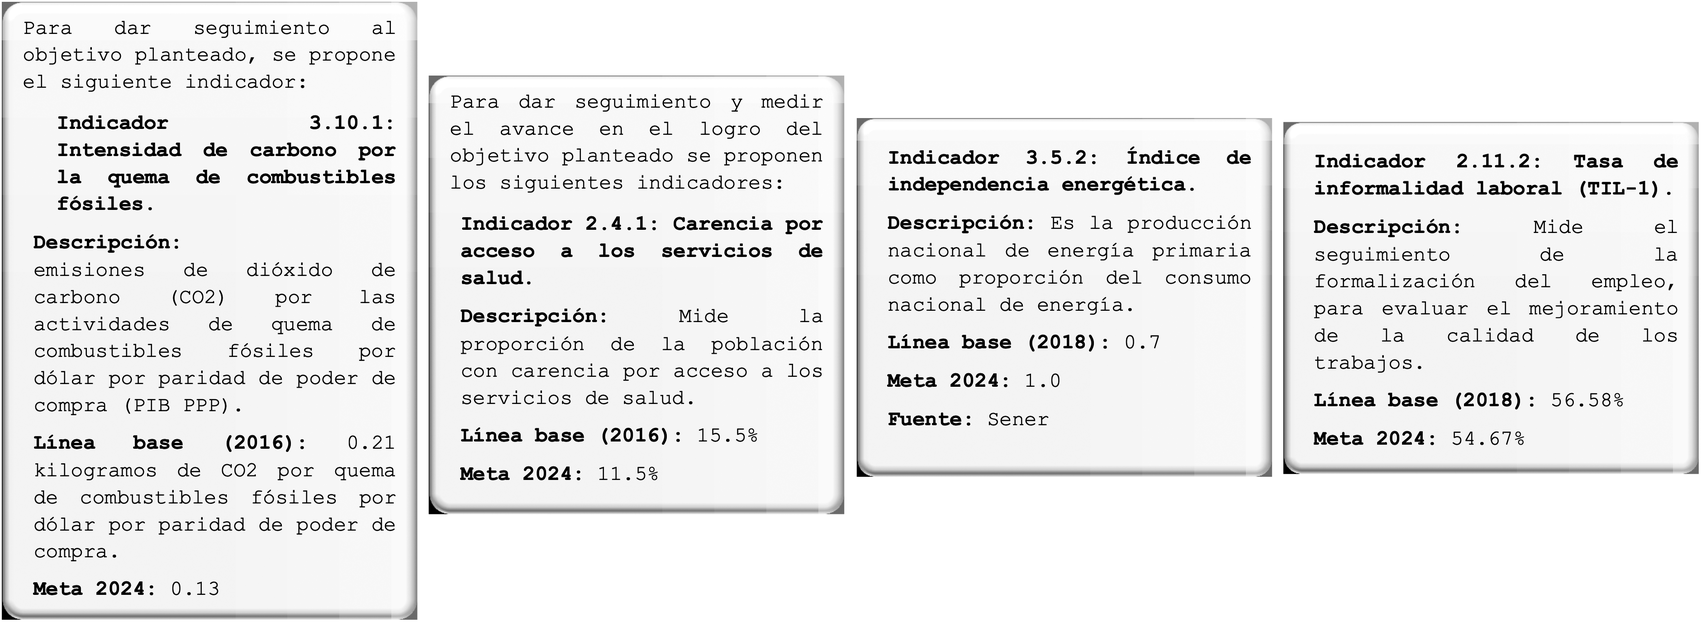
In spite of providing explicit objectives for the NDP indicators, these data do not map directly into the SDG indicators. This is partly because governments evaluate their development through metrics that are specific to their context and needs, meaning that these indicators may not necessarily exist for other countries and, thus, are not part of official international SDG datasets. Nevertheless, the Mexican Treasury has developed a methodology to classify the NDP objectives into the SDGs (SHCP, 2017). The NDP provides the resulting classification of the 67 indicators (Cámara de Diputados, Reference de Diputados2019, pp. 216–19). Thus, to determine the development goals for the prospective analysis, we used the following procedure.
1. Compute the proposed growth rate for each indicator.
2. If an indicator in the SDG database corresponds to one in the NDP, assign the associated growth rate.
3. If an indicator in the SDG database has no corresponding indicator in the NDP, assign the average growth rate of the NDP indicators that are in the same SDG.
4.5 SDG budgeting
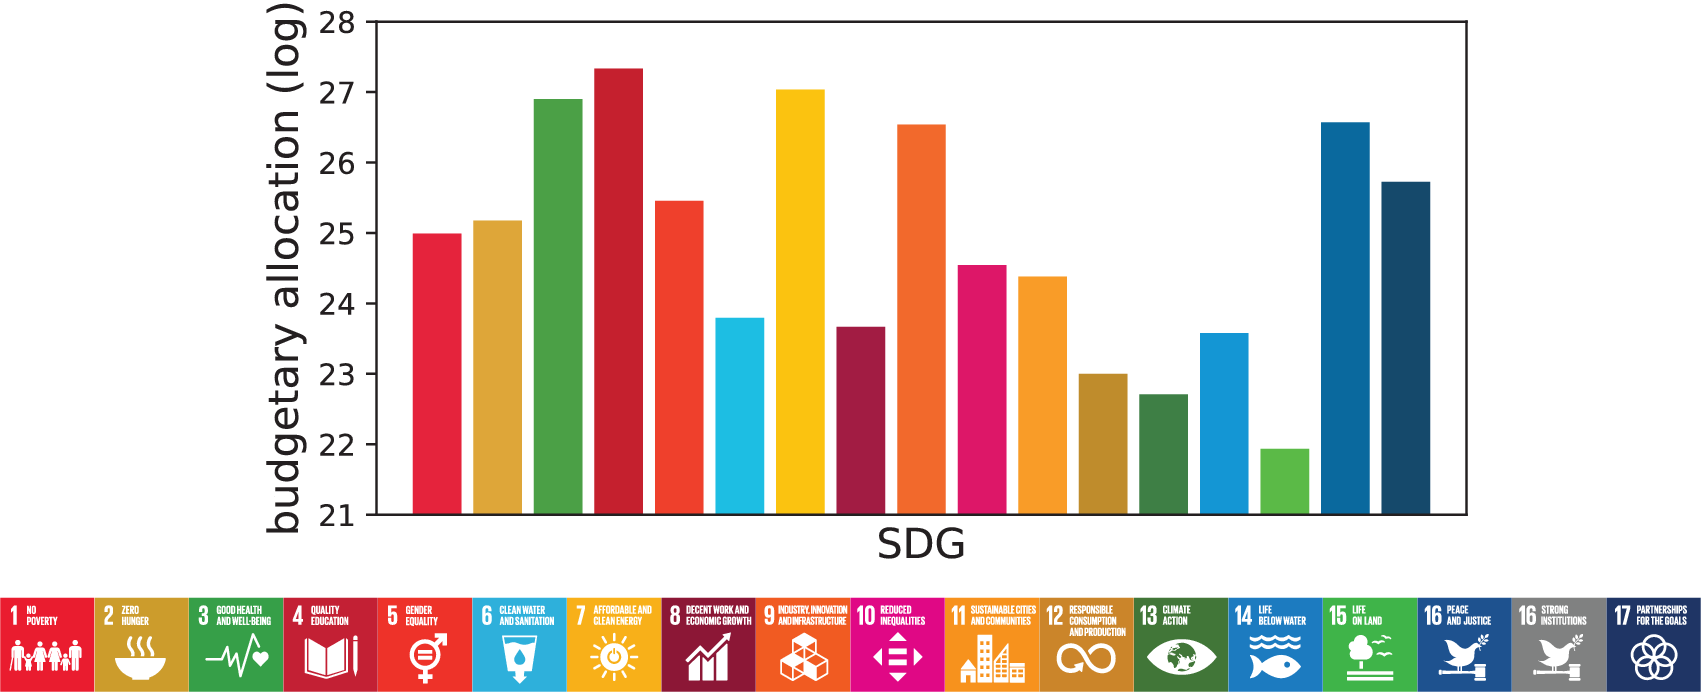
An additional innovation of the Treasury’s methodology consists of linking expenditure categories into SDGs (SHCP, 2017). This is something unique to Mexico, and only now it is being emulated by other nations, so our study also provides a first view to cutting-edge open spending data and a framework to exploit it. The SDG-fiscal data consists of more than 1,500 expenditure records, each one categorized into one SDG. Figure 4 shows the distribution of resources allocated through the Mexican budget for 2019 across the 17 SDGs. The fiscal data that have been classified into SDGs do not represent the entire budget of the government because some types of expenditure do not fit any SDG (e.g., expenditure on national defense). Besides, these data do not distinguish between transformative and non-transformative resources. Thus, the exercise to be performed with this information is purely exploratory. Nonetheless, we consider that is important to demonstrate how PPI can exploit expenditure data. Finally, and to avoid any confusions, let us clarify that these budgeting data are only used in one simulation exercise, and are not employed to calibrate the model.
2019 budget distribution across sustainable development goals. The units in the vertical axis are current Mexican pesos in logarithmic scale.
5 Calibration and Retrospective Analysis
In this section (and in Appendix D), we explain the calibration procedure and infer historical policy priorities. For the inference of past policy priorities, we run the model simulating the evolution of the indicators during the sampling period. In the absence of data showing how the government distributed resources to the different indicators in the past, the model’s endogenous allocation profile becomes quite useful to infer the priorities. Furthermore, we can compare these synthetic data against the allocation profile simulated in a prospective analysis, which uses the data on development goals. In fact, Section 6 shows such comparison. For the time being, allow us to demonstrate the calibration process and the outcomes from the retrospective simulations.
5.1 Calibration of growth factors and convergence time
In order to infer retrospective policy priorities, we need to calibrate the model’s parameters. The motivation behind such calibration is to generate synthetic indicators that reflect certain features of the historical data by tuning an aggregate quantity (at the level of each indicator) representing the contribution of those factors that the model does not specify explicitly among its agents and processes. More specifically, the growth factors (the free parameter  $ {\alpha}_i $) describe the actions of a set of agents that are not made explicit in the model but that exert influence on the evolution of SDG indicators. For instance, private agents (e.g., firms and households) may enable the growth of certain indicators, irrespective of the contributions made by the government. Likewise, the actions of international agents (e.g., multilateral organizations) or events (e.g., a global pandemic) could decelerate development in some issues. Next, we describe how to find the values of these growth factors.
Appendix D, in the supplementary material, presents in detail the different calibration procedures and studies their computational efficiency. To calibrate each individual growth factor in the vector  $ {\alpha}_1,\dots, {\alpha}_N $, the method homogenizes convergence times across indicators. This is required because all empirical indicators reach their final values in the same number of periods. Therefore, with the calibration procedure, we are able to preserve this property in the synthetic indicators. In a second step, we find a number of simulated periods under which the calibrated growth factors yield indicator dynamics with similar volatility to the empirical one. This allows us to establish an equivalence between real time and algorithmic time, and then to determine the temporal feasibility of the scenarios proposed via counterfactual simulations.
5.2 Retrospective policy priorities
For the retrospective analysis, we use the development-indicator data, the governance parameters fixed in their historical values, and the estimated network. In other words, PPI’s inputs are: (a) the initial values of the indicators, (b) the network of conditional dependencies, (c) the final values of the development indicators, (d) the parameters that identify the country’s rule of law and the monitoring of corruption, and (e) the growth factors calibrated according to the algorithms developed in Appendix D.
The procedure consists of the following steps:
1. Instantiate the agents with random initial values for the endogenous variables.
2. Impute the values of the indicators from their empirical values in 2006.
3. Impute the vector of development goals from the empirical values of the indicators in 2016.Footnote 21
4. Impute the governance parameters $ \varphi $ and $ \tau $ using the empirical values obtained from the data presented in Section 4.2.
5. Impute the vector of
$ {\alpha}_i $ using the values calibrated through the algorithm proposed in Appendix D.6. Run the simulation and stop when all indicators have reached their goals (the ones imputed in step 3).
7. Compute the inter-temporal distribution of resources (further details are explained below) for this specific run.
8. Go back to step 1 and repeat all the steps multiple times, recording the inter-temporal distribution of resources of each run.
9. Compute the average inter-temporal distribution of resources across the multiple runs; this is the retrospective allocation profile (see below).


A clarification is in order with respect to point 3. Because the true development goals of the previous Mexican governments are unknown (beyond vague statements presented in the official discourse), we cannot use the retrospective simulations to produce an ex-post evaluation of these administrations. In other words, we cannot establish, among other things, whether the budgetary priorities were consistent with their development goals. However, setting the goals with the end-values of the indicators is still a useful exercise for two reasons: (a) we can calibrate the model to determine the algorithmic time that takes for the indicators to reach their final values, and (b) we can identify how priorities have to change if goals differ to the observed final values are established in a prospective analysis.
Next, we present the details on how to compute the allocation profile and, then, we describe the results for the retrospective simulations. As mentioned above, the latter are obtained once the growth factors and the algorithmic time for convergence in the historical sample have been calibrated. An allocation profile is estimated with the average distribution of resources across independent Monte Carlo simulations. For a single simulation, we obtain  $ n $ synthetic time series of how the government agent allocates resources $ {P}_{i,t} $ across each indicator $ i $ and every period $ t $. The inferred allocation profile is built by, first, computing the inter-temporal mean of allocations for each indicator. It is important to recall that only the instrumental indicators are part of these profiles since their associated government programs receive public funding. Then, by performing $ M $ Monte Carlo independent simulations, we obtain $ M $ vectors $ {P}_{i,\cdot } $ of inter-temporal means. Finally, for each indicator $ i $, we compute the mean allocation across Monte Carlo simulations. Altogether, the inferred allocation to the instrumental indicator $ i $ is given by
 $$ {\mathcal{P}}_i=\frac{1}{M}\sum \limits_m^M\frac{1}{L_m}\sum \limits_t^{L_m}{P}_{i,t,m}, $$
where  $ {L}_m $ is the number of simulation steps that the $ {m}^{\mathrm{th}} $ simulation took to converge.
Figure 5 shows the inferred policy priorities that the Mexican government established during the sampling period.Footnote 22 According to this exercise, the most prioritized indicators tend to be in SDGs 8, 9, and 16b. The specific definitions of policy issues are presented in Tables 3 and 4, which show the 10 most and least prioritized indicators respectively. The retrospective estimation suggests that the most prioritized issue was building statistical capacity, while the least one was fighting the organized crime. Both cases are consistent with observations by academics, commentators, and public opinion. On the one hand, it is well known that previous governments invested significant resources in creating regulatory organizations to guarantee the generation, transparency, and protection of public data. This is an important part of the statistical capacity of the state. On the other hand, the spike in violence and crime across the country during the last decade speaks to the low priority that this policy issue has received in recent administrations.
Retrospective allocation profile.
Note: Each bar in the left panel can be interpreted as a share of the ratio of transformative resources (expenditure on the margin), so they add up to one. The bars on the right panel are averages of the bars in the left panel, computed for each color.

Most prioritized indicators
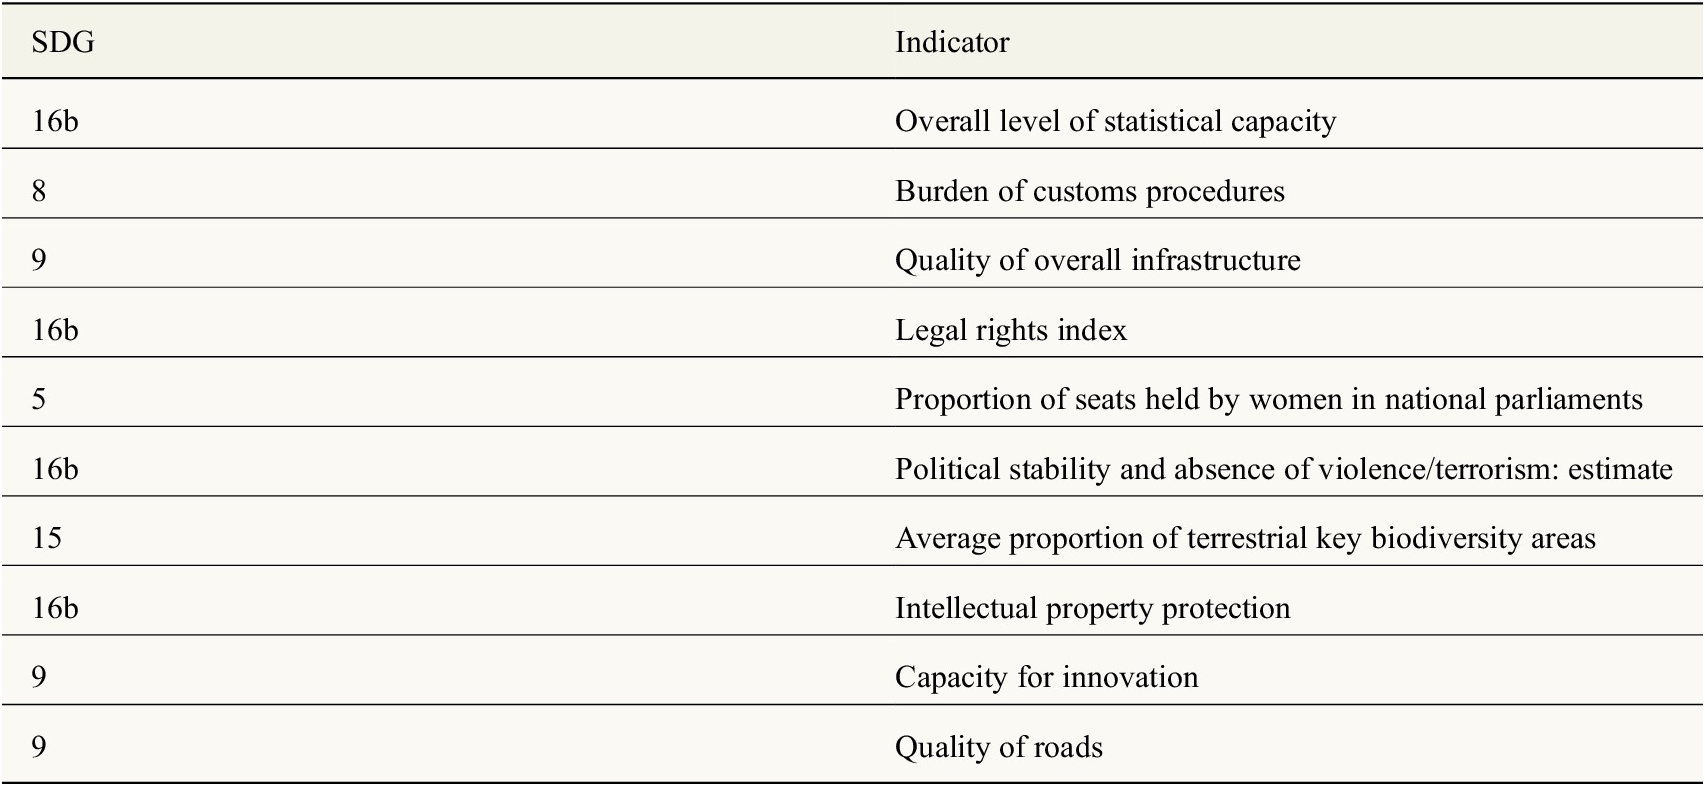
Note. The indicators have been sorted from top to bottom in descending order of priority. In other words, the first item is the most prioritized.
Abbreviations: SDG, sustainable development goal.
Least prioritized indicators
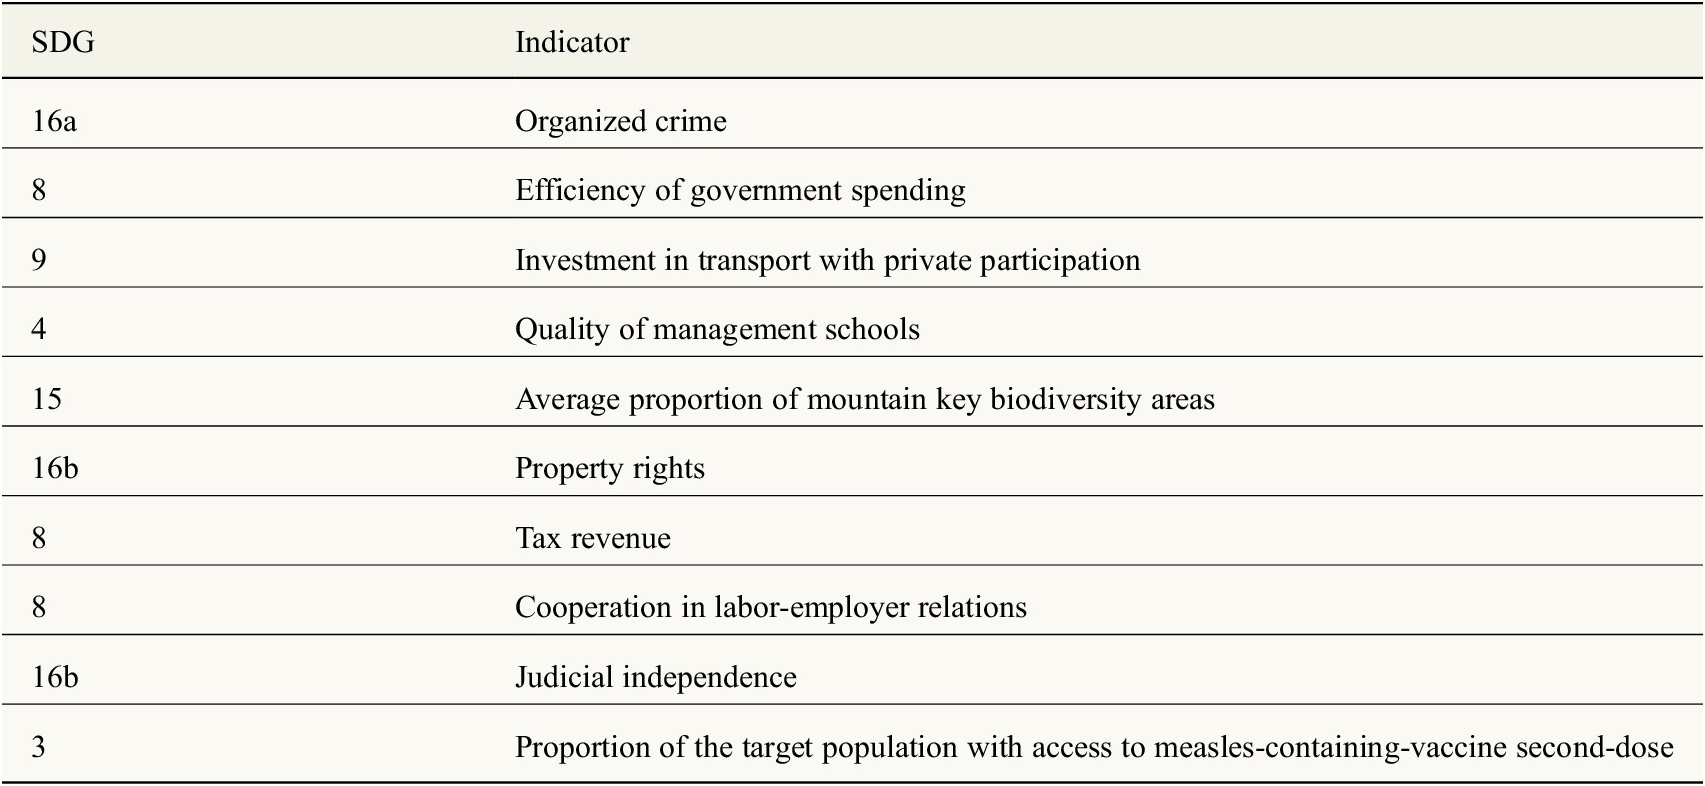
Note. The indicators have been sorted from top to bottom in ascending order of priority. In other words, the first item is the least prioritized.
Abbreviations: SDG, sustainable development goal.
The way to interpret the bars in Figure 5, for the purpose of policy guidance, is in terms of a ranking of budgetary priorities. These priorities are defined as ratios of transformative expenses with respect to the budget assigned to the corresponding programs. In other words, the lack of access to highly disaggregated budgetary data only allows to establish ordinal inferences. However, this shortcoming can be overcome with an alternative version of the model in which budgetary data become an additional input; work that is out of the scope of this paper. Even with just ordinal inferences on policy priorities, PPI provides valuable insights when performing prospective simulations and counterfactual scenarios as shown in the next sections.
6 Prospective Analysis
The inferences derived from prospective analyses are the most useful to the project’s stakeholders and, thus, we dedicate the rest of the paper to this type of exercises. Here, we employ the data on goals obtained from the NDP. Thus, the inputs for PPI’s prospective analysis are: (a) the final values of the development indicators, (b) the network of conditional dependencies, (c) the goals constructed from the NDP data, (d) the governance parameters, and (e) the growth factors calibrated by replicating the inter-temporal volatility of indicators in the retrospective analysis. The procedure follows the same steps described in Section 5 but with three modifications: (a) in step 1, the initial values for  $ P $ are imputed through the retrospective allocation profile previously estimated (not at random); (b) in step 2, the initial levels of the indicators correspond to their empirical values in 2016, and, (c) in step 3, the development goals correspond to the ones computed in Section 6.1.
The inferred prospective allocation profile represents the policy priorities that the Mexican government would establish if it would truly pursue the goals presented in the NDP. This, like any prospective analysis, comes with a couple of assumptions. First, it is presupposed that the growth factors  $ {\alpha}_1,\dots, {\alpha}_N $ are the same as the ones obtained from the retrospective analysis. For the type of short-term studies that PPI embraces, this assumption is quite reasonable because the growth factors capture structural features whose changes take place during many years. Second, the network of conditional dependencies is supposed to be the same as the one used in the retrospective analysis. The argument here is similar to the one for the growth factors: the network topology and its weights represent structural relations. Note that the previous assumptions do not prevent the user from performing experiments modifying the growth factors or links in the network. For instance, an interesting exercise would be to understand how promoting certain synergies (strengthening positive edges) and discouraging certain trade-offs (removing negative edges) can affect the feasibility of a development strategy. This type of experiment is considered in Figure 1 under interventions that fall within the realm of structural reforms. Third, as with the retrospective analysis, allowing $ P $ to be fully endogenous assumes fluidity in the allocation of transformative resources. This is a reasonable assumption given that most fiscal rigidities take place among committed resources that are not transformative. Nevertheless, should the user have data on the fiscal rigidities of transformative resources, it can also be used in PPI (as an additional input), something that we explore in Section 6.5 with the budgetary data.
We organize the prospective analysis in the following way. First, we present the development goals constructed from the NDP. Second, we obtain the policy priorities that Mexico would establish to reach these goals. We call this inference fluid priorities because the allocation profile  $ P $ is completely endogenous. Third, we assess the feasibility of the fluid priorities by estimating the years it would take the government to achieve the proposed goals. Fourth, we compare the budgetary data with fluid priorities. This allows us to measure the level of policy coherence through an index created by Guerrero and Castañeda (Reference Guerrero and Castañeda2020). Fifth, we explore rigid priorities by fixing $ P $ according to coarse-grained budgetary data and evaluate their feasibility. Sixth, and lastly, we introduce a methodology for discovering accelerators through PPI and compare our results against the naïve approach of using node-centrality metrics.
6.1 Development goals
Figure 6 presents the development goals of the NDP mapped into the SDG indicators of our database. On average, the proposed growth rate for the indicators is higher than 50%. SDG 16b presents more heterogeneity of goals because it has more direct matches between NDP and SDG indicators. In contrast, the bars that have identical values are the result of assigning the average growth rate of all indicators within the same SDG (because the indicator at stake did not have a direct match with an indicator from the NDP; see Section 4.4 for more details). We build the prospective goals vector  $ T $ with this information by taking the final values of the indicators and growing them according to the associated rates.
Prospective development goals.

6.2 Fluid policy priorities
Figure 7 presents fluid policy priorities and compares them with the retrospective ones. The prospective allocation profile should be interpreted as the policy priorities that the Mexican government would establish—under the assumptions previously discussed—if it would truly pursue the proposed goals. Note that, since the goals are based on the NDP, the discrepancies between the prospective and the retrospective profiles allow to answer the following question: how different should policy priorities be (produced by the prospective estimation) from what they have been until now (inferred from the retrospective estimation) if the goals are to be met? From comparing both allocation profiles, we can see important increments in SDGs 1, 3, 9, 10, 12, and 13. On the other hand, the SDGs with a noticeable decrease in priorities are 4, 6, 7, and 16b. Whether the inferred prospective allocations are definitive actions that the government will reflect in its budget is a different story, one that we explore in Section 6.4. The important takeaway from this exercise is that, with this type of simulation exercise, PPI can show that budgetary allocations across government programs can change substantially when there are differences between the goals from the past and new ones (different government agendas).
Prospective policy priorities under perfect fluidity.
Note: Each bar can be interpreted as a share of the ratio of transformative resources (expenditure on the margin), so they add up to one. The left panel corresponds to the retrospective policy priorities presented in Figure 5. The right panel presents the fluid policy priorities inferred from the prospective analysis.

6.3 Feasibility under fluid priorities
The feasibility of a goal usually carries an economic meaning, as it implies achieving something with a limited amount of resources (natural, financial, human, or time-wise). Since PPI assumes a constant expenditure flow (the problem is an allocative one, rather than the size of the overall budget), a natural way to think about feasibility is in terms of how long would it take to achieve a set of goals. Furthermore, given that most governments occupy the office for a limited number of years (at least in democratic regimes), feasibility means being able to reach the government’s goals in such time frame. Nevertheless, one could also think of multi-government feasibility if, for example, a government or political party considers a multi-term strategy. In any case, common sense would suggest that goals that can only be reached in more than two decades are unfeasible for a government strategy. Thus, in this study, we estimate the number of years that it would take the Mexican government to reach the goals proposed in the NDP, and assess their feasibility accordingly.
Before interpreting the results, it is important to point out a caveat in this analysis and its potential solutions. Because there is no one-to-one correspondence between the SDG indicators and the NDP, the way the goals vector was constructed involves computing growth rates from the NDP and mapping them into the SDG indicators. This introduces a bias in those indicators where Mexico lags the most. For instance, if an indicator has a value near zero, it means that, across all the countries in the dataset, Mexico is among the worst performers in this topic. When multiplying that value by 1+growthRate, one would obtain a very low goal, so a minuscule gap to be covered. In reality, the government would not have such a low goal for that indicator (especially under the logic of laggard topics being bottlenecks), but due to the lack of information regarding this goal, its approximation through growth rates is the second best. The consequence is that those indicators with the most modest goals will likely show fast convergence times. To fix this, it is important to obtain development goals in the original units of the data, and this can be done by either selecting indicators for which the goals have been established in their original units (e.g., in official documents) or by working closely with the stakeholders.Footnote 23 The main implication of this bias is that it underestimates the average convergence time in the prospective analysis. Thus, the interpretation in terms of feasibility might be optimistic.
Figure 8 shows the convergence time of each indicator in years. On average, it would take more than 10 years to reach the goals proposed in the NDP. That is, it would take two administrations to get there. One indicator in SDG 12 stands out as the most difficult to achieve: ethical behavior of firms—not surprisingly, a collateral issue associated with corrupt practices–with almost 25 years of convergence time. Overall, these results suggest that the NDP demands a multi-term strategy to be considered feasible.
Convergence time under fluid priorities.

6.4 Budget and policy coherence
Recall that, according to PPI’s theory, if the government truly wants to achieve the goals proposed in the NDP, it would establish the prospective priorities estimated in Figure 7. We also mentioned that, whether this is reflected in the government’s actions or not is a different question, one that we consider here. Take the budgetary data presented in Section 4.5, and assume that they reflect the policy priorities that the government intends to establish in the next 6 years.Footnote 24 If the budget proposed by the federal government would be coherent with the NDP, then it should resemble the prospective policy priorities. This is so because the prospective priorities are, effectively, a counterfactual of what the government would do under the NDP. Comparing this counterfactual to the fiscal data allows measuring the level of coherence of the budget through an index developed by Guerrero and Castañeda (Reference Guerrero and Castañeda2020).
Figure 9 shows the result of this exercise. The left panel presents the discrepancies between the budget and the priorities, both at the level of the SDGs (because the budgetary data are linked at an aggregate level, not at the indicator level). Let us concentrate on the right-most dot in the panel, which corresponds to SDG 13. The horizontal axis suggests that the government would establish an average allocation of more than 10% to SDG 13. However, the vertical axis shows that the approved budget for such purpose was less than 1%. Thus, the government is under-spending in climate action. Under- or over-expenditures are also called allocative inefficiencies and, together with technical inefficiencies, they are key to understand development (Izquierdo et al., Reference Izquierdo, Pessino and Vuletin2018). The more allocative inefficiencies we find in the plot, the more likely that the coherence index will suggest incoherence between the federal budget and the NDP.
Budget and policy coherence.

The coherence index behaves like a correlation coefficient: positive values indicate coherence, while negative values imply incoherence. An index with value 1 suggests full coherence, meaning that all the dots in the left panel would lie on the dotted line because both the budget and the prospective allocation are identical. The right panel shows the distribution of the coherence index (see Guerrero and Castañeda (Reference Guerrero and Castañeda2020) for details on the estimation procedure). Clearly, the budget is incoherent with the government’s aspirations (at least at the level of the SDGs). Nevertheless, the magnitudes of the indices are not too high, suggesting that moving to the positive side is feasible. Note that the coherence index is specific to the set of indicators, goals, growth factors, and spillover network. Therefore, an incoherent budget may not necessarily mean that the priorities are wrong, it may suggest, instead, that the goals are unrealistic. In any case, the usefulness of PPI becomes evident because it allows assessing both sides of the same coin.
6.5 Rigid policy priorities
Suppose that the budgetary data reflect, indeed, the policy priorities and that the government is not willing to change them throughout its administration. Here, we are in a situation of fiscal rigidities. For PPI, it means that the central authority (i.e., the Treasury) does not adapt its allocations and, instead, establishes a rigid allocation profile (in this case, the budget data). Then, the natural question that arises in this scenario is whether following the approved budget under strict discipline will make the NDP more or less feasible. We can assess this by comparing the convergence times under the budgetary data against the ones obtained from the prospective priorities. New sets of simulations need to be run for (a) taking the budgetary data as the given prioritiesFootnote 25 and, (b) using the prospective priorities obtained in Section 6.2 as the given ones. The reason why we cannot directly compare the convergence times obtained in Section 6.3 is because that exercise assumes fluid priorities while the adoption of the budget assumes rigid ones. Differences in rigidity induce discrepancies in convergence times, as shown by Castañeda and Guerrero (Reference Castañeda and Guerrero2019). Therefore, the correct way to measure delays or savings in this exercise is by having the same level of fiscal rigidity.
The steps to implement this exercise follow those discussed in Section 6, with one exception: the endogenous vector  $ P $ is imposed exogenously and remains fixed throughout the simulation. Since we need to perform two sets of simulations, one set fixes $ P $ according to the allocation profile estimated in Section 6.2, and the other set fixes the priorities according to the budgetary data. All other steps remain the same.
Figure 10 shows the difference in convergence time between adopting the federal budget and the prospective allocations. On average, adopting the approved budget would produce an average delay of nearly 2 years with respect to the adoption of the prospective priorities. In some cases, the delays can be of the order of 6 or 7 years. The indicator where the biggest delay takes place is cooperation in labor-employer relations, from SDG 8. We can also observe some savings, especially in the indicators related to SDG 7. Overall, this exercise shows how PPI can be combined with fiscal-SDG linked data, a promising research avenue as more and better public expenditure data become available.
Delays in reaching the development goals.

6.6 Accelerators
The last of our prospective analyses touches a topic that has become highly discussed in the SDG literature: accelerators. According to the UNDP’s SDG Accelerator and Bottleneck Assessment (ABA) tool (Garmer, Reference Garmer2017, p. 6), an accelerator is a “—development policy and/or program areas—that will accelerate progress across the SDGs and the national development goals, and the corresponding drivers that enable their progress”. Thus, the purpose of identifying accelerators is to prioritize them in order to trigger positive multiplicative effects across SDGs. In principle, this very notion appeals to the network of interdependencies. While the ABA tool takes a more qualitative approach, different research groups have emphasized the use of SDG networks to prioritize topics with a high degree of connectivity (Weitz et al., Reference Weitz, Carlsen, Nilsson and Skånberg2018). In this section, we (a) demonstrate that the approach of using networks to identify accelerators is not only naïve but may be outperformed by alternative heuristics and (b) provide a more comprehensive way to identify accelerators by combining PPI with heuristic optimization methods.
What does an accelerator mean in PPI? Under PPI, an accelerator cannot be just an indicator with a high degree of connectivity for the following reasons:
1. Only instrumental indicators can be accelerators because they are the only ones that can be intervened through public policy.
2. The network is not causal, so it is erroneous to assume that one can manipulate the indicators. Instead, one tries to improve them through policy interventions.
3. Given that there always is a budget constraint, when one increases the priority in one topic, it takes away resources from other policy issues. Thus, an accelerator cannot be considered in isolation from those topics that are losing resources; this cannot be accounted for when looking at network interlinkages exclusively.
4. An indicator with high connectivity may be highly inefficient, so allocating more resources without solving the associated public governance problems may result in ineffective policies.
5. Shifting priorities to a node may affect the incentive structure of policy-makers. For example, an agent may become inefficient because it receives more spillovers from the intervened policy issues.
6. Because the relationship between expenditure and development outcomes is nonlinear, the set of accelerators may change with the allocation of transformative resources.
Clearly, in the identification of accelerators, there is more to than meets the eye. Much of this complexity comes from the political economy underlying the policymaking process, and this is something that data, by itself, cannot reveal. Fortunately, the research program of PPI appeals to a generative approach to deal with such complexities, something that we exploit to shed new light on the identification of accelerators. Let us concentrate on the hypothetical case where the policy priorities are given by the budgetary data.
The literature from Political Science and Public Administration suggests that, most of the times, budgetary changes are small (Baumgartner and Jones, Reference Baumgartner and Jones1993; Jones et al., Reference Jones, Baumgartner and True1998). Under normal circumstances (e.g., without a crisis), a 10% change would be considered the upper bound of how large a priority change can be. For the sake of this example, let us assume that the government takes 10% of the budget assigned to each indicator and reallocates it to the accelerators. That is, we choose the accelerators ex-ante and give them the 10% of the budget in equal portions. Finally, we run PPI under full rigidity and obtain the convergence time. Then, the question is: which of the 91 instrumental indicators should be chosen as the accelerators?
6.6.1 Naïve results
Let us begin with the naïve approach, in which the accelerators should be those indicators whose total outgoing weights in the network are positive. That is, these are nodes with net positive conditional dependencies on other nodes; possibly because they have a high degree of positive outgoing links, but also because their positive outgoing edges outweigh their negative ones. We reallocate 10% of the budget to these indicators and run PPI. Then, we compute the difference in convergence speed with respect to the times obtained in Section 6.5 for the budget priorities. Figure 11 shows the result. Overall, the naïve approach identifies 54 accelerators, and generates an average saving of 1.29 months, with individual savings per indicator of up to 8 months. Note, however, how some accelerators generate zero or near-zero savings. This means that the political economy process prevents them from being effective accelerators, despite having net positive outgoing spillovers. From an economic point of view, supporting accelerators that do not improve convergence times is inefficient, unless their spillovers are big enough to outweigh the costs.
Accelerators identified through network connectivity.

6.6.2 PPI results
Given that the naïve approach to accelerators has limitations, how can we find the set of instrumental nodes that can best catalyze development by assigning them the 10% of the budget? A brute force strategy would be to simply enlist all the possible sets of accelerators, run PPI for each one, and select the best-performing set. The problem with this approach is that, given the high-dimensional nature of development, exploring all the possible sets becomes unfeasible very quickly, for example, in this particular study, the number of all possible accelerator sets is  $ {2}^{91} $ (that is, approximately a 2 followed by more than 25 zeros). In addition, the “fitness landscape” of this problem is often rough, so traditional optimization methods are bound to fail. Fortunately, heuristic optimization techniques have been designed to deal with this type of problems. In this application, we employ one that stems from Complexity Science: genetic algorithms (Holland, Reference Holland1975). A brief explanation of this algorithm is presented in Appendix I. The left panel in Figure 12 shows the results of our search for accelerators. The genetic algorithm returns a set with 34 accelerators, considerably less than in the naïve approach. In this set, not all the SDGs have accelerators, for example, SDGs 4–7 lack them. Overall, allocating the 10% of the budget to these indicators generates an average saving of 2.25 months, twice as much as the naïve accelerators. Note that all the accelerators lie above the dotted line, and that, in some cases, there are savings of more than 1 year.
Accelerators identified through policy priorities inference and heuristic optimization.

In the right panel, we present a Venn diagram showing the distribution of accelerators across the different types of indicators. Interestingly, 14 out of the 34 accelerators have negative net spillovers—the exact opposite intuition to the naïve approach. This demonstrates how neglecting the political economy process can produce misleading policy prescriptions. Clearly, the identification of accelerators demands a complexity perspective, which is the very essence of the 2030 Agenda. This exercise shows the versatility of PPI and how, when combined with other methods from Complexity Science, it can be used to tackle challenging problems. A more thorough study could explore other heuristic optimization methods, as well as diverse reallocation rules and levels of fiscal rigidity. Here, we have opened the path to explore these possibilities.
7 Discussion and Conclusions
Overall, PPI is a useful methodology for the planning of development and for the design of budgetary strategies as long as the underlying problem of a central authority is the allocation of resources in a multidimensional policy space. PPI can also be applied to the subnational (states, provinces, cities, for example) and the sectoral level (industry policymakers/regulators). Nevertheless, like any research framework, PPI comes with its own limitations; and it is important to mention them.
7.1 Limitations
First, like with any quantitative model, the quality of the data affects the quality of the outputs. Although, compared to the existing approaches, it can do more with less data, PPI will not fix a government’s data problems. More and better indicators will always be beneficial to any empirical exercise, as they will better capture interdependencies, structural factors, and features of behavioral heuristics.
Second, prospective estimations assume that the main structural issues (the growth factors) remain the same. Likewise, the interlinkages captured by the spillover network are also assumed to remain in place. For this reason, PPI should only be considered for short and midterm studies, even if sensitivity analyses are produced.
Third, although the outputs are obtained from a quantitative model, the inferences drawn from this version of PPI should be interpreted on a more qualitative basis. That is, this implementation is not designed to provide precise estimates on the level of an indicator after a number of years. Instead, it yields the approximate time that it would take to reach a goal, given that the structural factors and theories of change that produced the historical data remain in place. Likewise, priorities should not be interpreted as point estimates, but rather in ordinal terms of which policy issues should receive more or less priority. This, however, may be overcome by introducing granular expenditure data as an input to PPI.
Fourth, the inferences about policy priorities obtained from PPI can only be interpreted at the macro-level. That is, an allocation profile reflects opportunity areas where governments can destine more resources, not the specific policies that should be implemented to improve them. It is assumed that the same policies that have been deployed in the past remain in place. In order to assess micro-level issues, such as choosing better policies and other operative concerns, it is necessary to resort to other methodologies and expert knowledge on those particular topics. Thus, PPI intends to be complementary to the planning process, not a substitute for other approaches or human expertise.
7.2 Conclusions
The 2030 Agenda, through its acknowledgment of the complexity of development, poses significant challenges. Fortunately, Complexity Science and Computational Social Science have developed an alternative vision of socioeconomic phenomena, and innovative tools, to tackle these problems. This paper introduces a research program framed under this paradigm: Policy Priority Inference. PPI takes into account the complexities of the political economy underpinning the dynamics of development indicators, and considers important institutional factors that are key to the success or failure of policy interventions. We explain the methodology and present applications for the case of the Mexican federal government. In particular, we show how to assess the feasibility of development goals, the coherence of policy priorities, and the identification of development accelerators.
Overall, our applications illustrate that PPI is well equipped to deal with the complex challenges of the 2030 agenda, and they pave the way for an innovative framework for the analysis of development strategies. In this sense, our framework fills a gap not only in the academic literature, but also in the science-based methodologies that can be used to back the formulation of policy priorities in terms of budgetary allocations. Although, in this paper, we develop a specific computational model implemented with Mexican data, PPI should be thought of as a research program in which development is understood as a complex adaptive process involving political economy considerations, interdependencies within a large set of SDG indicators, and strategies for the allocation and use of public resources. This means that, as more and better data become available, computer hardware improves, and our knowledge about human behavior, institutions, and social interactions grows, better models can be developed within this program. Ultimately, the PPI program tries to provide a flexible and open scheme with which governments, NGOs, consultants, academics, and the civil society can work toward meeting the goals of this and future international development agendas.
Finally, it is important to emphasize that the implementation of PPI’s agent-computing models for guiding policymakers needs a close collaboration with government officials and technocrats. This is due to the fact that its proper implementation requires knowledge on the nature of the development goals, the criteria for the government’s adaptive heuristic, and the intricacies behind budgetary data. With respect to the latter, expert knowledge is key for the following reasons: (a) to determine which indicators can be defined as instrumental nodes (i.e., associated to specific government programs receiving public funds) or as collateral nodes (i.e., aggregate variables whose evolution is not directly linked to public spending), (b) to clarify in which programs the central authority (e.g., Ministry of Finance) has the flexibility to establish budget allocations for transformative development; and—in case granular budget data are used—(c) to match government programs and their funding, with the SDG indicators that are being directly affected.
Acknowledgments
The development of Policy Priority Inference has been an iterative process of discussions with academics and policymakers. Throughout this journey, we have been fortunate to meet supporters who made possible the development of the tool beyond the academic realm. We are grateful to The Alan Turing Institute for its financial support and for providing computational resources. We are also thankful to Helen Margetts and Cosmina Dorobantu from the Public Policy Program at the same institution, whose support has significantly contributed to reaching this state.
The adaptation of PPI to the context of the Sustainable Development Goals was partly developed during the project: Policy Priority Inference for Sustainable Development. We are grateful to the United Nations Development Program, Bureau for Latin America (UNDPLAC) and the UNDP-Mexico for sponsoring this initiative. More specifically, we would like to thank Luis Felipe López-Calva and Almudena Fernández from UNDPLAC for supporting the project; to Florian Chávez-Juárez, Georgina Trujillo, Lucy Hackett, Alejandro Blasco and Cristina Galíndez from the National Laboratory of Public Policy (LNPP, Mexico) for their support with data preparation and logistics; and to Annabelle Sulmont, Stephanus Visser and Maite García from the UNDP-Mexico for their involvement in the organization of the project and the workshops.
Finally, we are also grateful to all the participants from the numerous seminars, conferences, and workshops where PPI has been presented; in particular, the seminar series on PPI conducted at the UNDP in New York and the workshops at the National Laboratory of Public Policy in Mexico City.
The opinions and interpretations expressed in this paper reflect the authors’ viewpoint only.
Funding Statement
This work was supported by The Alan Turing Institute under the EPSRC grant EP/N510129/1 and by the ESRC grant ES/T005319/1. The adaptation of Policy Priority Inference to the Sustainable Development Goals was supported by the United Nations Development Program under the project: “Policy Priority Inference for Sustainable Development”.
Competing Interests
Competing Interest: Author O.G. and Author G.C. declare none.
Data Availability Statement
All the data used in this paper come from publicly available sources, all cited in the manuscript. The authors provide the relevant samples in the public repository github.com/oguerrer/PPI4SD.
Author Contributions
Conceptualization, O.G. & G.C.; Methodology, O.G. & G.C.; Formal Analysis, O.G. & G.C.; Data Curation, O.G. & G.C.; Writing Original Draft, O.G. & G.C., Writing Review and Editing, O.G. & G.C.; Supervision, O.G. & G.C.; Funding Acquisition, O.G. & G.C.
Supplementary Materials
To view supplementary material for this article, please visit http://dx.doi.org/10.1017/dap.2020.18.


 Open access


Comments
No Comments have been published for this article.