


Scholars of political economy conventionally characterize religion’s electoral influence as conservative, arguing that religiosity decreases electoral support for left-wing parties and undercuts redistribution. Some have argued that religion can substitute for the welfare state by providing a source of spiritual and material insurance or by serving as an alternative channel for redistribution through religious charities.Footnote 1 Others have emphasized the conservative orientation of religious economic and social moral teachings, which is thought to reduce demand for redistribution among religious voters and potentially lead them to support parties on the right.Footnote 2
Yet, some religious leaders have actively supported progressive economic positions that seek to mitigate inequality and advocate state-led redistribution. Such progressivism often stems from religious doctrines that profess a strong concern for the poor and a critical view of inequality.Footnote 3 U.S. Protestant leaders in the Southern Christian Leadership Conference formed the Poor People’s Campaign in the 1960s to demand economic reforms to address inequality throughout the country (see, e.g., Laurent Reference Laurent2019). In the mid-twentieth century, Catholic priests around the world promoted the causes of the poor from their pulpits and, at times, in the electoral arena.Footnote 4 This movement was particularly strong in Latin America, where progressive clergy often led opposition to military rule (Gill Reference Gill1998; Hagopian Reference Hagopian1996; Mainwaring Reference Mainwaring1986; Mainwaring and Wilde Reference Mainwaring and Wilde1989; Philpott Reference Philpott2007) and grassroots movements for economic redistribution, human rights, and ethnic rights for rural and indigenous populations (Scully Reference Scully1992; Trejo Reference Trejo2012; Wood Reference Wood2003; Yashar Reference Yashar1992; Reference Yashar2005). More recently, Pope Francis has repeatedly called on global leaders to redistribute wealth from the rich to the poor.Footnote 5
Although religious leaders play a central role in shaping the experience of parishioners in most religions, political economy theories of the electoral influence of religion have until now completely overlooked them. In this article, I argue that the ideological leanings of religious leaders shape religion’s electoral impact. Progressive religious leaders can help left-wing parties expand their base of electoral support and win national political office.Footnote 6 Such leaders can leverage their moral authority to influence parishioners’ beliefs and preferences about economic inequality and advocate state-led redistribution as a fair solution. They can also promote local organizations that support redistribution, such as labor unions. Left-wing parties can directly benefit from these activities, especially where the otherwise limited reach of traditional labor unions prevents them from connecting with and mobilizing poor voters.
I evaluate my argument in Brazil after the democratic transition in 1985. I study how Catholic bishops shaped the development and electoral success of the left-wing Workers’ Party (Partido dos Trabalhadores [PT]). While the limited scale of Brazil’s labor movement made it a very unlikely setting for the emergence of a left-wing party, the PT built an electoral coalition with country-wide support in the 1908s.
To examine how progressive religious leaders facilitated the PT’s surprising electoral success, I analyze a novel natural experiment in which the length of exposure to economically progressive bishops varies as-if randomly. After two decades of progressive Catholic leadership, the appointment of John Paul II (JPII) as Pope in 1978 brought about a conservative shift in the Vatican’s outlook. To curb progressives’ influence in Brazil, JPII sought to replace incumbent bishops with his preferred conservative candidates. However, institutional rules within the Church prevented him from doing so before these bishops reached the retirement age of 75. Since the timing of bishops’ 75th birthdays (and thus their replacement) varied across dioceses, this generated exogenous variation in how long progressive bishops remained in office.
I show that exposure to progressive bishops had important and lasting effects on the PT’s electoral success. I find that the party’s vote share increased significantly in localities that spent more years under a progressive bishop. In 1989, during Brazil’s first direct presidential election after its democratic transition, the party increased its vote share by 3 percentage points in districts that retained their progressive bishop until after 1985 compared to those in which bishops were replaced soon after the 1978 papal transition—a roughly 20% increase over the PT’s average vote share in that election. The positive effects of progressive bishop tenure are present throughout the period I study (1989–2002), indicating that their presence had a long-term impact on the PT’s electoral fortunes.
I draw on an array of novel empirical evidence to demonstrate how progressive Catholic clergy benefited the PT. Leveraging archival material, I first establish that progressive bishops made economic inequality a political issue and advocated redistributive economic policies to reduce disparities between the rich and poor. I also examine the ways in which replacing progressive bishops reshaped church dynamics at the local level. Evidence from an original, parish-level dataset indicates that their replacement significantly increased the turnover of local priests between 1965 and 1997. This turnover primarily targeted progressive priests, disrupting their ability to establish local ties and curtailing their political reach. Focusing on the PT, I further demonstrate—using a panel dataset of municipal-level party affiliation from 1980 to 2002—that the replacement of progressive bishops hindered the PT’s expansion across Brazilian municipalities. In the final empirical section, I show that progressive bishop leadership was most instrumental to the PT in areas with limited access to labor unions, where the availability of alternative external support was crucial for mobilizing the poor.
This article advances the literature in three ways. First, it contributes to scholarship on the rise of left-wing parties. Historical accounts of social democratic parties in Europe describe such parties as emerging through organizational ties to labor unions, which made it possible to form a mass party.Footnote 7 To the extent that the Catholic Church provided organizational resources to support electoral mobilization, prior work maintains that it generally favored right-wing parties in order to protect its role in welfare provision from a growing central state.Footnote 8 Yet, these accounts of party development do not travel well to the developing world, where the Catholic Church has a smaller role in welfare provision and labor unions are rarely able to sustain viable political parties due to their limited social and territorial reach. My research outlines an alternative path to left-wing party development in these settings, one in which the Catholic Church provides the organizational infrastructure that facilitates their rise.
Second, these findings shed light on the role of religious leaders in shaping religion’s electoral influence. At least since Durkheim and Weber, modern social science has focused on the social and political impacts of denominational differences, such as between Catholics and Protestants. Building on scholarship that highlights the coexistence of multiple interpretations within a shared religious doctrine, this article demonstrates how religious leaders’ beliefs about economic redistribution can shape their denomination’s political influence.Footnote 9 My focus on religious leaders adds to research that seeks to “unbundle” the various components of religion.Footnote 10 It highlights how leaders link religious ideas to political issues and shape the preferences and behaviors of their parishioners.
Finally, I advance the understanding of the Roman Catholic Church’s political influence by identifying the effects of bishop appointments—a key channel through which popes can impact domestic politics. While my focus is on how religious leaders have shaped the electoral success of left-wing parties in post-democratization Brazil, the research design I introduce can be applied to study the effects of papal appointments in other contexts. Indeed, several studies have extended this design to evaluate the impact of bishops in settings, such as Italy and Argentina.Footnote 11 Thus, this article offers both a methodological and a substantive contribution to the study of the Church’s political influence.
RELIGIOUS LEADERS IN ELECTORAL POLITICS
In most religious traditions, religious leaders exercise considerable influence over their communities. They play a central role in interpreting sacred texts and conveying these interpretations to their followers (Grzymala-Busse Reference Grzymala-Busse2012). Through their role in the production and distribution of religious resources, these leaders can also mobilize parishioners and shape collective action (Cammett and Luong Reference Cammett and Luong2014; Wickham Reference Wickham2002). Their authority can thus extend beyond the spiritual domain, affecting social, economic, and political outcomes.
Although few scholars have directly examined the impact of religious leaders on electoral politics, there is good reason to expect their influence to undercut support for left-wing parties. Prior research has shown, for example, that religious teachings are often interpreted to emphasize the virtues of hard work and personal responsibility. Such interpretations can promote the belief that inequality is a fair outcome of individual effort rather than the result of structural injustice (see, e.g., Benabou and Tirole Reference Benabou and Tirole2006; McClendon and Riedl Reference McClendon and Riedl2019; Weber Reference Weber1905). Alternatively, religious teachings may be understood to imply that redistribution should be the domain of religious organizations rather than the state.Footnote 12 When leaders promote these interpretations of religious doctrine, religious individuals may be less supportive of state-led redistribution and the left-wing parties that advocate for it.Footnote 13
Yet, religious leaders do not always oppose state-led redistribution. Many religious doctrines allow for interpretations that frame poverty as a moral concern and emphasize society’s collective responsibility to address it. For example, Jewish leaders have often portrayed inequality as a pressing social issue that warrants political engagement (Cox and Jones Reference Cox and Jones2012; Djupe and Sokhey Reference Djupe and Sokhey2003). Within Protestantism, leaders of the Social Gospel movement in the early twentieth century called for a reconstruction of the social order and advocated wide-ranging labor reforms, including the abolition of child labor, a shorter workweek, and higher wages (Evans Reference Evans2017).
Even within the same denomination, religious leaders often promote divergent views on economic redistribution. While this article focuses on variation within Catholicism, similar differences exist across other religious traditions, including Judaism (Sharkansky Reference Sharkansky1996) and Islam (Davis and Robinson Reference Davis and Robinson2006; Pepinsky and Welborne Reference Pepinsky and Welborne2011). A recent study of religious leaders in the United States, for instance, documents substantial variation in political views both across and within denominations (Malina and Hersh Reference Malina and Hersh2021).
I refer to religious leaders who oppose state-led redistribution as “conservatives.” These leaders do not believe there is a religious imperative to address poverty through state channels. I consider religious leaders who promote state-led redistribution to be “progressives.” Unlike their conservative counterparts, progressive leaders emphasize the unjust roots of poverty and inequality and perceive a moral responsibility to mitigate these ills through state-led economic redistribution.Footnote 14 This section develops an argument to explain the impact of these different types of religious leaders on the electoral prospects of left-wing parties.
Religious Leaders, Poor Voters, and the Electoral Prospects of the Left
While left-wing parties rely heavily on poor voters to win elections, the support of this constituency cannot be assumed. These voters may prioritize other policy dimensions—such as crime or social issues—that make it easier for other parties to compete for their support. Indeed, parties that oppose or downplay economic redistribution have frequently attracted support from poor voters by emphasizing noneconomic issues (De la O and Rodden Reference De la O. and Rodden2008; Frank Reference Frank2007; Romer Reference Romer1975). In addition, poor voters may be particularly responsive to clientelistic or other non-programmatic appeals. Such strategies have enabled parties with limited redistributive agendas to win over low-income constituencies (Chandra Reference Chandra2007; Dancygier Reference Dancygier2017; Stokes et al. Reference Stokes, Dunning, Nazareno and Brusco2013; Thachil Reference Thachil2014b).Footnote 15
Moreover, many of the organizations that left-wing parties traditionally relied on to capture poor voters’ support are in decline. Labor unions, for instance, have experienced a sharp drop in membership, particularly since the 1980s. Relying on labor unions to socialize and recruit poor voters is especially difficult in the developing world, where levels of industrialization are low and geographically concentrated and the informal economy dominates (Handlin and Collier Reference Handlin, Collier, Levitsky and Roberts2011; Auerbach et al. Reference Auerbach, LeBas, Post and Weitz-Shapiro2018; Feierherd Reference Feierherd2022). How can left-wing parties establish enduring ties with poor voters?
I argue that the presence of progressive or conservative religious leaders critically shapes left-wing parties’ ability to recruit the electoral support of the poor. Religious leaders are especially influential among poor voters, who often exhibit high levels of religiosity and active religious participation (Norris and Inglehart Reference Norris and Inglehart2011). When religious leaders are conservative, their redistributive preferences do not align with those of left-wing parties; they are thus unlikely to help the left mobilize the poor.
When religious leaders are progressive, in contrast, their influence over religious voters can help left-wing parties establish ties with poor voters. These leaders can aid left-wing parties by shaping parishioners’ preferences over redistribution. From their pulpits, they can portray poverty and inequality as morally unjust and as pressing social and political problems. They can likewise frame state-led redistribution as a legitimate and necessary response. Progressive religious leaders thus align poor voters’ policy preferences and priorities with those of left-wing parties, making poor voters more likely to support these parties.
Progressive religious leaders can also play a key role in strengthening the class-based associations—such as labor unions—that left-wing parties often depend on to mobilize poor voters. They can provide critical resources—such as meeting space, communication channels, and access to parishioners—as well as implicit or explicit endorsements that increase the territorial reach and membership of these organizations.Footnote 16 In doing so, progressive leaders enhance left-wing parties’ capacity to organize and mobilize low-income constituencies, particularly in regions where class-based organizations were historically weaker.
The argument developed above highlights the pivotal role that progressive religious leaders can play in strengthening the electoral prospects of left-wing parties. By shaping their parishioners’ preferences, these leaders increase support for state-led redistribution and elevate the salience of economic inequality as a political concern. At the same time, they provide crucial organizational support to the class-based associations that left-wing parties often rely on to mobilize poor voters. Their influence is especially critical in contexts where these associations are weak or otherwise absent. By reinforcing both the ideological foundations and organizational capacity of left-wing parties, progressive religious leaders help expand these parties’ appeal among low-income constituencies and strengthen their prospects of winning national political office.
BACKGROUND
Progressive Catholicism in Brazil
The Catholic Church’s traditional response to inequality focused on the virtues of poverty, which it conceptualized as a state of grace: the poor are blessed in the eyes of the Church and their acceptance of material destitution will ultimately lead to their salvation (Kahl Reference Kahl2005). Growing labor conflict and rising economic inequality following European industrialization inspired an alternative strain of Catholicism in Brazil, which I refer to in this article as “progressive.”Footnote 17 While progressive Catholicism embraced capitalism, it acknowledged the state’s role in reducing economic equality and argued that moral considerations should temper the free operation of market forces. Rerum Novarum, an 1891 encyclical issued by Pope Leo XIII, condemned unfettered capitalism and advocated the organization of labor unions and the right to collective bargaining. In the 1960s, Pope John XXIII further expanded official Church doctrine on social issues by publishing two encyclicals that supported strengthening workers’ rights and increasing the power of labor unions; they also called on the Catholic Church to address the suffering and injustice of contemporary society.Footnote 18
The opening of the Second Vatican Council—a series of meetings of bishops and other Catholic clergy from around the world between 1962 and 1965—was a watershed moment in the development of progressivism within the Church. The documents that emerged from the Council emphasized social injustice and economic inequality, yet went significantly further than before in outlining the causes of these problems and identifying solutions. For example, the pastoral constitutions advocated expanding the role of unions and other worker organizations to level the playing field between capital and labor (Horn Reference Horn2015). In discussing rural land inequality, they went so far as to promote agrarian reform, arguing that “insufficiently cultivated estates should be distributed to those who can make these lands fruitful” (Paul VI Reference Paul1965, section 71).
While not all of the clergy championed this progressive strain of Catholicism, a large share of priests and bishops in Brazil embraced these ideas. Many Brazilian priests had long promoted the economic development of the poor, and Vatican II further strengthened their commitment to this theme (Lowy Reference Lowy2000; Mainwaring Reference Mainwaring1986). The country’s bishops played a key role in the 1968 Conference of Latin American Bishops, which further cultivated this strain of progressive Catholicism under labels, such as “liberation theology” and the “preferential option for the poor” (Adriance Reference Adriance1985; Bruneau Reference Bruneau1974; Mainwaring and Wilde Reference Mainwaring and Wilde1989).
Progressive Catholic leaders in Brazil viewed reducing economic inequality—often through political channels—as a central concern of the Church. They issued several documents and official statements that called for major socioeconomic reforms and criticized the “social imbalances produced by… economic liberalism” (Mainwaring Reference Mainwaring1986, 123–4).Footnote 19 At the local level, these progressive clergy members educated parishioners about the economic and political situation and served as a nexus between religious and secular organizations (Keck Reference Keck1995). They supported, and at times spearheaded, the formation of labor unions to improve workers’ living and working conditions, particularly in rural communities. Their role in framing social injustice and economic unfairness in terms of religious ideas resonated with the prevailing beliefs in local communities and promoted the poor’s social and economic engagement (Houtzager Reference Houtzager2001). Though generally hesitant to formally endorse specific political parties and/or candidates, progressive clergy members could shape parishioners’ policy priorities and the organizational resources available to left-wing parties at the time through these indirect channels.Footnote 20
The Rise of the Workers’ Party
The PT emerged out of the country’s labor movement during the country’s gradual transition to democracy in the 1980s. It espoused a redistributive economic platform that prioritized the concerns of organized workers (Hunter Reference Hunter2010; Keck Reference Keck1995; Reference Keck2010; Samuels Reference Samuels2004). While the party moved away from its initial socialist agenda, it remained economically progressive and never abandoned its emphasis on redistribution (Hunter Reference Hunter2007; Reference Hunter2010; Samuels Reference Samuels2004).
Over time, the PT sought to expand its party base and grow its electoral support. In 1982, it obtained only 8 of 479 seats in the Chamber of Deputies and no seats in the Senate. Since organized workers comprised only a small share of the Brazilian electorate, the PT struggled to expand its presence beyond urban centers (as the map of the party’s vote share in the 1989 presidential election illustrates in Figure 1). It therefore sought to leverage civil society organizations to build mass partisanship (Samuels and Zucco Reference Samuels and Zucco2015). In exploring the PT’s rise, numerous scholars have noted how the support of progressive Catholic organizations—which had a presence throughout the country and deep roots in Brazilian society—played a critical role in expanding support for the party (de Barros Reference de Barros2022; Keck Reference Keck1995; Mainwaring and Wilde Reference Mainwaring and Wilde1989; Mainwaring Reference Mainwaring1986; Meneguello Reference Meneguello1989).
Territorial Expansion of the PT, 1989–2002
Note: The figure illustrates the growth in the PT’s vote share in Brazil’s first four direct presidential elections after the democratic transition, 1989–2002. Darker shades indicate higher vote shares. The black lines denote state borders.

THE 1978 PAPAL TRANSITION AS A NATURAL EXPERIMENT
Did progressive Catholic leaders increase electoral support for the left in Brazil? Answering this question presents a key empirical challenge: it is generally difficult to systematically assess the ideological inclinations of individual clergy members. To overcome this difficulty, I focus on bishops, who exercise ultimate authority within their diocese: they control religious policy, shape the content of Catholic teachings, control the placement of priests, and are responsible for governing the faithful (Code of Canon Law 1983, Can. 381–402).Footnote 21
I assess bishops’ ideological inclinations based on which pope oversaw their appointment to a bishopric. Popes enjoy complete discretion to select bishops and tend to appoint individuals who share their ideological sympathies. Previous studies of the Catholic Church in Latin America have leveraged this selection process to measure bishops’ preferences. Gill (Reference Gill1998), for example, gauges their receptivity to reforms adopted in Vatican II by arguing that bishops appointed during the tenure of the Church’s two most progressive popes—John XXIII and Paul VI—would be more open to implement reforms than those appointed under more conservative pontiffs. Closer to the focus of this article, Hale (Reference Hale2015) measures religious conservatism in Mexico based on whether a bishop was selected after the appointment of the conservative JPII in 1978, when the Vatican systematically replaced retiring bishops with individuals who adhered to an orthodox and conservative social stance.
Building on this work, I consider bishops who were in office prior to Pope JPII’s appointment in 1978 to be progressive and those appointed under JPII to be conservative. While the progressive bishops promoted political action to address economic inequality, the bishops that JPII selected to replace them were less supportive of redistribution through state channels. The appointment of conservative bishops was a central pillar of JPII’s broader effort to diminish the influence of progressives within the Church.Footnote 22 He used his appointments strategically to empower the conservative faction of the Church in Brazil.Footnote 23 Scholars and journalists studying the Catholic Church in Latin America quickly recognized this strategy in Brazil. For instance, Lernoux (Reference Lernoux1989) and Betances (Reference Betances2007) highlighted JPII’s concerted efforts to curb progressive influence through the appointment of conservative bishops. Lowy (Reference Lowy2000, 216) further contended that these new bishops were selected “to substitute bishops that used to support pastoral activities committed to social change and who died or retired.” In 1988, the New York Times reported that the Pope was “using his authority to name new cardinals and bishops as a way of reasserting Vatican control” through “clergymen who unquestioningly accept Rome’s authority and share the Pope’s interpretation of church doctrine” (Riding Reference Riding1988).
The duration of exposure to progressive bishops varied considerably across Brazilian dioceses. Progressive bishop turnovers spanned more than three decades, resulting in substantial differences in how long each diocese was led by a progressive bishop before being replaced by a JPII appointee. The longer these bishops remained in office, the more time the left had to benefit from their presence. However, directly comparing dioceses based on the observed length of exposure to a progressive bishop may produce biased estimates—such as if JPII systematically prioritized replacing bishops in larger, more urban dioceses, where left-wing parties often hold an electoral advantage. In the next section, I outline the empirical strategy used to address this inferential challenge.
Empirical Strategy
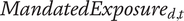
To estimate the effects of the length of exposure to progressive bishops, I exploit exogenous variation in the timing of progressive bishops’ retirement. JPII’s efforts to replace Brazil’s progressive bishops with conservatives were constrained by the fact that bishops have stable tenure in office until their death or retirement at the age of 75, at which time they were “earnestly requested of their own free will to tender their resignation from office” (Paul VI Reference Paul1966).Footnote 24 As a result, the timing of progressive bishops’ 75th birthday or death provides as-if random variation in the number of years until JPII was able to replace them. Panel (a) of Figure 2 illustrates the bivariate relationship between the year a progressive bishop reached the mandated retirement age and the year he was replaced. While a small number of bishops left office early (those falling below the 45-degree line), most remained in office until their death or retirement.Footnote 25 Overall, the figure highlights how the mandated retirement rule constrained JPII’s ability to replace bishops at will, as reflected in the strong correlation (0.62) between the two variables.
First Stage: Mandated and Observed Length of Exposure to a Progressive Bishop
Note: The figure examines the strength of the first-stage relationship between the year of mandated retirement and the observed length of exposure to a progressive bishop. Panel (a) shows a scatterplot of the raw variables—the year of mandated replacement and the year of the first JPII appointment for each diocese. The solid line marks the regression line, and the dashed line illustrates perfect compliance. Panel (b) reports the main coefficient from the first-stage regression for each year between 1979 and 2015. Panel (c) reports the corresponding F-statistic for each year. In Panels (b) and (c), estimates for the years that are employed in the main analysis are highlighted in black.

I rely on the as-if random variation in the number of years until progressives’ mandated retirement to identify the causal effects of the length of dioceses’ exposure to progressive bishops. I first estimate intention-to-treat effects using the following cross-section, reduced-form specification:
 $$ \begin{array}{rl}{Y}_{i,d,s,t}={\alpha}_0+{\alpha}_1{\mathrm{Mandated}\ \mathrm{Exposure}}_{d,t}+{\delta}_s+{\epsilon}_{i,d,s,t,}& \end{array} $$
where $ {Y}_{i,d,s,t} $
is the outcome of interest for municipality i located in diocese d in state s measured in year t. In the main analysis, the outcome of interest is the presidential vote share for the PT.Footnote
26 For diocese d in year t, the value of
$ {Y}_{i,d,s,t} $
is the outcome of interest for municipality i located in diocese d in state s measured in year t. In the main analysis, the outcome of interest is the presidential vote share for the PT.Footnote
26 For diocese d in year t, the value of $ MandatedExposur{e}_{d,t} $
is determined by
$ MandatedExposur{e}_{d,t} $
is determined by $ {r}_d $
, the year in which the last pre-JPII bishop in diocese d—the bishop in office at the time of JPII’s appointment—either passed away or reached the mandatory retirement age of 75, whichever came first.Footnote
27
$ {r}_d $
, the year in which the last pre-JPII bishop in diocese d—the bishop in office at the time of JPII’s appointment—either passed away or reached the mandatory retirement age of 75, whichever came first.Footnote
27
For outcomes measured before a diocese’s pre-JPII bishop’s death or retirement, MandatedExposure d,t is given by t − 1978. For outcomes measured after his death or retirement, it is calculated as r d − 1978, such that:
 $$ \begin{array}{rl}{\mathrm{Mandated}\ \mathrm{Exposure}}_{d,t}=\left\{\begin{array}{ll}t\hskip0.3em -\hskip0.3em 1978,\hskip1em \qquad & \mathrm{if}\hskip0.3em t<{r}_d,\qquad \\ {}{r}_d\hskip0.3em -\hskip0.3em 1978,\hskip1em \qquad & \mathrm{if}\hskip0.3em t\ge {r}_d.\qquad \end{array}\right.& \end{array} $$
Figure 3 depicts the geographic distribution of $ MandatedExposur{e}_{d,t} $
at the time of each presidential election in the analysis. Finally,
$ MandatedExposur{e}_{d,t} $
at the time of each presidential election in the analysis. Finally, $ {\delta}_s $
are state-level fixed effects, which account for state-level variation in PT presence and partisan competition following democratization. Standard errors are clustered at the diocese level (d), which is the level of the treatment assignment. The higher the value of
$ {\delta}_s $
are state-level fixed effects, which account for state-level variation in PT presence and partisan competition following democratization. Standard errors are clustered at the diocese level (d), which is the level of the treatment assignment. The higher the value of $ MandatedExposur{e}_{d,t} $
, the longer the diocese was mandated to be overseen by a progressive bishop. Hence, I expect to find
$ MandatedExposur{e}_{d,t} $
, the longer the diocese was mandated to be overseen by a progressive bishop. Hence, I expect to find $ {\alpha}_1>0 $
when the dependent variable is a measure of PT electoral returns.
$ {\alpha}_1>0 $
when the dependent variable is a measure of PT electoral returns.
Mandated Exposure to Progressive Bishops, 1989–2002
Note: The figure shows the values of mandated exposure for the year of each presidential election included in the analysis. Darker shades indicate longer exposure to a progressive bishop. Archdioceses—which are excluded from the main analysis—are shaded in black. The black lines denote state borders.

I then use an instrumental variable (IV) approach in which the number of years until a progressive bishop’s mandated retirement serves as an instrument for the length of his tenure. To measure how exposure to a progressive bishop affects PT outcomes, I estimate the following two-stage least-squares model:
 $$ \begin{array}{rl}{Y}_{i,d,s,t}={\beta}_0+{\beta}_1\hat{{\mathrm{Exposure}}_{d,t}}+{\delta}_s+{\epsilon}_{i,d,s,t,}& \end{array} $$
where all terms remain as in Equation 1 except for the independent variable, $ \hat{{\mathrm{Exposure}}_{d,t}} $
, which indicates the predicted values for diocese d in year t from the first-stage regression of
$ \hat{{\mathrm{Exposure}}_{d,t}} $
, which indicates the predicted values for diocese d in year t from the first-stage regression of $ {\mathrm{Exposure}}_{d,t} $
on
$ {\mathrm{Exposure}}_{d,t} $
on $ {\mathrm{Mandated}\ \mathrm{Exposure}}_{d,t}. $ $ {\mathrm{Exposure}}_{d,t} $
measures the number of years a diocese was led by a progressive bishop. Its calculation follows that of
$ {\mathrm{Exposure}}_{d,t} $
measures the number of years a diocese was led by a progressive bishop. Its calculation follows that of $ {\mathrm{Mandated}\ \mathrm{Exposure}}_{d,t} $
summarized in Equation 2, but uses
$ {\mathrm{Mandated}\ \mathrm{Exposure}}_{d,t} $
summarized in Equation 2, but uses $ {e}_d $
—the year the first JPII bishop was appointed to diocese d—in place of
$ {e}_d $
—the year the first JPII bishop was appointed to diocese d—in place of $ {r}_d $
.
$ {r}_d $
.
The IV strategy requires a strong first-stage relationship between the observed length of exposure to progressive bishops and the instrument. Panels (b) and (c) of Figure 2 report the estimated coefficient and F-statistic, respectively, from the cross-section first-stage regressions of $ {\mathrm{Exposure}}_{d,t} $
on
$ {\mathrm{Exposure}}_{d,t} $
on $ {\mathrm{Mandated}\ \mathrm{Exposure}}_{d,t} $
for each year between 1978 and 2015. The results provide evidence that the relationship between these two variables is strong: by 1982, the estimate of the first-stage regression in Panel (b) is 0.23 and remains above 0.6 starting in 1988. The F-statistics associated with these regressions are between 110 and 230 during the 1987–2004 period.
$ {\mathrm{Mandated}\ \mathrm{Exposure}}_{d,t} $
for each year between 1978 and 2015. The results provide evidence that the relationship between these two variables is strong: by 1982, the estimate of the first-stage regression in Panel (b) is 0.23 and remains above 0.6 starting in 1988. The F-statistics associated with these regressions are between 110 and 230 during the 1987–2004 period.
Sample
The main study group consists of all municipalities contained within the 189 dioceses that existed in Brazil at the time of JPII’s appointment. In addition to these dioceses, there were 32 archdioceses. Due to their higher stature, popes often appoint older bishops to these districts than for regular dioceses. As a result, archdioceses may be more likely to have experienced progressive bishops for a shorter period of time. As I show in Figure B3 in the Supplementary Material, this was the case in Brazil at the time of the 1978 transition. Because they are typically wealthier and more urban, including these archdioceses could introduce bias in the cross-sectional analysis.Footnote 28
Identifying Assumptions
The validity of the IV design rests on two further identifying assumptions. The first is that the length of mandated exposure to a progressive bishop is as good as randomly assigned—that is, it is exogenous to underlying factors that might affect the PT’s electoral fortunes. This is a valid assumption for three reasons. First, the timing of progressive bishops’ retirement is strongly related to their age and hence determined prior to the papal transition of 1978. Second, the papal transition itself was unexpected and was unrelated to the religious and political dynamics in Brazil. Third, prior to the death of Paul VI, the ideology of his would-be successor was unknown. The combination of these features makes it unlikely that the length of mandated exposure to progressive bishops is correlated with dioceses’ potential outcomes. Empirical analyses reported in the Supplementary Material further support the claim that the length of mandated exposure to progressives is uncorrelated with many predetermined diocesan and municipal characteristics. I first regress the year of progressives’ mandated retirement on a host of pretreatment covariates, including measures of Catholic institutional organization, religious competition, population, and electoral outcomes for the 1972 and 1976 elections held under the dictatorship (Table B1 in the Supplementary Material). I also estimate the main models, which study the effect of mandated exposure, using a key placebo outcome—vote share for the opposition to the dictatorship’s party in the 1976 elections (Table B2 in the Supplementary Material). These tests provide support for the assumption that the length of mandated exposure to a progressive bishop is unrelated to other factors that may affect electoral outcomes.
The second identifying assumption in the design is the exclusion restriction, which requires the instrument (the number of years of mandated exposure to a progressive bishop) to influence the outcomes of interest only through the observed length of exposure to a progressive bishop. A potential violation of this assumption stems from the fact that progressive bishops differed from those appointed by JPII not only in terms of their ideology but also in terms of their age and experience—JPII bishops were younger and less experienced than their predecessors. A second potential violation of the exclusion restriction is that dioceses that retained their progressive bishops not only have a longer exposure to these bishops, but also have not experienced a bishop turnover that could shape the Church’s ability to influence the PT’s electoral performance (i.e., a “bundled treatment”). I address these concerns in the “Progressive Bishops and the PT’s Electoral Success” section and provide evidence that bishops’ ideological differences drive the main results.
Data
I compiled data on the names, appointment dates, vacancy dates, and reasons for vacancy of all bishops serving between 1978 and 2015 from the Catholic Hierarchy website (Cheney Reference Cheney2020). Diocesan characteristics for 1978 were digitized from the Catholic Church’s Annuario Pontificio (Santa Sede 1978). To address changes in municipal and diocesan boundaries over time, I constructed a crosswalk for 1970–2002 linking municipalities and dioceses using data on the evolution of Brazilian municipalities from the Brazilian Institute of Geography and Statistics (IBGE 2011) and municipality–diocese mappings from the Brazilian Catholic Yearbooks, 1977–97 (CERIS 1965; 1970; 1977; 1985; 1989; 1993; 1997).Footnote 29 The main outcome—municipal vote share in the 1989–2002 presidential elections—comes from IPEA (IPEA 2020). Sources for additional outcomes and variables are introduced as they become relevant and summarized in Section A of the Supplementary Material. All data used in this article are available at Tuñón (Reference Tuñón2026).
PROGRESSIVE BISHOPS AND THE PT’S ELECTORAL SUCCESS
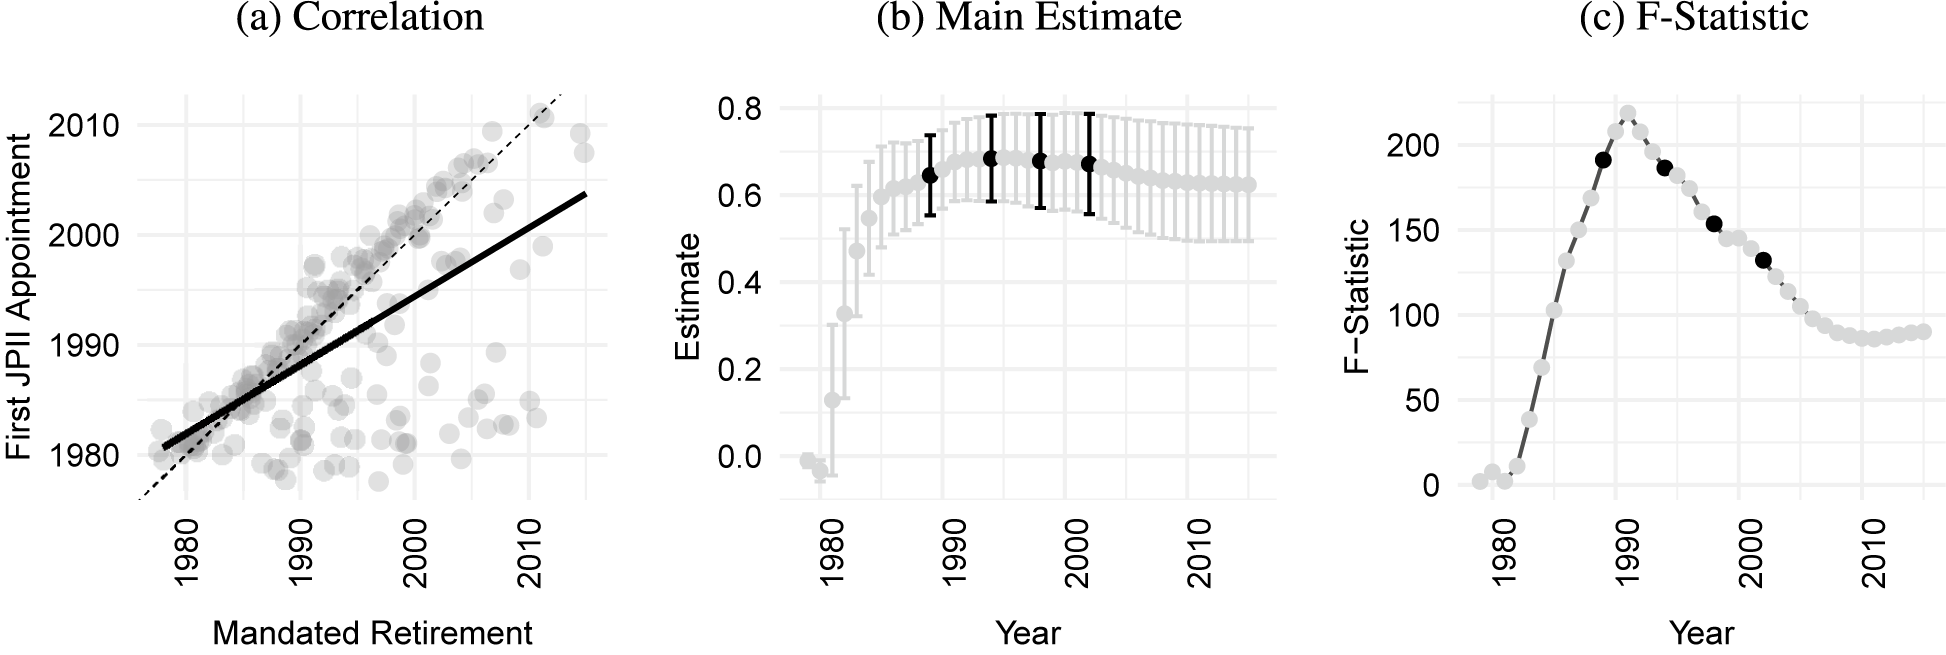
In this section, I examine the relationship between the length of exposure to progressive bishops and electoral support for the PT. The main outcome of interest is the PT’s presidential vote share from 1989 (the first direct presidential election after Brazil’s dictatorship) to 2002 (the first election in which the party won the presidency). The results are presented in Table 1. Panel A displays the results of the IV estimation and Panel B reports the intention-to-treat effects from the reduced-form analysis. The IV and reduced-form estimates both display a strong, statistically significant, and positive effect of the length of exposure to a progressive bishop on the PT’s vote share for all four presidential elections. A 1-year increase in exposure to a progressive bishop increases the PT’s vote share by 0.57 percentage points in 1989, roughly 0.4 percentage points in the 1994 and 1998 elections, and 0.23 percentage points in 2002.
Effects of the Length of Exposure to Progressive Bishops on the PT’s Presidential Vote Share

Note: Standard errors clustered at the 1978 diocese level in parentheses. In all models, the unit of analysis is the municipality. All specifications are estimated using ordinary least squares (ITT) and 2SLS (CACE) and include state fixed effects.+ $ p< $
0.1, *
$ p< $
0.1, * $ p< $
0.05, and **
$ p< $
0.05, and ** $ p< $
0.01.
$ p< $
0.01.
These are large effects. Consider the following conservative calculation based on the smallest estimate of the treatment effect (a 0.23 treatment effect per additional year of exposure). Compared to a diocese that lost its progressive bishop by 1980, the predicted overall increase in support for the PT in a diocese that retained its bishop until 2000—and thus had 20 additional years of exposure to a progressive bishop—is 4.6 percentage points. That translates to more than a 10% increase in the PT’s mean vote share in the 2002 election, which was 42.15.
These findings are robust to several alternative specifications. My estimation strategy, in which the municipality is the unit of analysis, accounts for the fact that the treatment is assigned to each diocese by clustering standard errors at the diocese level. In Table C1 in the Supplementary Material, I demonstrate that the results are robust to taking a more conservative, design-based approach that employs the diocese as the unit of analysis.Footnote 30 I also report additional results that demonstrate that the results are robust to including archdioceses in the analysis (Table C2 in the Supplementary Material) and to considering the PT’s vote share in congressional rather than presidential elections as the outcome (Table C3 in the Supplementary Material).
One concern that might arise when interpreting these results relates to the bundled nature of the treatment. Progressive bishops are, by design, older and more experienced on average than those appointed by JPII and hence may be better connected to the priests and parishioners in their dioceses. If these attributes increased a bishop’s ability to shape the political behavior of voters in his diocese, the observed results could reflect these differences rather than different ideological leanings between progressives and their JPII replacements. To evaluate this possibility, I run a placebo treatment test in which, for each election, I replace the treatment variable with the age of the sitting bishop at the time of the election. The age of the progressive bishop and the length of exposure are highly correlated and hence, without further changes, this test would not be very informative. To address this, I restrict the sample to the subset of dioceses in which the progressive bishop had not been mandated to retire by the election year. This ensures the test considers dioceses with identical values of the instrument at the time of the relevant election.Footnote 31 Among those dioceses, it is possible to estimate the effect of age on the vote share of the PT. I report the results of this analysis in Panel A of Table C4 in the Supplementary Material, which shows that older bishops do not increase the PT’s vote share. Panel B—which reports results from the same exercise when using bishops’ experience as the placebo treatment—similarly indicates that the PT did not benefit electorally from the presence of more experienced bishops. This analysis provides suggestive evidence that age and experience are not confounding the relationship between length of exposure to a progressive bishop and support for the PT.
An additional issue pertaining to the bundled nature of the treatment is that replacing progressive bishops with conservatives also implies a turnover in diocesan leadership. If disruptions related to bishop turnover affected new bishops’ ability to influence their dioceses, one might be concerned that the observed results reflect this effect. I evaluate this possibility in two ways. I first restrict the sample to the set of dioceses in which bishops’ mandated retirement occurred prior to the relevant election. Since all dioceses in this group had experienced turnover and differ only in their length of exposure, any observed effect among these dioceses is not confounded by turnover. Table C5 in the Supplementary Material shows that the main estimates remain largely consistent when the analysis is limited to this subset. Second, I present evidence from an alternative, reduced-form specification that relaxes the linearity assumption in the main analysis by recoding the instrument into a set of binary variables that estimate the effect of each additional electoral cycle in which a progressive bishop was mandated to remain in office. If the effects in Table 1 are independent of turnover, this alternative analysis should reveal effects that increase with each additional electoral cycle. Conversely, if the main effects result from disruptions caused by turnover, this complementary analysis would yield treatment effects concentrated in the first electoral cycle after turnover. Consistent with the former alternative, the results reported in Table C6 in the Supplementary Material increase with the number of electoral cycles that the bishop was mandated to remain in office. Moreover, the magnitude of the estimated effects is consistent with that of the coefficients from the linear specification. Overall, these additional results provide reassuring evidence that the observed effects are not confounded by turnover.
A related issue concerns bishops’ classification as either progressive or conservative. My coding strategy assumes all pre-JPII bishops were equally progressive, even though their progressivism may have varied. This is a conservative assumption; the presence of “less progressive” pre-JPII bishops would bias against observing a positive effect of exposure to pre-JPII bishops on support for the PT. Nevertheless, in the Supplementary Material, I demonstrate that the results are not driven by this assumption. In Table C7 in the Supplementary Material, I first establish that the results are robust to including only dioceses with pre-JPII bishops appointed by progressive popes (John XXIII and Paul VI). I then demonstrate that the results hold when removing from the analysis pre-JPII bishops who were classified as conservative by the Brazilian intelligence service.Footnote 32 I also assess potential variation in the conservatism of JPII-appointed bishops. In Table C8 in the Supplementary Material, I demonstrate that the results remain robust even when refining the definition of JPII appointments used to estimate Equation 3 to include only those he elevated to bishop—that is, excluding the small number of cases where he transferred existing bishops to a new diocese.
Overall, the findings presented above provide strong evidence that exposure to progressive bishops directly increased the PT’s electoral success. In many respects, the PT was the most natural beneficiary of progressive bishops’ activities: it was one of only two left-wing parties active during Brazil’s democratic transition, the only left-leaning party to field a presidential candidate in every election following democratization, and consistently among the two most ideologically left-wing parties in the country.Footnote
33 The other major left-wing party running for office in Brazil during this early period—the Partido Democrático Trabalhista (PDT)—also experienced greater electoral support in places where progressive bishops had longer tenures (Table D1 in the Supplementary Material), though the positive effects are only significant for one of the two elections in which it ran ( $ p<0.1 $
).Footnote
34 The effects observed for the PT and PDT do not appear to extend to the Partido Popular Socialista (PPS) or the Partido Socialista Brasileiro, two left parties that formed later and supported the PT presidential ticket before running their own candidates in 1998 and 2002, respectively. Thus, while these effects initially extended beyond the PT to other left-wing parties, the findings suggest a degree of path dependence as voters developed lasting attachments to specific parties.
$ p<0.1 $
).Footnote
34 The effects observed for the PT and PDT do not appear to extend to the Partido Popular Socialista (PPS) or the Partido Socialista Brasileiro, two left parties that formed later and supported the PT presidential ticket before running their own candidates in 1998 and 2002, respectively. Thus, while these effects initially extended beyond the PT to other left-wing parties, the findings suggest a degree of path dependence as voters developed lasting attachments to specific parties.
HOW PROGRESSIVE BISHOPS SUPPORTED THE LEFT AND JPII BISHOPS STYMIED PROGRESSIVE ACTIVITIES
The previous section demonstrated that places that were exposed to progressive bishops for a longer period experienced an increase in support for the PT. How did these progressives shape the party’s electoral fortunes? Progressive bishops, along with the progressive priests leading the parishes in their dioceses, underscored the importance of economic inequality as a political issue and the virtues of state-led redistribution in pastoral outreach to parishioners in their dioceses. They also encouraged the development of local organizational networks related to these issues.
Brazil’s progressive clergy promoted class consciousness among their parishioners and emphasized taking political action to address economic inequality. One prominent channel through which these ideas were expressed was through the publication of educational pamphlets to inform parishioners of the structural causes of economic inequality and poverty and to encourage political action to address these issues.Footnote 35 As one pamphlet, issued in the state of São Paulo, described: “The living and working conditions of the great majority of the exploited and marginalized population can only be transformed if the popular classes are capable of influencing the centers of decisions and power” (originally cited in Mainwaring Reference Mainwaring1987, 21). A pamphlet from the archdiocese of Vitória stated, “There is no common good where people are marginalized,” and included a quote from the papal encyclical Populorum Progressio, written by progressive Pope Paul VI (Reference Paul1967, section 33): “It is illicit to increase the wealth of the rich and the power of the strong by solidifying the misery of the poor and increasing the slavery of the oppressed.” Local priests expressed similar themes in their sermons, ceremonies, and other printed materials (see, e.g., Mainwaring Reference Mainwaring1986, 107). Through these activities, they framed economic inequality as morally unjust and encouraged the pious to combat it through political channels.Footnote 36
Progressive clergy likewise facilitated the growth of, and linkages between, local organizations committed to combating economic inequality, such as labor unions. For example, the Pastoral Land Commission—an organization of bishops whose mission was to address the roots of rural poverty and economic inequality—encouraged peasants to create rural unions to protect their interests from landowners (Mainwaring Reference Mainwaring1986; Reference Mainwaring1987). Evidence from a set of government reports documenting bishop activism around land conflict in the late 1980s further illustrates progressive clergy members’ efforts to ameliorate economic inequality. The reports were roughly twice as likely to identify progressive vs. conservative bishops as participating in organizations that promoted land and social activism (see Figure D1 in the Supplementary Material).Footnote 37 For example, the bishops cited in the 1987 report are described as actively raising awareness among rural workers about their land rights and encouraging them to join “sociopolitical-union organizations to challenge capitalist domination and secure their rights” (SNI 1987, 1).
Progressive priests played a crucial role in advancing the efforts of progressive bishops, acting as a bridge between grassroots organizations and local parishioners. In Rio Grande do Sul, for example, Father Guido Taffarel served on the planning committee for the rural workers’ union in Tenente Portela, the municipality where his parish was located. Other priests took an even more direct role, helping to establish local unions and offering church spaces for meetings and organizing efforts (see, e.g., SNI 1974). Across Brazil, progressive clergy were widely regarded as “an important agent” in fostering rural unions (Bruneau Reference Bruneau1974, 89).
This influence did not go unnoticed. Once appointed, JPII bishops moved quickly to curb the reach of progressive priests, using their authority over priest assignments as a means of control.Footnote 38 Bishops have the power to reassign clergy to remote or less desirable parishes, shift them into administrative roles that minimized their direct contact with parishioners, or even remove them from the diocese entirely. Even without direct action, the looming possibility of reassignment itself could serve as a powerful deterrent, discouraging priests from engaging in activities deemed politically or ideologically problematic by their bishop.
To document that JPII bishops engaged in such strategic transfers, I assembled an original parish–yearbook panel dataset from the seven Brazilian Catholic Yearbooks published between 1965 and 1997 (CERIS 1965; 1970; 1977; 1985; 1989; 1993; 1997).Footnote 39 The dataset records the priest heading each parish at the time of publication, yielding nearly 46,000 parish–yearbook observations. Since individual parishes have no unique identifiers and are sometimes referred to by more than one name, I focus on the municipality as the unit of analysis. I examine priest turnover within each municipality from one yearbook to the next. I ensure a balanced panel by aggregating the data based on the municipalities in 1970 and limiting the sample to municipalities that had at least one parish before the 1978 papal transition.
I estimate the effect of a JPII bishop’s control over a diocese on priest turnover through the following two-stage least-squares regression:
 $$ \begin{array}{rl}{Turnover}_{i,d,t}={\lambda}_i+{\theta}_t+{\gamma}_1{\hat{JPII\_ Bishop}}_{d,t}+{\epsilon}_{i,d,t,}& \end{array} $$
where $ {Turnover}_{i,d,t} $
represents either the share of parishes that experienced a turnover or a binary indicator for whether at least one parish in municipality i, within diocese d, underwent a turnover between the yearbook of year t and the previous edition. The variable
$ {Turnover}_{i,d,t} $
represents either the share of parishes that experienced a turnover or a binary indicator for whether at least one parish in municipality i, within diocese d, underwent a turnover between the yearbook of year t and the previous edition. The variable $ {\hat{JPII\_ Bishop}}_{d,t} $
denotes the predicted values for diocese d in year t from the first-stage regression, which estimates a binary indicator of whether the sitting bishop in year t was appointed by JPII, using as an explanatory variable a binary indicator for whether the diocese’s pre-JPII bishop had either passed away or reached the mandatory retirement age of 75 by year t. The analysis includes municipality (
$ {\hat{JPII\_ Bishop}}_{d,t} $
denotes the predicted values for diocese d in year t from the first-stage regression, which estimates a binary indicator of whether the sitting bishop in year t was appointed by JPII, using as an explanatory variable a binary indicator for whether the diocese’s pre-JPII bishop had either passed away or reached the mandatory retirement age of 75 by year t. The analysis includes municipality ( $ {\lambda}_i $
) and year (
$ {\lambda}_i $
) and year ( $ {\theta}_t $
) fixed effects which account for both unit- and time-invariant unobserved confounders. Standard errors are clustered at the 1978 diocese level.
$ {\theta}_t $
) fixed effects which account for both unit- and time-invariant unobserved confounders. Standard errors are clustered at the 1978 diocese level.
Table 2 presents the results of the analysis. The findings indicate that municipalities with a JPII-appointed bishop were nearly 8 percentage points more likely to experience priest turnover between yearbooks—a 12% increase from the outcome mean of 0.66.Footnote 40 The estimated effect remains consistent when measuring turnover as the share of a municipality’s priests who were reassigned (model 2) and when restricting the sample to municipalities that had only a single parish in 1977 (model 3). Additionally, the results remain consistent when excluding municipalities with parish priests from religious orders (model 4), whose reassignment required approval from their order’s leadership rather than solely the bishop (Cafardi and Hite Reference Cafardi and Hite2000).
The Effect of JPII Bishops on Priest Turnover

Note: The table shows that JPII bishops increased priest turnover in the municipalities within their dioceses. Standard errors clustered at the 1978 diocese level in parentheses. In all models, the unit of analysis is the 1970 municipality. All specifications are estimated using ordinary least squares (ITT) and 2SLS (CACE) and include municipality and year fixed effects. + $ p< $
0.1, *
$ p< $
0.1, * $ p< $
0.05, and **
$ p< $
0.05, and ** $ p< $
0.01.
$ p< $
0.01.
Evidence from Rio Grande do Sul supports the argument that JPII bishops were driven by ideological differences and targeted municipalities with progressive priests for replacement. While systematic data on priests’ ideological leanings are unavailable, I use a 1974 intelligence report to identify municipalities where progressive clergy were active before the 1978 papal transition.Footnote 41 The report lists 84 priests engaged in progressive economic activities, describing them as raising awareness about economic injustices, encouraging parishioners to join local unions, and providing church resources to unions and other economically progressive organizations. Using this list, I match priests to municipalities based on parish data from the 1977 Catholic Yearbook. In municipalities where a progressive priest was present, the appointment of a JPII bishop increased priest turnover by 16 percentage points (Table 2, model 5). In contrast, municipalities without prior progressive activity saw an increase of less than 2 percentage points—an effect that is statistically indistinguishable from zero (model 6). The difference between these estimates is statistically significant at the 0.05 level, reinforcing the conclusion that JPII bishops used their authority over priest assignments to suppress progressive activities in their dioceses.
Did JPII bishops’ efforts to curtail progressive clergy hinder the PT’s local expansion? To examine this, I apply the empirical strategy outlined in Equation 4 to estimate the impact of a JPII bishop’s appointment on the PT’s municipal presence. Specifically, I analyze a municipality-year panel dataset tracking new PT party affiliations from 1980 to 2002, using data from Brazil’s electoral commission (TSE 2017). While the ideal measure of party presence would be the establishment of local party offices, such data are unavailable for this period.Footnote 42 In light of these limitations, party affiliation records provide a reasonable alternative.
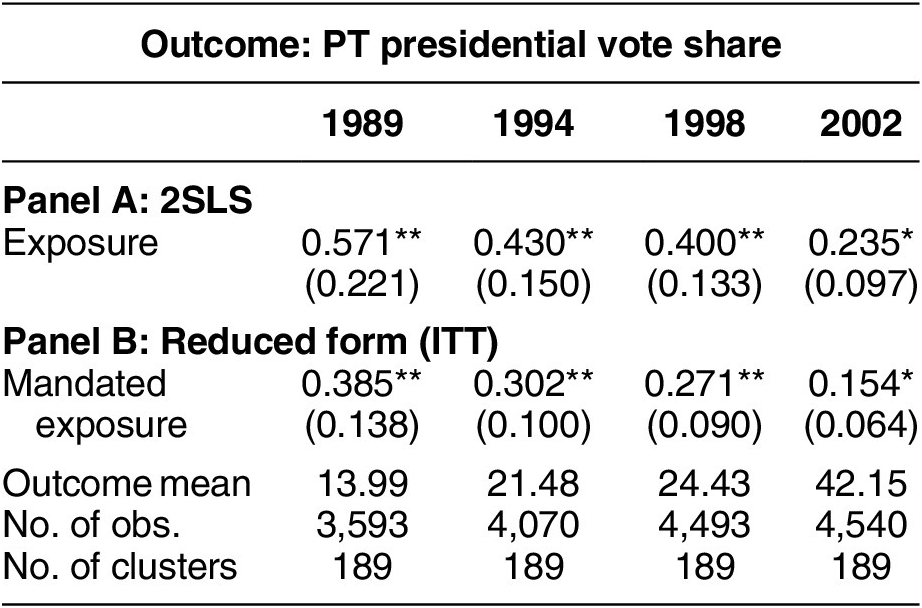
Table 3 shows that the PT was more likely to establish a presence and grow its membership in municipalities where progressive bishops remained in office, compared to those where they were replaced by JPII bishops. The table first reports the effect of JPII bishop leadership on a binary indicator of PT presence, defined as one from the first year in which at least five individuals registered as new PT affiliates within a municipality.Footnote 43 The findings show that municipalities in dioceses led by JPII bishops were 6.4 percentage points less likely to develop a local PT presence. Beyond restricting the PT’s initial foothold, municipalities under JPII bishops saw slower membership growth, with an average of 4.2 fewer new PT affiliations per year. These results suggest that the removal of progressive bishops significantly constrained the PT’s ability to establish and expand its support base at the local level.
The Effect of JPII Bishops on the Local Expansion of the PT

Note: Standard errors clustered at the 1978 diocese level in parentheses. In all models, the unit of analysis is the municipality. All specifications are estimated using ordinary least squares (ITT) and 2SLS (CACE) and include state fixed effects. + $ p< $
0.1, *
$ p< $
0.1, * $ p< $
0.05, and **
$ p< $
0.05, and ** $ p< $
0.01.
$ p< $
0.01.
EXPOSURE TO PROGRESSIVE BISHOPS AND THE GEOGRAPHY OF LEFT-WING SUPPORT
I have shown that progressive Catholic bishops improved the PT’s electoral performance by framing economic inequality as a moral issue and by fostering local networks of pro-redistributive organizations that the PT could leverage to recruit voters. A key implication of this argument is that left-wing parties should benefit most from these resources in areas where they cannot rely on pre-existing labor unions to mobilize workers.Footnote 44
This section evaluates that claim by analyzing the strength of labor unions—a traditional source of support for left-wing parties generally and the PT specifically—across Brazil. I use two proxies for union strength in 1980: (1) the share of workers in manufacturing and construction and (2) the share of workers in agriculture, fishing, and forestry.Footnote 45 Focusing on the 2002 presidential elections, I estimate heterogeneous treatment effects based on labor union strength using a binning model that divides municipalities into terciles according to each proxy variable’s distribution.Footnote 46 This approach follows the reduced-form intention-to-treat estimates in Equation 1, incorporating the relevant labor strength variable as a moderator. I also report results from standard linear interaction models.
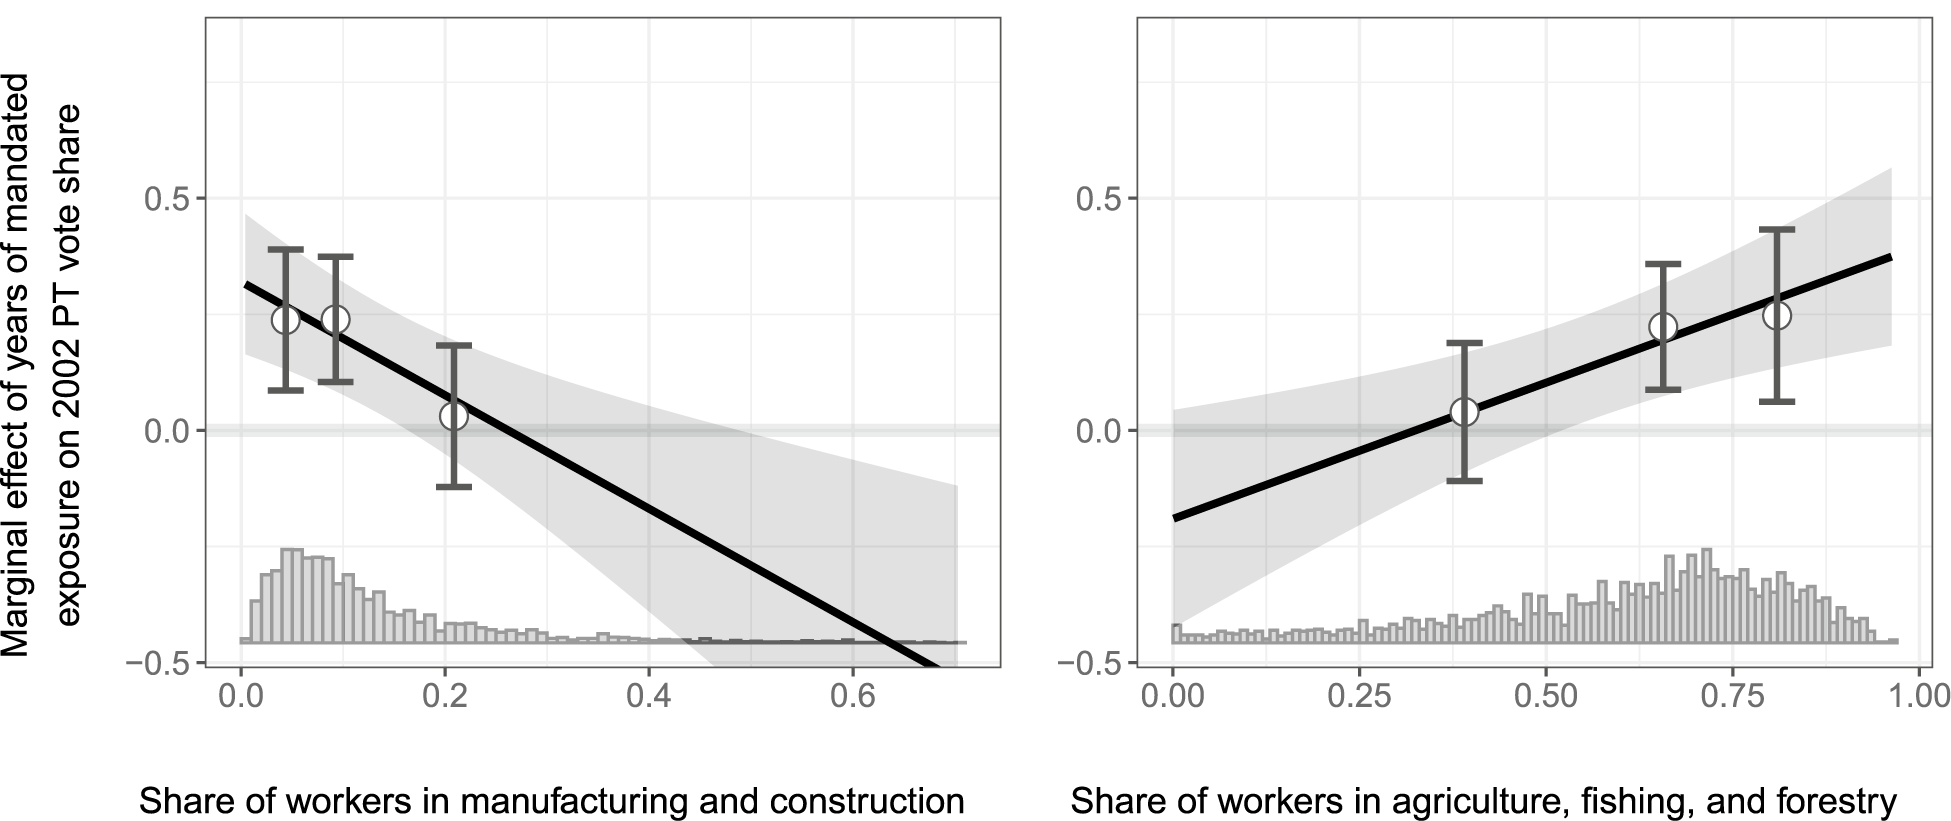
The results in Figure 4 support the expectation that the PT benefited most from progressive bishops in areas where labor unions were weaker.Footnote 47 The effect of exposure to a progressive bishop is substantial in municipalities with low (6.71% or less) or intermediate (6.71%–13.1%) workforce participation in manufacturing and construction (left panel), where each additional year of mandated exposure increased the PT’s vote share by approximately 0.24 percentage points. However, in municipalities in the highest tercile (where 13.1% or more of the workforce was employed in manufacturing and construction), the effect was much smaller—around 0.03 percentage points per year—and statistically indistinguishable from zero. The difference between these estimates is statistically significant at the 0.05 level. Similar patterns emerge when using the share of workers in agriculture, fishing, and forestry as the moderator (right panel). These findings suggest that the PT benefited most from extended exposure to progressive bishops in areas where labor unions had a weaker presence, making it harder to mobilize the poor through traditional labor organizing.
Marginal Effects of the Length of Exposure to a Progressive Bishop on the PT’s Vote Share
Note: The figures show that the electoral benefits of longer exposure to progressive bishops were concentrated in municipalities where the PT could not rely on labor unions for mobilization, as measured by the share of workers in manufacturing and construction (left) or agriculture, fishing, and forestry (right). The dependent variable is the PT’s vote share in 2002. The estimation follows the reduced-form intention-to-treat model in Equation 1, adding each labor strength variable as a moderator. The unit of analysis is the municipality. Standard errors are clustered at the 1978 diocese level. All specifications include state fixed effects.

CONCLUSION
This article argues that religious leaders can critically shape the electoral effects of religion. Economically progressive leaders can increase parishioners’ preference for economic redistribution and support local organizations that facilitate the growth of left-wing parties. This is potentially quite valuable to these parties, which may otherwise be forced to compromise their redistributive preferences in order to expand their electoral coalition. Many scholars argue that left-wing parties can expand their electoral appeal by forming cross-class coalitions, often by moderating their stance on redistribution to attract a broader electorate.Footnote 48 However, progressive religious leaders offer an alternative route to electoral success—one that enables left-wing parties to build and consolidate support without compromising their core redistributive commitments.
The article challenges the conventional characterization of religion’s influence in electoral politics as conservative and the assumption that left-wing parties are fundamentally secular. Prevailing theories of left-wing party development focus on European cases, where these parties often emerged in opposition to the Church.Footnote 49 This article shows that in contexts where religiosity is high and secular labor organizations are weak, religious voters can comprise a key component of the left’s electoral coalition. In such settings, left-wing parties may succeed not by opposing organized religion but rather by securing its support.
The presence of progressive religious leaders in a variety of contexts suggests this path to left-wing electoral success may be more common than previously recognized. In many national Catholic Churches, progressive bishops comprise a significant share of the clergy, particularly in Latin America.Footnote 50 Their engagement in politics has not been limited to Brazil; prior research indicates that progressive Catholic leaders have played a crucial role in supporting left-wing parties across the region, helping to mobilize voters and shape political agendas. Examples include the FMLN in El Salvador (Wood Reference Wood2003), the PVP in Costa Rica (Yashar Reference Yashar1992), the MAS in Bolivia, the FSLN in Nicaragua, Pachakutik in Ecuador (Van Cott Reference Van Cott2005; Yashar Reference Yashar2005), and various left-wing parties in Mexico and Guatemala (Trejo Reference Trejo2012). These cases highlight the broader relevance of religious leadership in left-wing party formation and suggest that the patterns observed in Brazil may extend to other contexts where religious institutions maintain significant local influence. However, important questions remain about the broader applicability of this argument, particularly across different religious traditions and political contexts.
Scholars might explore whether the patterns identified in this study extend beyond Catholicism to other Christian denominations and religious traditions. While some denominations, such as the Eastern Orthodox Church, share Catholicism’s hierarchical structure and territorial organization, many others differ significantly on these and other dimensions. Protestant denominations—for example—often feature decentralized leadership structures that grant individual congregations greater autonomy, potentially shaping the mechanisms through which religious leaders influence political behavior. Similarly, in non-Christian religious traditions, the role of religious authorities in social and political life varies widely, from a relatively centralized leadership in Shia Islam to more diffuse structures in Sunni Islam, Hinduism, and Buddhism. Investigating how progressive religious leadership interacts with different institutional and doctrinal contexts would refine the broader applicability of this argument and offer new insights into the relationship between religion and electoral politics.
Future studies could also examine whether the electoral impact of progressive religious leaders extends beyond new democracies. This article establishes that progressive Catholic bishops helped build support for the left during Brazil’s democratic transition, when party systems were still forming. A key question is whether these effects are unique to such critical junctures or if left-wing parties in more institutionalized party systems can also benefit from progressive religious leadership.
Finally, further research could explore how reliance on religious voters influences the policy platforms of left-wing parties. In many contexts, these parties have championed issues such as gender rights, sexuality, and church–state separation—stances that may at times clash with the beliefs or interests of religious leaders. When religious voters constitute a significant share of their coalition, left-wing parties may be more cautious in adopting stances that could alienate them. More research is needed to determine whether the presence of economically progressive religious leaders influences left-wing parties’ positions on social and cultural issues, as well as their broader policy agendas beyond economic redistribution.
SUPPLEMENTARY MATERIAL
To view supplementary material for this article, please visit https://doi.org/10.1017/S0003055426101427.
DATA AVAILABILITY STATEMENT
Research documentation and data that support the findings of this study are openly available at the American Political Science Review Dataverse: https://doi.org/10.7910/DVN/YGBWHC.
ACKNOWLEDGEMENTS
I thank Tommaso Giulla, Sofia Marinkovic Dal Poggetto, and Victoria Werner for excellent research assistance. I thank Aala Abdelgadir, Natália S. Bueno, Anna Callis, Ruth Berins Collier, Melani Cammett, Danny Choi, Ernesto Dal Bó, Frances Hagopian, Danny Hidalgo, Horacio Larreguy, Daniel Masterson, Gwyneth McClendon, Pablo Michel, Lucas Novaes, Alison Post, Kenneth Scheve, Luis Schiumerini, Jasjeet Sekhon, Niloufer Siddiqui, Jazmin Sierra, Anurag Sinha, Ann Swidler, Deborah Yashar, and workshop participants at the University of Chicago, Columbia, Florida State, Harvard, Notre Dame, NYU, Princeton, Stanford, UCLA, USC, UC Berkeley, and the Stanford-Berkeley Political Economy Working Group for helpful feedback. I am especially grateful to Thad Dunning for his generous advice throughout this project. I thank the staff at the Conferência Nacional dos Bispos do Brasil (CNBB) and the Biblioteca Central da Província Franciscana do Rio Grande do Sul for access to archival material; and the Institute of International Studies at UC Berkeley, the Global Religion Research Initiative (GRRI), as well as Princeton’s School of Public and International Affairs for financial support.
CONFLICT OF INTEREST
The author declares no ethical issues or conflicts of interest in this research.
ETHICAL STANDARDS
The author affirms this research did not involve human participants.


 Open access
Comments
No Comments have been published for this article.