

1. Introduction
Quantitative genetic analyses of body weight data in snails (Ros et al., Reference Ros, Sorensen, Waagepetersen, Dupont-Nivet, SanCristobal, Bonnet and Mallard2004) suggest genetic differences in variability. Therefore, QTLs (quantitative trait loci) may affect not only the mean of a certain character but also its variability. The analysis of QTL effects on between-subject variability of a normally distributed trait was investigated by Weller & Wyler (Reference Weller and Wyler1992). They mentioned uniformity of flowering time of plants as an example of potential economic importance, in particular when crops are harvested mechanically. Some phenotypes are repeated several times by the same individual, such as the size and weight of tomatoes from the same panicle of a tomato plant. Uniformity of such repeated phenotypes may also be genetically controlled and affected by the individual's genotype.
In multiparous species, birth weight of newborns from the same litter may be regarded as a special case of a repeated phenotype of the mother. The difference compared with the tomato example is that the phenotype of the newborns is not only under maternal control but is also affected by the father's genetic contribution. Högberg & Rydhmer (Reference Högberg and Rydhmer2000) and Damgaard et al. (Reference Damgaard, Rydhmer, Løvendahl and Grandinson2003) considered the within-litter standard deviation of piglet birth weight and attributed it to the dam of each litter as a maternal trait. A low within-litter uniformity was considered as an effect which was unfavourable for sow productivity. Heritability estimates for the character were 10% (Högberg & Rydhmer, Reference Högberg and Rydhmer2000) and 8% (Damgaard et al., Reference Damgaard, Rydhmer, Løvendahl and Grandinson2003). The same trait has also been studied in rabbits (Bolet et al., Reference Bolet, Garreau, Joly, Theau-Clement, Hurtaud and Bodin2005).
In this article it assumed that the QTL affects the within-litter variability of a mother's progeny, i.e. in contrast to Weller & Wyler (Reference Weller and Wyler1992) the focus is on within-subject variability. This offers the opportunity to construct a test for H 0: No QTL with effect on the within-litter variance is segregating versus H A: There is a QTL with effect on the variability of birth weight within litter. A daughter design is considered, where genotyped females are paternal half-sibs. The sample variances of birth weights within litter are the traits to which our model is fitted. First, the QTL effect on the within-litter variance is described. Then it is shown that a generalized linear model (GLM) can be applied for QTL mapping. This GLM is contrasted with a weighted regression approach in terms of power of QTL detection by numerical simulation. Inclusion of sex effects, different experimental designs and further fields of application are part of the discussion.
2. Methods
(i) QTL effect on the within-litter variance
It is assumed that a population of pigs has two alleles at the QTL denoted by Q and q. We consider a fixed number N of sires in our study, which are drawn by chance from the population. Every sire is mated with n unrelated dams. We pick out one daughter per mating and consider her offspring's birth weight as a multiple measurement. We assume that piglet birth weights are independently and identically distributed within one litter. The birth weight consists of a fixed litter mean, the normally distributed mendelian sampling effect N(0, ½σpolygene2) and the additive QTL effect, which is dependent on the piglet's genotype, with variance σQTL2 and the normally distributed random deviation N(0, σe2).
The sample variance of weights at birth within one litter, that is the secondary observation, is taken as a trait for every daughter amounting to Nn observations. Daughters having inherited the QTL allele Q from the presumed heterozygous sire feature uniformity of birth weights. Daughters with a paternal q allele show an increased variability of birth weight. In this case, the residual deviation of piglet birth weight is multiplicatively inflated by the factor c *∊(0, ∞). Thus, from the breeder's perspective, the positive effect of the QTL (the lower within-litter variance) is inherited with the QTL allele Q. A detailed description of the model for piglet birth weight and a further outline on the distribution of the traits are given in Appendix A.
The within-litter variance, i.e. the sample variance S i, j2 of birth weights within one litter, depends on the paternal QTL allele of the daughter i∊{1,…,N}, j∊{1, …,n}. The indicator function 1{Q},i, j takes the value 1 if the daughter i, j has inherited the allele Q and 0 otherwise. Later, in Sections 2(ii) and 2(iv), the probability Pr(1{Q},i, j=1) is determined conditional on the observed flanking marker alleles. The conditional expectation of S i, j2 given the inherited paternal QTL allele is
The value τ2≔½σpolygene2+σe2 summarizes the variance of the normally distributed effects of piglet birth weight under the condition that the sow has inherited the QTL allele Q. Similarly, τ*2≔ σpolygene2+(c *σe)2 includes the modified residual variance component. Set
The parameter c 2 is the ratio of the within-litter variance if the daughter i, j has inherited the QTL allele q and the within-litter variance if the daughter has inherited the allele Q. If the QTL effect on the within-litter variance actually exists, then the sample variance depends on the inherited paternal QTL allele and the ratio c 2 is different from 1. Otherwise c 2 is equal to 1.
(ii) Generalized linear model
The sires may have the marker genotype of kind m l, 1, m l, 2, where l∊{0,1, …, κ} denotes the marker position on the chromosome. The sire's two marker alleles are denoted by m l, 1 on his paternal chromosome and m l, 2 on his maternal chromosome for every marker position. It is not possible to determine which sire is heterozygous or homozygous at the QTL a priori. After the sires are genotyped, we suppose that all daughters are fully informative. Therefore, we need only to consider the paternal allele of daughters. The recombination rates are calculated by Haldane's mapping function. We consider intervals flanked by markers M l and M l+1 with realizations m l, rm l+1, s, where the subscripts r, s∊{1, 2} specify the sire's flanking marker alleles transmitted to the daughter. The transmission probability of the QTL allele Q at position d∊{0,1, …, δ} is a function of the flanking markers M lM l+1 and the paternal QTL allele. Let T i, j denote the random variable, which is realized by the respective transmission probability t i, j, d depending on the observed flanking marker alleles per daughter i, j at position d.
First, one presumed QTL position d∊{0,1, …, δ} is investigated. The observed value per daughter i, j is the realized sample variance s i, j2 of the piglet birth weights within one litter, i=1, …, N, j=1, …, n and s 2=(s 1, 12, s 1, 22, …, s N, n2)T. As a result of Appendix A, the distribution of the sample variance S i, j2 is approximated by a gamma distribution. Note that a gamma distributed random variable has the expectation μ and variance ![]() with dispersion parameter φ and weight w.
with dispersion parameter φ and weight w.
Our aim is to fit a GLM (McCullagh & Nelder, Reference McCullagh and Nelder1989) to the sample variances. To distend we introduce a multiplicative model. If the sire's genotype is Qq, then for r, s∊{1, 2} the conditional expectation of S i, j2 given the observed marker alleles {M l=m l, r, M l+1=m l+1, s} at position d is

The mean value u i per sire i∊{1, …, N} is
and the parameter b i describes the relation between the observed trait s i, j2 per daughter and the inherited paternal QTL allele, i.e.
In view of (3) the sample variance is described by the model
The εi, j are independently gamma distributed random variables with expectation 1. The weights are defined by ![]() , where n i, j denotes the litter size of daughter i, j. The identity link function is used to obtain the linear predictor ηi, j, d=μi, j, d. The parameter vector β consists of the regression coefficients
, where n i, j denotes the litter size of daughter i, j. The identity link function is used to obtain the linear predictor ηi, j, d=μi, j, d. The parameter vector β consists of the regression coefficients
The application of GLM theory leads to estimates of the expectations μd=(μ1, 1, d, μ1, 2, d, …, μN, n, d)T as well as the vector β in (7) at position d∊{0,1, …, δ} Consequently, it is possible to construct an appropriate test statistic to check the local null hypothesis H 0, d: There exists no QTL at position d affecting the within-litter variance, which is equivalent to
With (3) the log-likelihood function ℓ of the modelled gamma distributed random vector S 2=(S 1, 12, …,S N, n2)T can be expressed in terms of μd at position d. It holds
![\eqalign{\tab \ell \lpar s^{\setnum{2}} \comma \mu _{d} \comma \phi_{d} \rpar \equals \cr\tab {\quad\mathop\sum\limits_{i \equals \setnum{1}\comma j \equals \setnum{1}}^{N\comma n} {\left\{ {{{w_{i\comma j} } \over {\phi _{d} }}\left[{\hskip-{ \minus {{s_{i\comma j}^{\setnum{2}} } \over {u_{i} \plus b_{i} t_{i\comma j\comma d} }} }\minus {\rm ln\ \lpar }u_{i} \plus b_{i} t_{i\comma j\comma d} {\rm \rpar }}\right]}\right.}}\cr\tab \quad{ \plus \zeta \lpar s_{i\comma j}^{\setnum{2}}\comma \phi _{d} \rpar\hskip-14 \left.\phantom{{w_{i\comma j} } \over {\phi _{d} }}\right\} }{\ecolon} l\lpar s^{\setnum{2}} \comma \beta \comma \phi _{d} \rpar. \cr}](https://static.cambridge.org/binary/version/id/urn:cambridge.org:id:binary:20160927085853629-0897:S0016672307008968:S0016672307008968_eqn9.gif?pub-status=live)
The ζ(s i, j2, φd) summarizes those components where μi, j, d does not appear and β is the vector (7). The estimate ![]() may be obtained by iterative procedures (McCullagh & Nelder, Reference McCullagh and Nelder1989) as implemented in the ‘glm’ function of the R program (R Development Core Team, 2005). Using (4) and (5) the parameter c −1 is estimated for each sire i∊{1, …,N} at the detected QTL position
may be obtained by iterative procedures (McCullagh & Nelder, Reference McCullagh and Nelder1989) as implemented in the ‘glm’ function of the R program (R Development Core Team, 2005). Using (4) and (5) the parameter c −1 is estimated for each sire i∊{1, …,N} at the detected QTL position ![]() by
by

For asymptotic investigations of the estimator ![]() , some special matrices are needed. The design matrix
, some special matrices are needed. The design matrix ![]() d, which contains the transmission probabilities at position d, is
d, which contains the transmission probabilities at position d, is

Let ![]() be the diagonal weight matrix with elements
be the diagonal weight matrix with elements ![]() . Then it follows from (9) that the Fisher information matrix
. Then it follows from (9) that the Fisher information matrix ![]() (β, d) of the conditional distribution at position d is
(β, d) of the conditional distribution at position d is

Moreover, let ![]() d∊∝2N×2N be the root of
d∊∝2N×2N be the root of ![]() −1(β, d) defined by
−1(β, d) defined by ![]() dT
dT![]() d=
d=![]() −1(β,d). Under some conditions (Fahrmeir & Kaufmann, Reference Fahrmeir and Kaufmann1985), which can be shown to be satisfied (see Supplementary Appendixes), the ML estimator
−1(β,d). Under some conditions (Fahrmeir & Kaufmann, Reference Fahrmeir and Kaufmann1985), which can be shown to be satisfied (see Supplementary Appendixes), the ML estimator ![]() is asymptotically normal, i.e.
is asymptotically normal, i.e.
where →![]() denotes the convergence in distribution.
denotes the convergence in distribution.
Under the null hypothesis (8) the model reduces to S i, j2=u i⋅εi, j. It can be shown that the dispersion parameter φd0=φ0 is approximately 1 under the null hypothesis for every position d (see Supplementary Appendixes). Thus, the likelihood function of S 2 at φ0=1 is constant for every position d under H 0, d.
(iii) Test statistics in the GLM
Four different types of tests statistics differing, among others, in their treatment of the dispersion parameter are described in detail in the following. Three of them are later compared via simulation (Section 3).
The estimate of the expectation vector μd is defined by ![]() . With the log-likelihood function
. With the log-likelihood function ![]() in (9) the scaled deviance D* for a fixed value of the dispersion parameter φd is defined by (McCullagh & Nelder, Reference McCullagh and Nelder1989)
in (9) the scaled deviance D* for a fixed value of the dispersion parameter φd is defined by (McCullagh & Nelder, Reference McCullagh and Nelder1989)
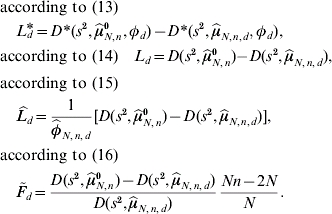
The deviance D is characterized by ![]() . Under the null hypothesis H 0, d and for a fixed value φd the likelihood ratio is asymptotically χ2-distributed with N degrees of freedom (Fahrmeir & Tutz, Reference Fahrmeir and Tutz1994)
. Under the null hypothesis H 0, d and for a fixed value φd the likelihood ratio is asymptotically χ2-distributed with N degrees of freedom (Fahrmeir & Tutz, Reference Fahrmeir and Tutz1994)

where ![]() is the ML estimate under the null hypothesis. With the log-likelihood function ℓ(s 2,μd, φd)=l(s 2, β, φd) in (9), the statement (12) is equivalent to
is the ML estimate under the null hypothesis. With the log-likelihood function ℓ(s 2,μd, φd)=l(s 2, β, φd) in (9), the statement (12) is equivalent to
If φd=1 is satisfied, then
The generalized Pearson estimator for the dispersion parameter φd at position d∊{0,1, …,δ} is defined by (e.g. Fahrmeir & Tutz, Reference Fahrmeir and Tutz1994)

This estimator is consistent and approximately χ2-distributed (Fahrmeir & Tutz, Reference Fahrmeir and Tutz1994). If φd is replaced by a consistent estimator in (12), then this statement remains valid. According to Jørgensen (Reference Jørgensen1987) it holds

Similarly, the deviance estimator ![]() is usually applied to estimate the dispersion parameter,
is usually applied to estimate the dispersion parameter,
Note that ![]() is not necessarily consistent. Using this deviance estimator the distribution of the left-hand term in (13) is approximated by the F-distribution with N and Nn−2N degrees of freedom (Jørgensen, Reference Jørgensen1987),
is not necessarily consistent. Using this deviance estimator the distribution of the left-hand term in (13) is approximated by the F-distribution with N and Nn−2N degrees of freedom (Jørgensen, Reference Jørgensen1987),
To test the local null hypothesis in (8) H0,d: μd=μ0 there are at least four natural test statistics:
If φd=1 is not fulfilled, then the test based on ![]() and
and ![]() can be expected to have more QTL detection power. The threshold value under local investigations is given by the 95% quantile of the corresponding distribution in (13), (14), (15) and (16) of the test statistics L d*, L d,
can be expected to have more QTL detection power. The threshold value under local investigations is given by the 95% quantile of the corresponding distribution in (13), (14), (15) and (16) of the test statistics L d*, L d, ![]() and
and ![]() , respectively.
, respectively.
We now consider the global hypothesis testing problem H 0: There exists no QTL on the chromosome with effect on the within-litter variance, which is equivalent to

The following test statistics are appropriate:
The null hypothesis (17) is rejected for large values of the corresponding test statistic. The theoretical distribution of the presented test statistics is unknown because of marker dependencies. Thus, to find the threshold we use the permutation test approach (Churchill & Doerge, Reference Churchill and Doerge1994). Properties of these tests will be given in Section 3.
Furthermore, the QTL is estimated by maximum likelihood at that position, where the value of the test statistic is maximal, e.g.
(iv) Weighted regression
Using ideas from Haley & Knott (Reference Haley and Knott1992) we introduce a weighted regression model and construct the test statistic for the global null hypothesis in (17). Later, in Section 3, the two approaches will be compared by computer simulations. Ros et al. (Reference Ros, Sorensen, Waagepetersen, Dupont-Nivet, SanCristobal, Bonnet and Mallard2004) recommended the use of a log-transformation on skew distributed traits (Box & Cox, Reference Box and Cox1964). Applying the logarithm of the sample variances the data are approximated by a normal distribution (see Supplementary Appendixes) and a linear model (LM) is constructed. Note that under the log-transformation the multiplicative effect on the within-litter variance becomes additive.
Considering the observed marker alleles m l, rm l+1, s of individual i, j and the parameter c 2 in (2) the conditional expectation given the flanking marker alleles is

Thus, the LM at a fixed position d∊{0,1, …,δ} is defined by
Here the εi, j are normally distributed random variables with expectation null and T i, j are the transmission probabilities as explained in Section 2(ii). The parameter u i is the mean value per family and b i describes the linear connection between the observations ln s i, j2 and the inherited paternal QTL allele expressed by the individual transmission probabilities. A standard (weighted) regression analysis has been carried out in order to estimate the parameter vector β similar to (7) for every position d on the chromosome. For weighted regression we refer to Seber (Reference Seber1977). To check the local null hypothesis H 0, d in (8), a test statistic F d is constructed, which is a function of the residual sum of squares of the full and reduced model. This statistic is approximately F-distributed under H 0, d with N and Nn – 2N degrees of freedom (Seber, Reference Seber1977). To test the global null hypothesis H 0 in (17) the permutation test is used again to determine the threshold value. The suitable test statistic is
Under the assumption that the sire i∊{1, …,N} has the genotype Qq, it follows from (23) that b i=−lnc 2. Thus, the parameter c −1 is estimated at the detected QTL position ![]() by
by
3. Simulation studies
When genotyping the individuals of the population, we set markers at intervals of 10 centiMorgan (cM) on a chromosome of length 100 cM (δ=99). We thus have 11 markers at our disposal (κ=10) and the local test statistics are evaluated in steps of 1 cM. Under the null hypothesis H 0, no QTL is segregating in the population. To model the alternative hypothesis we placed a single QTL at position 25 cM (between the third and fourth marker). In the simulation study we used N=4 sires and n=200 daughters per sire. The litter size is Poisson distributed (Thomson, Reference Thomson2003) with a mean value of 10. The transformed weight at birth X i, j, k in (A.4) is simulated. The standard deviation of piglet birth weight is assumed to be 320 g (e.g. Roehe, Reference Roehe1999). Similar to Roehe (Reference Roehe1999) the residual variance is about 40% of the phenotypic variance, σe2=(200 g)2. The direct polygenic variance is about 9% of the phenotypic variance, σpolygene2=(96·8 g)2. The value of the transformed additive QTL effect ![]() i, j, k is listed in Table 2 and depends on the piglet's genotype. Because the variance of the additive QTL effect takes about 1–3% of the phenotypic variance (e.g. Bidanel et al., Reference Bidanel, Milan, Iannuccelli, Amigues, Boscher, Bourgeois, Caritez, Gruand, le Roy, Lagant, Quintanilla, Renard, Gellin, Ollivier and Chevalet2001), the additive value is a=61 g. The factor c * varies from 1 to 1·4 by 0·1. The gene frequency is assumed to be one-half. Covariances between the maternal effects and the direct effects of the piglet are neglected. The marker alleles m l, r, l=0,1, …, 10, are drawn by chance according to the recombination rates. The simulation was repeated 100 times for every investigated factor c *. Ten thousand permutations of the first simulated sample variances were used to determine the chromosome-wise threshold value. This critical value was also applied for the following 99 repeated simulations of sample variances. The simulations and tests were carried out with ‘glm’ and self-written functions of the R program (R Development Core Team, 2005).
i, j, k is listed in Table 2 and depends on the piglet's genotype. Because the variance of the additive QTL effect takes about 1–3% of the phenotypic variance (e.g. Bidanel et al., Reference Bidanel, Milan, Iannuccelli, Amigues, Boscher, Bourgeois, Caritez, Gruand, le Roy, Lagant, Quintanilla, Renard, Gellin, Ollivier and Chevalet2001), the additive value is a=61 g. The factor c * varies from 1 to 1·4 by 0·1. The gene frequency is assumed to be one-half. Covariances between the maternal effects and the direct effects of the piglet are neglected. The marker alleles m l, r, l=0,1, …, 10, are drawn by chance according to the recombination rates. The simulation was repeated 100 times for every investigated factor c *. Ten thousand permutations of the first simulated sample variances were used to determine the chromosome-wise threshold value. This critical value was also applied for the following 99 repeated simulations of sample variances. The simulations and tests were carried out with ‘glm’ and self-written functions of the R program (R Development Core Team, 2005).
Calculation of genotype frequencies within litter; presumed gene frequency p Q=0·5; dominance effect is omitted; a denotes the additive value

Calculation of various expectations of the transformed QTL effect ![]() i,j,k,m=G i,j,k−
i,j,k,m=G i,j,k−![]() (G i,j,k|B=B m); dominance effect is omitted; a denotes the additive value and σQTL2 denotes the variance of the QTL effect G i,j,k
(G i,j,k|B=B m); dominance effect is omitted; a denotes the additive value and σQTL2 denotes the variance of the QTL effect G i,j,k

Fig. 1 a shows the density estimates of the conditional distributions of S i, j2 obtained from the application ‘density’ with Gaussian kernel in R. This figure shows how the densities depend on the inherited paternal QTL allele as it is pointed out in Appendix A.
QTL simulated at 25 cM, c *=1·2. (a) Estimation of densities separated by paternal QTL allele Q and q; (b) average values of test statistic ![]() based on the GLM and 100 repetitions.
based on the GLM and 100 repetitions.

(i) Results based on the GLM
Examples of the results of analysing the simulated sample variances with use of the GLM theory are shown for the factor c *=1·2 (c=1·177) in Figs. 1 b and 2 a, b. Fig. 1 b displays the average values of the test statistic ![]() in (20). The maximum of these values of the test statistic is attained at about 25 cM, where the QTL was actually simulated. Fig. 2 a is a histogram of detected QTL positions (22) if the null hypothesis is rejected. One can see that the estimated positions closely surround the correct position and deviate by only about 5–10 cM. In Fig. 2 b it is conspicuous that the estimates of
in (20). The maximum of these values of the test statistic is attained at about 25 cM, where the QTL was actually simulated. Fig. 2 a is a histogram of detected QTL positions (22) if the null hypothesis is rejected. One can see that the estimated positions closely surround the correct position and deviate by only about 5–10 cM. In Fig. 2 b it is conspicuous that the estimates of ![]() are split into three groups. Depending on the linkage of marker and QTL alleles the values fluctuate around the parameters c or c −1 for heterozygous sires with genotype qQ and Qq, respectively. Otherwise, in case of homozygotes, the estimates vary about 1. When test statistic
are split into three groups. Depending on the linkage of marker and QTL alleles the values fluctuate around the parameters c or c −1 for heterozygous sires with genotype qQ and Qq, respectively. Otherwise, in case of homozygotes, the estimates vary about 1. When test statistic ![]() is applied, the results are similar to the application of
is applied, the results are similar to the application of ![]() as shown in Table 3.
as shown in Table 3.
QTL simulated at 25 cM, N=4 sires, n=200 daughters, c *=1·2 (c=1·177). (a) Detected QTL positions based on the GLM with test statistic ![]() ; (b) histogram of estimator
; (b) histogram of estimator ![]() based on the GLM; (c) detected QTL positions based on the LM with test statistic F; (d) histogram of estimator
based on the GLM; (c) detected QTL positions based on the LM with test statistic F; (d) histogram of estimator ![]() based on the LM.
based on the LM.

Summary of simulation results (10% of repetitions with exclusive homozygous sires); power_p_emp denotes the empirical pointwise power evaluated at the simulated QTL position at 25 cM with use of tabulated quantiles of the χ2- and F-distribution; power_g_emp is the empirical global power; mean_detec is the average of detected QTL positions and variance_detec is the sample variance of estimated positions; the statistic F is based on the LM and L, ![]() ,
, ![]() are based on the GLM
are based on the GLM

(ii) Results based on the LM
Evaluating the simulated sample variances with use of the test statistic F in (25), the results differ slightly from the case of applying the test statistics ![]() and
and ![]() . For the weighted regression model we used a maximization as in (22) to estimate the QTL position. Fig. 2 c gives a histogram of the estimated QTL positions if H 0 is rejected. The fluctuation around the simulated QTL position at 25 cM is similar to the GLM. Fig. 2 d displays a histogram of the estimator
. For the weighted regression model we used a maximization as in (22) to estimate the QTL position. Fig. 2 c gives a histogram of the estimated QTL positions if H 0 is rejected. The fluctuation around the simulated QTL position at 25 cM is similar to the GLM. Fig. 2 d displays a histogram of the estimator ![]() and shows again that the estimator has a mixed distribution.
and shows again that the estimator has a mixed distribution.
Table 3 summarizes the results achieved using the test statistics L, ![]() ,
, ![]() and F in (19)–(21) and (25), respectively. The empirical QTL detection power is determined by the relative frequency of rejecting the null hypothesis. It is obvious that with increasing factor c * the empirical power increases. The empirical global power should not exceed the value of 90%, because 10% of the repeated simulations created exclusively homozygous sires at random (all N=4 sires are homozygous) and therefore a QTL effect on the within-litter variance could not be detected. Under the null hypothesis H 0 (c=1) and chromosome-wise investigations the α level of 5% holds for the verified test statistics except statistic
and F in (19)–(21) and (25), respectively. The empirical QTL detection power is determined by the relative frequency of rejecting the null hypothesis. It is obvious that with increasing factor c * the empirical power increases. The empirical global power should not exceed the value of 90%, because 10% of the repeated simulations created exclusively homozygous sires at random (all N=4 sires are homozygous) and therefore a QTL effect on the within-litter variance could not be detected. Under the null hypothesis H 0 (c=1) and chromosome-wise investigations the α level of 5% holds for the verified test statistics except statistic ![]() . This may be due to the approximative permutation test with only 10 000 re-samples.
. This may be due to the approximative permutation test with only 10 000 re-samples.
For c * values 1·2 and larger values, where the QTL detection power is already very high, all tests perform equally well. However, for c *=1·1 or equivalent c=1·088 the GLM clearly outperforms the weighted regression approach and provides an extra gain of 12% empirical global power. From Table 3 we can see that the tests based on the GLM provide a higher empirical QTL detection power than tests based on weighted regression. Similar results are given under local investigations at d=25 cM (see Table 3).
4. Discussion
(i) LM versus GLM
Applying the test based on the LM requires far less computing time compared with the tests based on the GLM (2 hours vs 17 hours for simulating the dataset and running the tests on a PC with a 3 GHz Intel processor). The surplus of computing time for the GLM is, however, not large compared with the total time and costs usually required for QTL experiments. The benefit of the GLM with respect to empirical global power is obvious when c *=1·1; the use of the test statistics ![]() and
and ![]() should be favoured. The presented test statistics remain suitable in the case of a varying number of daughters per sire. To avoid a loss of QTL detection power, a decreased number of daughters per sire may be adjusted for by considering more half-sib families. It may be interesting to mention that using the log-link instead of the identity link function leads to slightly less QTL detection power (Wittenburg, Reference Wittenburg2005).
should be favoured. The presented test statistics remain suitable in the case of a varying number of daughters per sire. To avoid a loss of QTL detection power, a decreased number of daughters per sire may be adjusted for by considering more half-sib families. It may be interesting to mention that using the log-link instead of the identity link function leads to slightly less QTL detection power (Wittenburg, Reference Wittenburg2005).
Thomson (Reference Thomson2003) and Lange & Whittaker (Reference Lange and Whittaker2001) specified the detection of a QTL for non-normal traits. Thomson (Reference Thomson2003) proposed a model for non-normal data types using normal-based profile log-likelihood and solving the generalized estimating equations. These methods of parameter estimation are comparable to the techniques described above. The essential difference is, that the present work employs the approximate gamma distribution of S i, j2 and develops the appropriate profile log-likelihood for the estimation of the QTL position parameter d.
Standard regression interval mapping has been proved to be a robust method for non-normally distributed continuous traits in comparison with non-parametric approaches (Rebaï, Reference Rebaï1997). Kadarmideen et al. (Reference Kadarmideen, Janss and Dekkers2000) found similar QTL detection power with LM and GLM for binary traits. However, Yin & Zhang (Reference Yin and Zhang2006) demonstrated for ordinal data that the GLM outperformed the LM in terms of QTL detection power. Therefore, our results provide another example in which a GLM should be preferred for QTL mapping.
(ii) Analysis of heterogeneous variances
Several authors have dealt with heterogeneity of variances. Mixed Gaussian models for the within-litter standard deviation have already been mentioned (Högberg & Rydhmer, Reference Högberg and Rydhmer2000; Damgaard et al., Reference Damgaard, Rydhmer, Løvendahl and Grandinson2003). Foulley et al. (Reference Foulley, Gianola, SanCristobal and Im1990) put forward a log-linear model for residual variances in order to identify sources of heterogeneity, an idea which has been further extended by SanCristobal et al. (Reference SanCristobal, Foulley and Manfredi1993), Foulley & Quaas (Reference Foulley and Quaas1995) and SanCristobal-Gaudy et al. (Reference SanCristobal-Gaudy, Elsen, Bodin and Chevalet1998) by including heterogeneous genetic components of variance and random factors affecting variances. A Bayesian approach jointly considering genetic effects on mean and residual variance was developed by Sorensen & Waagepetersen (Reference Sorensen and Waagepetersen2003). Other extensions comprise mean–variance relationships (Foulley, Reference Foulley2004) in models allowing also for effects of explanatory variables on variance components. The latter approach in particular would presumably be worthwhile to be investigated as an alternative to the methods presented.
(iii) Ambiguity of the parameter c 2
The parameter c 2 denotes the ratio of within-litter variance of q-daughters compared with Q-daughters. If the parameter c is significantly different from 1, it is ambiguous whether the within-litter variance is affected by a raised residual variance, by an enlarged polygenic variance or by an increased QTL variance (see equation (1)). When a non-significant result is observed, a constant within-litter variance could also be generated by, for example, an increased residual variance and decreased polygenic variance. Therefore, it should be kept in mind that the parameter c 2 is just a cumulative effect for any changes in the components of the within-litter variance.
(iv) Granddaughter design
The applied model for the daughter design can be extended, with some modifications, to the granddaughter design. Consider a fixed number of grandsires, which are mated with unrelated granddams of the population. We select one son per mating and these sons are mated with unrelated dams. One daughter per mating is chosen to analyse the within-litter variance. For each granddaughter we have to calculate the sample variance of observed birth weights within one litter. We may assign the sample variances pooled over all daughters as observation for every sire and apply the techniques of Section 2 with adjusted degrees of freedom (number of total piglets minus number of daughters) in the matrix of weights.
(v) Sex effect
Up to now it has been assumed that no sex effect occurs on the piglet's mean value or on the variability of phenotypes. But the expected phenotypic value of male piglets may be larger than for female piglets. To consider such an effect, the model (A.1) in Appendix A has to be adjusted. Three different scenarios are possible: (i) No sex effect on the mean and variability of the phenotypic value exists. Therefore, the observed value per daughter consists of the sample variance of all weights at birth within one litter (degrees of freedom: litter size minus 1). (ii) A sex effect acts on the expected phenotypic value but not on its variability. Thus, the observed value per daughter is the sample variance of birth weights pooled over male and female progeny (degrees of freedom: litter size minus 2). (iii) The sex affects the variability of the phenotypic value. Thus, there are two observed values per litter: the respective sample variances of male and female progeny. In this case it is possible to test a QTL effect as well as a sex by QTL interaction.
(vi) Other fields of application
A second series of simulations was started with multiple measurements taken from the genotyped individuals themselves (i.e. the daughters), such as the withers height of cows in a daughter design. In this case the theory simplifies, because the phenotypic value depends only on the individual's own genotype and not on any paternal QTL allele in progeny. Thus, the model for the primary trait consists only of the mean value within daughter i, j and the normally distributed residual deviation, which is modified by c∊(0, ∞) if the daughter has inherited the QTL allele q. The value c appears directly in this model. Therefore, the parameter c 2 still denotes the ratio of variance within individual of q-daughters to Q-daughters. Note that in this case the distribution of S i, j2 is exactly gamma.
In the simulated example, the withers height of cows was measured 10 times in a daughter design with N=4 sires and n=200 daughters per sire. The simulated QTL effect of c=1·2 was detected in 94% of the repetitions with use of the test statistic F and ![]() (six repetitions created exclusively homozygous sires). When the withers height was measured three times, the simulated QTL effect of c=1·3 was detected in 70% of the repetitions based on the test statistic F and in 85% based on the statistic
(six repetitions created exclusively homozygous sires). When the withers height was measured three times, the simulated QTL effect of c=1·3 was detected in 70% of the repetitions based on the test statistic F and in 85% based on the statistic ![]() (seven repetitions with only homozygous sires).
(seven repetitions with only homozygous sires).
In plants and laboratory animals, a panel of recombinant inbred lines (RILs; e.g. Broman, Reference Broman2005) can be produced for QTL mapping purposes. As all members of a certain RIL share the same genotype but may vary in their phenotype, RILs can serve as a well-suited tool for mapping QTL effects on within-genotype variability. Essentially a panel of RILs can be treated with the methods presented in this article, when the data are analysed as a single half-sib family (or backcross) in the same way as in the cow example.
There are possible applications in plants which closely resemble the repeated measurements of withers height of cows. For example, one could examine some characteristic of tomato fruits as a multiple measurement of a tomato plant. Again, in this application the theory simplifies because of lack of a paternal genetic effect on the fruits (tomatoes are almost purely maternal tissue). Moreover, the sample variances per panicle may be pooled over all panicles to generate one observation per tomato plant and to consider some effect of panicle on the phenotypic mean of the fruits.
(vii) Gene frequency
The GLM (6) and LM (24) do not include a parameter for the gene frequency p Q of the QTL allele Q; in the simulations the gene frequency was assumed to be one-half. Looking at the components which are affected by p Q, the ratio c 2 in (2) is obvious. The parameter c 2 depends on the variance of the transformed QTL effect ![]() i, j, k in (A.2) of Appendix A, which is calculated on the basis of known genotype frequencies within one litter (Table 2). Thus, if p Q differs essentially from one-half, the condition
i, j, k in (A.2) of Appendix A, which is calculated on the basis of known genotype frequencies within one litter (Table 2). Thus, if p Q differs essentially from one-half, the condition ![]() (
(![]() i, j, k|1{Q}, i, j=1)=
i, j, k|1{Q}, i, j=1)=![]() (
(![]() i, j, k|1{Q}i, j=0)=σQTL2 is no longer satisfied. Consequently, the ratio c 2 deviates from 1 even though a QTL effect on the within-litter variance does not exist. To consider the consequences of a gene frequency being different from one-half, the simulations under the null hypothesis (c *=1) have been repeated for the statistics
i, j, k|1{Q}i, j=0)=σQTL2 is no longer satisfied. Consequently, the ratio c 2 deviates from 1 even though a QTL effect on the within-litter variance does not exist. To consider the consequences of a gene frequency being different from one-half, the simulations under the null hypothesis (c *=1) have been repeated for the statistics ![]() in (20) and F in (25) using gene frequencies of 0·10 and 0·25. Without giving the detailed simulation results we remark that the α level of 5% was always maintained in both tests. This can be referred to a relatively small variance of the additive QTL effect in comparison with the other variance components (see equation (1)). Hence in most practical applications with a possible paternal QTL effect on progeny (piglets), a gene frequency different from 0·5 can be neglected and the theory provided may still serve as a good approximation. In all other cases (tomatoes, withers height of cows) where repeated measurements are taken from either the genotyped individuals themselves or from purely maternal tissues, our theory is exact and unaffected by the allele frequency at the QTL.
in (20) and F in (25) using gene frequencies of 0·10 and 0·25. Without giving the detailed simulation results we remark that the α level of 5% was always maintained in both tests. This can be referred to a relatively small variance of the additive QTL effect in comparison with the other variance components (see equation (1)). Hence in most practical applications with a possible paternal QTL effect on progeny (piglets), a gene frequency different from 0·5 can be neglected and the theory provided may still serve as a good approximation. In all other cases (tomatoes, withers height of cows) where repeated measurements are taken from either the genotyped individuals themselves or from purely maternal tissues, our theory is exact and unaffected by the allele frequency at the QTL.
The research project was financially supported by the H. Wilhelm Schaumann Stiftung.
5. Appendix A. Distribution of the sample variance
The phenotypic value Y i, j, k of piglet within one litter is described by the following model consisting of independent components:

where i indicates the sire, j the daughter per sire and k the piglet. The constant litter mean is denoted by μi, j. The random components are the mendelian sampling effect ![]() , the additive QTL effect G i, j, k and the random deviation E i, j, k~N(0, σe2).
, the additive QTL effect G i, j, k and the random deviation E i, j, k~N(0, σe2).
The indicator function 1{Q}, i, j takes the value 1 if the daughter i, j inherits the QTL allele Q at the unknown QTL position from the sire i. In the case of inheriting q, the random deviation E i, j, k of model (A.1) is modified by the factor c *∊(0, ∞). Let 1{Qq, qQ}, i, j, k be the indicator function with value 1 if the piglet has a heterozygous genotype, 1{QQ}, i, j, k and 1{qq}, i, j, k in the case of genotype QQ and qq, respectively. The additive QTL effect G i, j, k depends on the piglet's genotype and has a three-point distribution. In the absence of a dominance effect its probabilities are

where a is some unknown constant which, in view of (A.1), is called the additive value. The probability that the piglet has a special genotype, e.g. Pr(1{QQ}, i, j, k=1), is only allocatable in combination with the unobservable parental genotypes. Therefore, an additional random variable B is required, which denotes the random combination of QTL alleles of the daughter i,j and her associated male (mating types) as described in columns 3 and 4 of Table 1. The realizations of B are denoted by b m, m=1, ..., 12 (column 2 of Table 1). The conditional distributions of G i, j, k given B lead to the distribution of the additive QTL effect G i, j, k. For a fixed index m the phenotypic values of the offspring within one litter are independently and identically distributed. Because μQTL, m=![]() (G i, j, k|B=b m)≠0 (for some exceptions see Table 1), we set
(G i, j, k|B=b m)≠0 (for some exceptions see Table 1), we set
which now satisfies ![]() (
(![]() i, j, k|B=b m)=0 ∀m. If Aθ={1{Q}, i, j=θ}, θ∊{0, 1}, then
i, j, k|B=b m)=0 ∀m. If Aθ={1{Q}, i, j=θ}, θ∊{0, 1}, then

where the different values of  are listed in Table 2, column 4 and the corresponding row b m. The variance of the additive QTL effect is defined by
 ![]() . We see from (A.3) that
. We see from (A.3) that ![]() (
(![]() i, j, k|A θ)=σQTL2, θ∊{0, 1}.
i, j, k|A θ)=σQTL2, θ∊{0, 1}.
To eliminate μi, j that appears in (A.1), we introduce X i, j, k by
If n i, j denotes the litter size of daughter i,j, then the sample variance is

The within-litter variance depends on the paternal QTL allele of the daughter i, j. The conditional expectation of X i, j, k and S i, j2 given the events A θ, θ∊{0, 1}, are

Because the investigated sample variance includes the non-normally distributed variable ![]() i, j, k, the conditional distribution of S i, j2 is not a χ2 distribution. Therefore, an approximation with a gamma distribution &Ggr;μ,νi, j with expectation μ and variance
i, j, k, the conditional distribution of S i, j2 is not a χ2 distribution. Therefore, an approximation with a gamma distribution &Ggr;μ,νi, j with expectation μ and variance ![]() will be considered.
will be considered.
Assertion 1The conditional variance of S i, j2in ( A.5) given {1{Q}, i, j=1} is
![{\bb V}\lpar S_{i\comma j}^{\setnum{2}} \vert {\bf 1}_{\lcub Q\rcub \comma i\comma j} \equals 1\rpar \equals {2 \over {n_{i\comma j} \minus 1}}\left[ {\lpar \tau ^{\setnum{2}} \plus 2\sigma _{QTL}^{\setnum{2}} \rpar \tau ^{\setnum{2}} \plus \sigma _{QTL}^{\setnum{4}} \left( {{{n_{i\comma j} } \over 4} \plus {1 \over 4} \plus {1 \over {n_{i\comma j} }}} \right)} \right].](https://static.cambridge.org/binary/version/id/urn:cambridge.org:id:binary:20160927085853629-0897:S0016672307008968:S0016672307008968_eqnU38.gif?pub-status=live)
An analogous statement holds under the condition of {1{Q}, i, j=0} if τ*2is used instead of τ2.
Proof: See Supplementary Appendixes.
Fig. 3 a and b show a simulated histogram of S i, j2. Paternal QTL alleles Q and q were distinguished. The figures suggest approximating the conditional distribution of S i, j2, in (A.5) by a two-parameter gamma distribution &Ggr;μ,νi,j with

Note that the presented model (A.1) is an all-purpose model that covers two assumptions. First, similar to the ideas of Hill & Zhang (Reference Hill and Zhang2004), the QTL may affect both the phenotypic mean and its variability. In this case, the distribution of the daughter's trait is approximated by a gamma distribution as shown above. Second, the QTL affects only the variability of the phenotype. Then the general model (A.1) simplifies and the distribution of the within-subject sample variance is exactly gamma.
(a) Histogram of simulated values s i, j2 when inheriting Q versus density of a gamma distribution with parameters in (A.6); (b) histogram of simulated values s i, j2 when inheriting q versus density of a gamma distribution with parameters in (A.6), where τ2 is replaced by τ*2 and c *=1·2.


