Introduction
The establishment of Nairobi National Park in 1946 was a milestone in the preservation of wildlife species and their habitats in Kenya. Since then many protected areas have been designated (Sindiga, Reference Sindiga1995; Sarkar, Reference Sarkar1999) and these areas are important both for their biodiversity and for their support of the country’s economy through tourism (Mugabe, Reference Mugabe, Mugabe and Clark1998; Mugabe et al., Reference Mugabe, Marekia, Mukii, Mugabe and Clark1998; Okello et al., Reference Okello, Wishitemi and Mwinzi2001; Kameri, Reference Kameri2002). Conservation remains one of the key national obligations of the Kenya Government (Mugabe et al. Reference Mugabe, Marekia, Mukii, Mugabe and Clark1998; Kameri, Reference Kameri2002) but the country’s protected areas are facing many threats (Smith, Reference Smith1999; Johnstone, Reference Johnstone2000; Okello & Kiringe, Reference Okello and Kiringe2004).
Most of these threats are associated with the increasing human population (Mwale, Reference Mwale2000). Since the 1970s the demand for agricultural land has shifted to savannah rangelands of low agricultural potential that are also prime wildlife ecosystems (Galaty, Reference Galaty1992; Fratkin, Reference Fratkin1994; Sindiga, Reference Sindiga1995; Mwale, Reference Mwale2000). Consequently, where agriculture is the predominant land use there has been substantial alteration and loss of wildlife habitats (Kameri, Reference Kameri2002). This has also created problems such as competition for water, human-wildlife conflicts, habitat fragmentation, blocking of wildlife migratory routes and dispersal areas, and negative perceptions of both wildlife and conservation (Nyeki, Reference Nyeki1993; Sindiga, Reference Sindiga1995; Norton-Griffiths, 1997; Campbell et al., Reference Campbell, Gichohi, Mwangi and Chege2000; Ottichilo, 2000).
The Kenya Wildlife Service has limited resources to manage the country’s protected areas, and would benefit from information that could facilitate the prioritization of management activities based on the severity of threats and the vulnerability of protected areas. An alternative approach would be for the Wildlife Service to strengthen strategies that address the plight of rural communities living adjacent to protected areas by integrating conservation and local community development needs (Beresford & Phillips, Reference Beresford and Phillips2000). This latter paradigm has been popularized by IUCN, which has developed categories of protected areas that allow resource extraction by local communities (Locke & Dearden, Reference Locke and Dearden2005). Nevertheless, Locke & Dearden (Reference Locke and Dearden2005) caution that this new paradigm could undermine the role of protected areas in conserving biodiversity.
There exists a variety of tools (Hockings, Reference Hockings2003; Parrish et al., Reference Parrish, Braun and Unnasch2003; Stolton et al., Reference Stolton, Hokings, Dudley, MacKinnon and Whitten2003) and case studies (Singh, Reference Singh1999; Bruner et al., Reference Bruner, Gullison, Rice and Fonseca2001; Diqiang et al., Reference Diqiang, Jinhua, Ke, Bo and Chunquan2003; Ervin, Reference Ervin2003; Tsering, Reference Tsering2003, Tyrlyshkin et al., Reference Tyrlyshkin, Blagovidov and Belokurov2003) that have addressed the issues of protected area management effectiveness and setting of management priorities. However, most case studies have addressed these issues outside Africa, and only a few (Ervin, Reference Ervin2003; Goodman, Reference Goodman2003) have focused on African protected areas, in particular South Africa. These studies have examined a variety of areas critical for effective management of protected areas: management planning (legal security, objectives of the protected area, design of protected areas, enforcement), inputs (staffing, infrastructure, and finances), processes (research, monitoring, decision making processes), and threats and pressures operating against protected areas. This approach provides protected area managers with important tools that help to assess the effectiveness of protected areas in conserving biodiversity.
Bruner et al. (Reference Bruner, Gullison, Rice and Fonseca2001) and Parrish et al. (Reference Parrish, Braun and Unnasch2003) noted that protected area managers are increasingly being compelled to assess their effectiveness in enhancing biodiversity conservation. Such assessments require both a strong scientific basis and a practical approach, and should facilitate comparisons between protected areas. The effectiveness of protected areas is closely related to certain basic aspects of management such as compensation for local communities who partly shoulder problems emanating from wildlife, intensified security and law enforcement, and allocating sufficient financial resources for management purposes (Bruner et al., Reference Bruner, Gullison, Rice and Fonseca2001; Parrish et al., Reference Parrish, Braun and Unnasch2003).
Here we examine the effectiveness of protected area management in Kenya by focusing on threats and pressures. Our specific objectives were to: (1) establish the relative severity of threats previously identified by protected area managers, (2) prioritize and rank protected areas based on their relative vulnerability to these threats, and (3) explore the implications of these findings for the management of Kenya’s protected areas.
Methods
We assessed the relative severity of threats to Kenya’s protected areas using the perceptions of protected area officers, i.e. we used expert opinion to assess the effectiveness of protected area management, an approach that has been used in a similar way elsewhere (Ervin, Reference Ervin2003; Goodman, Reference Goodman2003; Stolton et al., Reference Stolton, Hokings, Dudley, MacKinnon and Whitten2003). Four officers from each protected area were interviewed in person: the park warden, community warden, senior ranger, and a research scientist. These officers had all served continuously for >5 years. Interviews were conducted over 6 months in 2002, following a preliminary study (Okello & Kiringe, Reference Okello and Kiringe2004).
The threat categories used (Table 1) were developed in a preliminary study (Okello & Kiringe, Reference Okello and Kiringe2004) of the perceptions of the same protected area officers. In the present study we requested them to score, independently of each other, the relative severity of each threat, on a scale of 1–5 (1, no threat; 2, mild threat; 3, moderate threat; 4, high threat; 5, severe threat), to the protected areas they served. We assumed that protected area managers’ collective but independent scoring of threats would provide a representative score for a particular threat in a given protected area. The officers only scored the level of severity of threat factors associated with their own protected area. All 50 protected areas (Parks and Reserves) in Kenya were included so as to provide a national ranking of protected areas based on the perceived severity of threats.
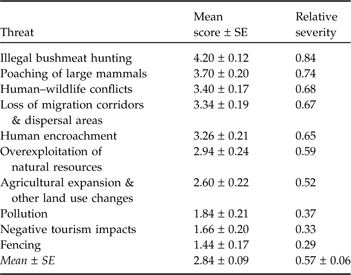
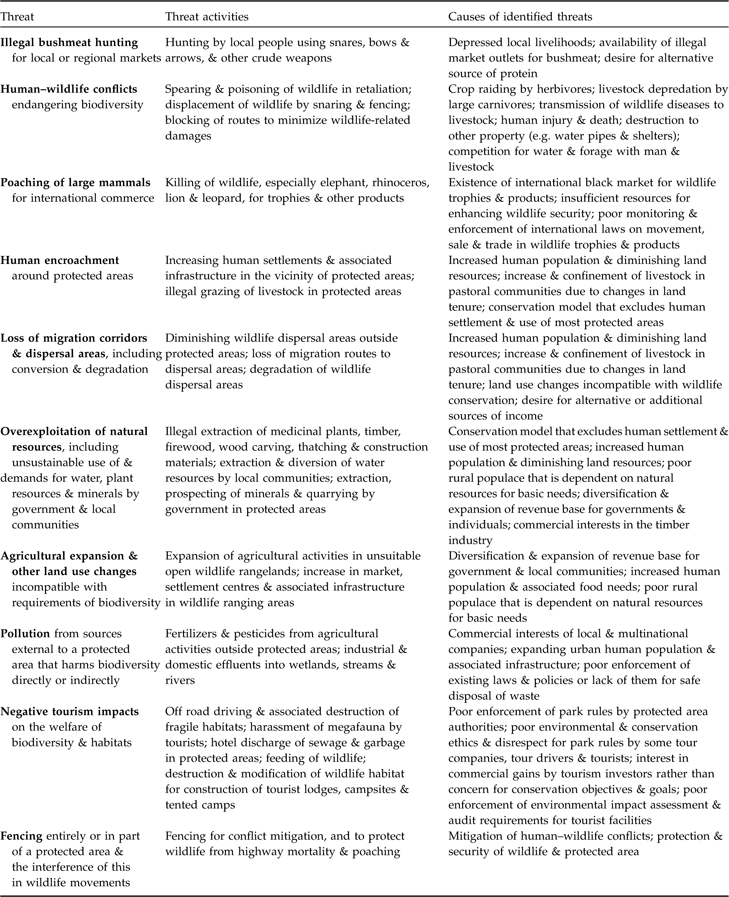
The 10 main threats to Kenya’s protected areas, as perceived by the expert opinion of protected area managers (from Okello & Kiringe, Reference Okello and Kiringe2004), with the activities and causes associated with each threat. The phrase in bold for each threat is the short name of the threat used in Table 2 and for discussion in the text.
We calculated three indicators of the level of threat and the vulnerability of protected areas to these threats: (i) mean score of each threat = sum of all the scores for a threat / the total number of respondents (200); (ii) relative severity of each threat = the mean score for a threat / the maximum possible score (5); (iii) relative vulnerability of a protected area = total score of the 10 threats for a given protected area) / total responses (40). A ranking system based on relative severity was used to indicate which of the threats were more serious across all protected areas, and a ranking based on relative vulnerability was used to show which protected areas were most vulnerable to the identified threats. The relationship of each of the 10 threats with relative vulnerability was examined with a non–parametric Spearman rank correlation (Zar, Reference Zar1999). Comparisons of the vulnerability of protected areas in different ecosystem types and the predominant adjacent land uses was carried out using a non–parametric Kruskal–Wallis test followed by a box–and–whisker multiple comparison procedure (Zar, Reference Zar1999). All statistical analysis was carried out with STATGRAPHICS v. 4.0 (StatPoint, Inc., Herndon, USA).
Results
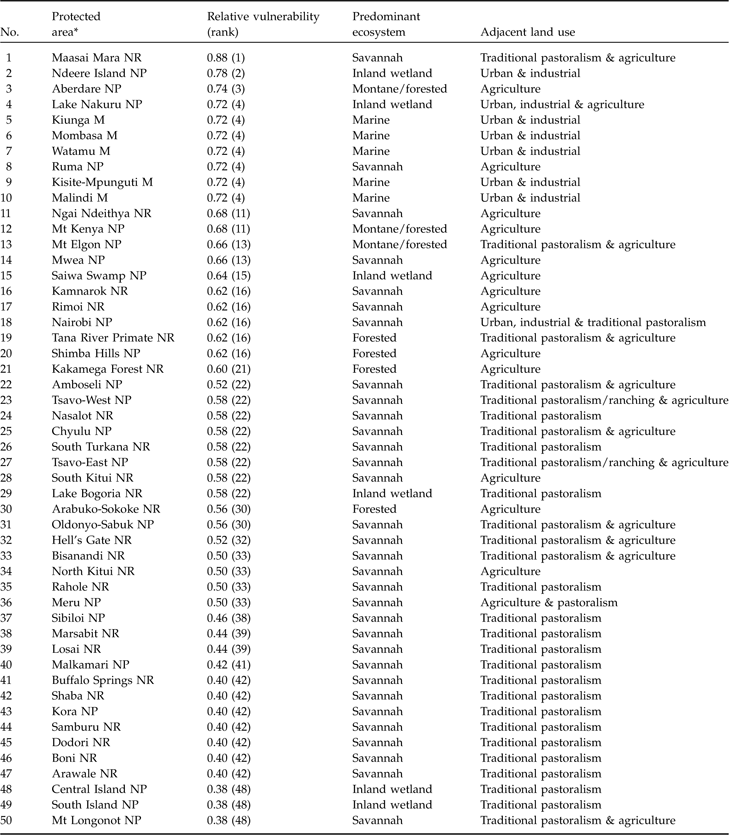
The protected areas of Kenya face 10 major threats (Table 1) with a range of relative severity of 0.29–0.84 (Table 2). Thirty-six (72%) of the 50 protected areas had a relative vulnerability of ≥0.5, 21 (42%) ≥0.6, and 10 (20%) ≥0.70 (Table 3). The threats with the highest relative severity (i.e. >0.5), from higher to lower, were illegal bushmeat hunting, poaching of large mammals, human–wildlife conflicts, loss of migration corridors and dispersal areas, human encroachment, overexploitation of natural resources, and agriculture expansion and other land use changes (Table 2). A majority of Kenya’s protected areas were vulnerable to most of the 10 threats. Thirty-two (64% of protected areas) were vulnerable to >5 of the threats, 27 (54%) to >6 threats, 16 (32%) to >7 threats, and 3 (6%) to >8 threats. Table 3 lists the 50 protected areas by relative vulnerability, ranked from the most (Masai-Mara National Reserve) to the least (Mt Longonot National Park) vulnerable.
The mean score and relative severity (see text for details) of 10 threat factors (Table 1), as assessed by the expert opinion of four protected area officers (see text for details) in each of Kenya’s 50 protected areas, ranked from high to low relative severity.

Relative vulnerability (see text for details) of Kenya’s 50 protected areas (numbers correspond to those in Fig. 1), ranked from the most to the least vulnerable, with the predominant ecosystem type, and predominant land use in adjacent areas.

* M, Marine; NP, National Park; NR, National Reserve
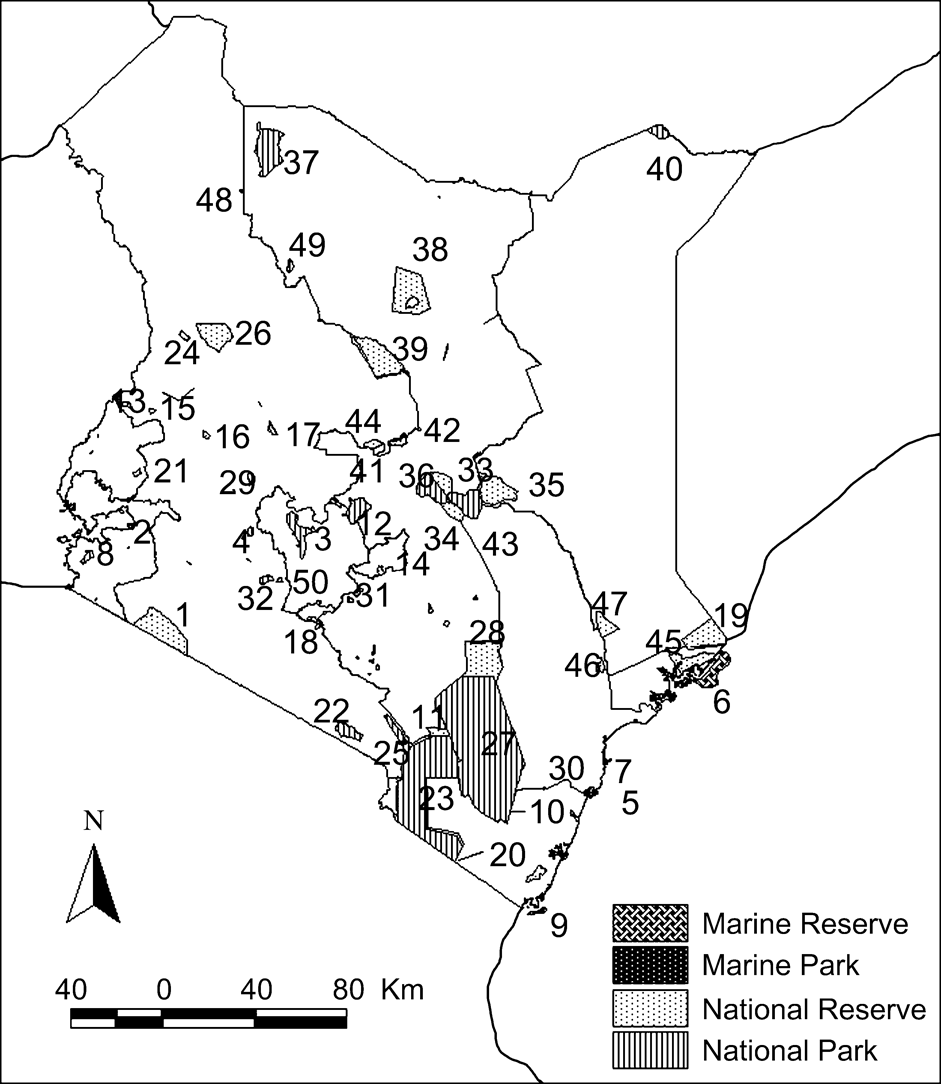
The network of 50 protected areas (numbered) in Kenya. See Table 3 for names of individual areas and further details.

The protected areas most vulnerable were marine ecosystems (mean relative vulnerability of 0.72 ± SE 0.01) followed by forested/montane ecosystems (0.64 ± SE 0.02), inland wetlands (0.60 ± 0.07) and savannahs (0.52 ± SE 0.02). Overall, relative vulnerability differed significantly between ecosystem types (Kruskal–Wallis, H = 15.68, P = 0.0013), and there were significant differences in relative vulnerability between marine and savannah ecosystems (P <0.005). In terms of surrounding land uses, protected areas with adjacent urban/industrial areas were the most vulnerable (with a mean relative vulnerability of 0.72 ± SE 0.02), followed by those with adjacent agriculture (0.61 ± SE 0.02) and pastoralism (0.47 ± SE 0.02). There were significant differences in the relative vulnerability of protected areas with differing adjacent land uses (H = 28.0029, P <0.001).
There was a positive and significant correlation between the relative vulnerability of protected areas and human encroachment (r = 0.90, P <0.001), agricultural expansion and other land use changes (r = 0.75, P <0.001), overexploitation of natural resources (r = 0.73, P <0.001), pollution (r = 0.59, P <0.0001), negative tourism impacts (r = 0.46, P = 0.012), fencing (r = 0.38, P = 0.0084), and human–wildlife conflicts (r = 0.28, P <0.0049). Relative vulnerability of protected areas was best predicted by human encroachment (accounting for 75.73% of vulnerability), followed by overexploitation of natural resources (9.01%) and human-wildlife conflicts (4.94%).
Discussion
Direct threats to biodiversity in Kenya, such as illegal bushmeat hunting, poaching of large mammals, and human–wildlife conflicts, were perceived by protected area officers as being greater than indirect threats. However, analysis of the relationship between relative threat severity and protected area relative vulnerability revealed that indirect threats (such as human and agriculture encroachment, tourism impacts and pollution) were the most serious. Generally, direct threats will more strongly influence perceptions of the severity of threats than indirect threats but the effects of the latter are more long-term. Whereas direct threats may harm biodiversity alone, indirect threats affect both biota and their habitats.
In a similar study Ervin (Reference Ervin2003) identified key threats for protected areas in South Africa as invasion by alien plant species, protected area isolation, poaching, land use changes and tourism impacts. Goodman (Reference Goodman2003) reported alien species, protected area isolation, land use changes, diseases, bush encroachment and resource utilization as key threats to protected areas in KwaZulu–Natal in South Africa. The threats and pressures identified in these two studies are mostly indirect, and thus consistent with our results.
Based on our findings we suggest two strategies to mitigate the threats facing Kenya’s protected areas. The first is to manage direct threats (such as poaching and human–wildlife conflicts) across all protected areas to halt direct persecution of wildlife and to secure protected areas as safe enclaves of conservation. The second strategy (which can be pursued concurrently) is to address the long–term threats (such as protected area isolation, human encroachment, conversion and blockage of dispersal areas and migration corridors) through approaches such as direct payments, economic incentives or lease programmes negotiated with land owners (McNeely, Reference McNeely1993; Norton–Griffiths & Southey, 1995; Emerton, Reference Emerton2000; Ferraro & Kiss, Reference Ferraro and Kiss2002), community conservation initiatives (Hackel, Reference Hackel1999; Adams & Hulme, Reference Adams and Hulme2001), integrated land use planning (Lusigi, Reference Lusigi1981; Mwangi, Reference Mwangi1995), and integrating conservation of biodiversity in regional development (Alpert, Reference Alpert1996; Beresford & Phillips, Reference Beresford and Phillips2000; Newmark & Hough, Reference Newmark and Hough2000). Compensation for damage by wildlife and costs to contain poverty and negative attitudes (Sindiga, Reference Sindiga1995; Seno & Shaw, Reference Seno and Shaw2002) could be part of these strategies.
The consequences of the loss of natural habitats and ranging space (Burkey, Reference Burkey1994; Newmark, Reference Newmark1996; Fahrig, Reference Fahrig1997), isolation of protected areas (Western & Ssemakula, Reference Western and Ssemakula1981; Newmark, Reference Newmark1993, Reference Newmark1996; Western, Reference Western1997), land use changes and associated human–wildlife conflicts (KWS, 1994; Sindiga, Reference Sindiga1995; Seno & Shaw, Reference Seno and Shaw2002), and competition for land and its resources (Makombe, Reference Makombe1993; Campbell et al., Reference Campbell, Gichohi, Mwangi and Chege2000; Okello, Reference Okello2005a,Reference Okellob) could already be causing local extinctions in East African protected areas. These challenges require intervention so as to secure protected areas (Osemeobo, Reference Osemeobo1993).
It is also critical to identify the most vulnerable protected areas, especially where resources and manpower are scarce. Our findings indicate that the Maasai Mara National Reserve, and Ndeeri Island and Lake Nakuru National Parks are the most vulnerable. The management issues for Maasai Mara National Reserve include surrounding land use changes, wildlife poaching, bushmeat hunting and negative tourism impacts. Lake Nakuru National Park needs to manage the consequences of being fenced and the pollution from Nakuru town. Of particular concern for this Park, which is a World Heritage Site and a Ramsar wetland site, is that its lake is shrinking because of the destruction of the catchment areas of the rivers that drain into it.
Our analysis did not identify negative tourism impacts, sometimes viewed as a significant threat to biodiversity (Smith, Reference Smith1999; Johnstone, Reference Johnstone2000), as a major threat. This is possibly because only 32% of Kenya’s protected areas have tourism potential and only 24% of them have achieved or exceeded this potential (Okello et al., Reference Okello, Wishitemi and Mwinzi2001). Tourism is concentrated heavily in a few protected areas that are easily accessible and have tourist facilities and a diverse large mammal fauna (Okello et al., Reference Okello, Wishitemi and Lagat2005). However, the potential of tourism as a management threat was apparent from its correlation with the relative vulnerability of protected areas. A majority of protected areas popular with tourists ranked high based on susceptibility to this threat. Diversifying tourism to target cultural, historical and archeological sites could help reduce pressure on protected areas (Okello et al., Reference Okello, Wishitemi and Lagat2005), together with targeting few but high-paying tourists through price adjustments for vulnerable protected areas such as Amboseli.
Mitigation should also focus on protected areas that represent vulnerable habitats and ecosystems. For example, marine protected areas face a multiplicity of threat factors. The Kenyan coast is one of the hubs of the country’s tourist industry but marine biodiversity is particularly fragile and sensitive to human impacts such as pollution, live specimen collection and habitat destruction (McClanahan, Reference McClanahan, McClanahan and Young1996). Nesting sites for threatened species such as marine turtles are some of the key sensitive habitats where tourism needs to be regulated. In addition, estuaries have become silted because of increased upstream deforestation of riverine vegetation along major rivers such as the Tana and Galana (Terer et al., Reference Terer, Ndiritu and Gichuki2004).
Other particularly vulnerable protected areas are natural forests, mountains and wetlands, all of which are susceptible to conversion into agriculture and settlement. These ecosystems are critical for providing ecological services. Forests have faced numerous excisions for resettling landless people and for agriculture (Cooper, Reference Cooper, McClanahan and Young1996; Chapman & Chapman, Reference Chapman, Chapman, McClanahan and Young1996) and are being further degraded through a variety of land uses such as livestock grazing, deforestation and charcoal burning. In particular, three protected areas in the montane forest ecosystem (Aberdares, Mt Elgon and Mt Kenya) and two protected areas in natural forests (Kakamega and Shimba Hills) were categorized as vulnerable by our findings.
Okello & Kiringe (Reference Okello and Kiringe2004) identified the factors threatening Kenya’s protected areas, and the present study has examined the relative severity of these threats and the vulnerability of protected areas using expert opinion. The final stage in this process will be to undertake surveys to quantify the magnitude, severity and extent of each of the threats identified for each protected area. To determine the severity of each threat factor appropriately it will be important to identify all manifestations (e.g. number of snares, or number of animals killed per year for bushmeat) and establish which manifestation is the best indicator of the intensity of a given threat factor. However, based on our own observations and our discussions with the officers of each protected area, we believe that our ranking of threat factors will be comparable with actual field assessments.
This information on the effectiveness of protected area management in Kenya can be used by the Kenya Wildlife Service and other protected area authorities (such as county councils that manage game reserves, private wildlife conservancies and sanctuaries) to focus and prioritize management actions to address threats. In April 2007 the Kenya Wildlife Service held a conference that examined research imperatives for biodiversity conservation and management in Kenya. During the conference the findings from this study were considered critical for the focusing of mitigation strategies to reduce the level of threats to biodiversity in Kenya’s network of protected areas.
Acknowledgements
We would like to thank the School for Field Studies, Massachusetts, USA, for providing funds through their professional development programme, and the Centre for Wildlife Management Studies in Kenya for providing research facilities. We also acknowledge the various people who made suggestions and contributed to earlier versions of this paper.