


1. Introduction
The global energy shortage and environmental concerns have motivated continued efforts to develop efficient and clean energy technologies. Flapping-foil energy harvesters, inspired by the mechanisms of natural flight and fish swimming, demonstrate unique advantages of high efficiency, low cost and environmental friendliness, and thus have been considered as a promising technology in renewable energy generation. Several review articles have summarised the research findings on flapping-foil systems (Young, Lai & Platzer Reference Young, Lai and Platzer2014; Xiao & Zhu Reference Xiao and Zhu2014; Wu et al. Reference Wu, Zhang, Tian, Li and Lu2020), with the core focus on improving the energy-harvesting efficiency.
The energy-harvesting efficiency of a flapping-foil energy harvester is governed by a set of dimensionless parameters: the Reynolds number ( $ \textit{Re}$
=
$ \textit{Re}$
= $\rho U c/\mu$
), pitching amplitude (
$\rho U c/\mu$
), pitching amplitude ( $\theta _0$
), heaving amplitude (
$\theta _0$
), heaving amplitude ( $h_0/c$
), pivot location (
$h_0/c$
), pivot location ( $\delta /c$
), reduced frequency (
$\delta /c$
), reduced frequency ( $f^*=f c/U$
) and pitching–heaving phase difference (
$f^*=f c/U$
) and pitching–heaving phase difference ( $\phi$
), where
$\phi$
), where $\rho$
is the fluid density,
$\rho$
is the fluid density, $U$
is the free-stream velocity,
$U$
is the free-stream velocity, $c$
is the chord length,
$c$
is the chord length, $\mu$
is the dynamic viscosity of the fluid and
$\mu$
is the dynamic viscosity of the fluid and $f$
is the pitching frequency. The interplay of these parameters affects the efficiency through modulating the formation and evolution of the leading-edge vortex (LEV). Among these parameters,
$f$
is the pitching frequency. The interplay of these parameters affects the efficiency through modulating the formation and evolution of the leading-edge vortex (LEV). Among these parameters, $ \textit{Re}$
has a relatively minor influence. Although increasing
$ \textit{Re}$
has a relatively minor influence. Although increasing $ \textit{Re}$
slightly enhances LEV formation and energy-harvesting efficiency, the overall efficiency trends and optimal conditions are primarily determined by kinematic parameters (Kinsey & Dumas Reference Kinsey and Dumas2008; Baik et al. Reference Baik, Bernal, Granlund and Ol2012; Ribeiro, Frank & Franck Reference Ribeiro, Frank and Franck2020). This is because the kinematic parameters are crucial in shaping unsteady flow structures, influencing dynamic stall development and governing aerodynamic force generation, as reported by Visbal & Shang (Reference Visbal and Shang1989) who considered the effects of
$ \textit{Re}$
slightly enhances LEV formation and energy-harvesting efficiency, the overall efficiency trends and optimal conditions are primarily determined by kinematic parameters (Kinsey & Dumas Reference Kinsey and Dumas2008; Baik et al. Reference Baik, Bernal, Granlund and Ol2012; Ribeiro, Frank & Franck Reference Ribeiro, Frank and Franck2020). This is because the kinematic parameters are crucial in shaping unsteady flow structures, influencing dynamic stall development and governing aerodynamic force generation, as reported by Visbal & Shang (Reference Visbal and Shang1989) who considered the effects of $f^*$
and
$f^*$
and $\delta /c$
on a rapidly pitching aerofoil. To unify the influence of individual kinematic parameters, Kinsey & Dumas (Reference Kinsey and Dumas2008) employed the maximum effective angle of attack, defined as
$\delta /c$
on a rapidly pitching aerofoil. To unify the influence of individual kinematic parameters, Kinsey & Dumas (Reference Kinsey and Dumas2008) employed the maximum effective angle of attack, defined as $\alpha _{T/4} = \theta _0 - \tan ^{-1}(2\pi h_0 f/U)$
, which combines
$\alpha _{T/4} = \theta _0 - \tan ^{-1}(2\pi h_0 f/U)$
, which combines $h_0$
,
$h_0$
, $\theta _0$
and
$\theta _0$
and $f$
into a single predictive quantity closely correlated with energy-harvesting efficiency. Further insights into the connection between wake dynamics and kinematics were provided by Zhu (Reference Zhu2011), who conducted a spatial instability analysis of the wake and found that the maximum energy-harvesting efficiency occurs when the flapping frequency matches the frequency of the most convectively unstable mode. This instability frequency was also shown to be closely related to
$f$
into a single predictive quantity closely correlated with energy-harvesting efficiency. Further insights into the connection between wake dynamics and kinematics were provided by Zhu (Reference Zhu2011), who conducted a spatial instability analysis of the wake and found that the maximum energy-harvesting efficiency occurs when the flapping frequency matches the frequency of the most convectively unstable mode. This instability frequency was also shown to be closely related to $\alpha _{T/4}$
. Within this framework, Zhu (Reference Zhu2011) further identified optimal values of
$\alpha _{T/4}$
. Within this framework, Zhu (Reference Zhu2011) further identified optimal values of $f^*$
,
$f^*$
, $\phi$
and
$\phi$
and $h_0$
for maximum efficiency, which are consistent with the findings of Kinsey & Dumas (Reference Kinsey and Dumas2008). Kim et al. (Reference Kim, Strom, Mandre and Breuer2017) confirmed that the optimal efficiency consistently occurs when
$h_0$
for maximum efficiency, which are consistent with the findings of Kinsey & Dumas (Reference Kinsey and Dumas2008). Kim et al. (Reference Kim, Strom, Mandre and Breuer2017) confirmed that the optimal efficiency consistently occurs when $\alpha _{T/4}$
lies between
$\alpha _{T/4}$
lies between $30^\circ$
and
$30^\circ$
and $40^\circ$
, regardless of specific kinematic conditions. Baik et al. (Reference Baik, Bernal, Granlund and Ol2012) further examined how
$40^\circ$
, regardless of specific kinematic conditions. Baik et al. (Reference Baik, Bernal, Granlund and Ol2012) further examined how $f^*$
and Strouhal number affect flow dynamics and force generation at a fixed
$f^*$
and Strouhal number affect flow dynamics and force generation at a fixed $\alpha _{T/4}$
, highlighting their respective roles in LEV evolution and circulation strength. In addition to rigid-body kinematics, structural flexibility offers another promising avenue (see e.g. Tian, Young & Lai Reference Tian, Young and Lai2014; Wu et al. Reference Wu, Shu, Zhao and Tian2015; Hoke, Young & Lai Reference Hoke, Young and Lai2015; Liu et al. Reference Liu, Tian, Young and Lai2017; Jeanmonod & Olivier Reference Jeanmonod and Olivier2017). Tian et al. (Reference Tian, Young and Lai2014) demonstrated that passive flexibility provides minimal improvement in power-extraction efficiency, whereas actively controlling the deformation of the leading-edge segment results in a significant enhancement in performance. To elucidate the underlying mechanisms behind such improvements, Hoke, Young & Lai (Reference Hoke, Young and Lai2023) identified three physical processes responsible for efficiency gains in actively morphed foils: modulation of the foil’s projected area, adjustment of the timing of LEV shedding and the approach of the trailing edge closer to the shed vortex during pitching.
$\alpha _{T/4}$
, highlighting their respective roles in LEV evolution and circulation strength. In addition to rigid-body kinematics, structural flexibility offers another promising avenue (see e.g. Tian, Young & Lai Reference Tian, Young and Lai2014; Wu et al. Reference Wu, Shu, Zhao and Tian2015; Hoke, Young & Lai Reference Hoke, Young and Lai2015; Liu et al. Reference Liu, Tian, Young and Lai2017; Jeanmonod & Olivier Reference Jeanmonod and Olivier2017). Tian et al. (Reference Tian, Young and Lai2014) demonstrated that passive flexibility provides minimal improvement in power-extraction efficiency, whereas actively controlling the deformation of the leading-edge segment results in a significant enhancement in performance. To elucidate the underlying mechanisms behind such improvements, Hoke, Young & Lai (Reference Hoke, Young and Lai2023) identified three physical processes responsible for efficiency gains in actively morphed foils: modulation of the foil’s projected area, adjustment of the timing of LEV shedding and the approach of the trailing edge closer to the shed vortex during pitching.
Another way to enhance the energy-harvesting efficiency is to utilise the force drafting between multiple bodies. There are two typical multi-body interactions. The first type is side-by-side arrangement of multiple bodies, where the wake interaction is dominant, such as side-by-side cylinders (Zhou et al. Reference Zhou, Wang, So, Xu and Jin2001; Sumner Reference Sumner2010; Arionfard & Nishi Reference Arionfard and Nishi2018) and flexible plates (Jia et al. Reference Jia, Li, Yin and Yin2007; Tian et al. Reference Tian, Luo, Zhu and Lu2011; Tian Reference Tian2013). The tandem configuration has been considered as an optimal strategy for force reduction ( see e.g. Beal et al. Reference Beal, Hover, Triantafyllou, Liao and Lauder2006; Ristroph & Zhang Reference Ristroph and Zhang2008; Stewart et al. Reference Stewart, Tian, Akanyeti, Walker and Liao2016; Tian et al. Reference Tian, Wang, Wu and Sui2016) and has been extensively studied. Indeed, a body in the wake of a cylinder enjoys a significant reduction in drag or even experiences a net thrust (Beal et al. Reference Beal, Hover, Triantafyllou, Liao and Lauder2006). Later, Kinsey & Dumas (Reference Kinsey and Dumas2012) analysed the effects of the phase difference and the inter-foil spacing on the energy-harvesting efficiency of tandem flapping foils. They introduced the concept of global phase, and demonstrated the importance of optimised configurations for achieving high efficiency. Based on the global phase concept, Ribeiro et al. (Reference Ribeiro, Su, Guillaumin, Breuer and Franck2021) proposed a wake phase model. In this model, the free-stream velocity is replaced by the averaged wake velocity. This modification allows the model to better capture the phase difference between the upstream wake trajectory and the motion of the trailing foil. He et al. (Reference He, Yang, Mo, Zhao, Wang and Ghassemi2022) compared models presented by Kinsey & Dumas (Reference Kinsey and Dumas2012) and Ribeiro et al. (Reference Ribeiro, Su, Guillaumin, Breuer and Franck2021), and systematically investigated the impact of inter-foil spacing in tandem flapping foils. They concluded that increasing the spacing is unnecessary for improving energy extraction as wake energy recovers slowly over long distances. Xu, Xu & Jiao (Reference Xu, Xu and Jiao2024) further improved the wake phase model by using the actual vortex advection velocity instead of the averaged wake velocity to ensure accurate wake wavelength predictions. This revised model unifies the effects of spatial configuration and kinematic parameters. Although tandem configurations have been shown to improve overall system efficiency, Zheng & Bai (Reference Zheng and Bai2022) found that the performance declines as the number of foils increases. They suggested that unaligned arrangements might better exploit vertical spacing and wake interactions, offering greater potential for practical applications.
Existing parametric studies have provided valuable insights into tandem wing design. However, the flow mechanisms through which the incoming vortex modulates trailing-foil loading and energy extraction remain poorly resolved, particularly under conditions involving strong vortex–foil interactions. This knowledge gap becomes more critical in multi-foil systems, in unaligned arrangements and when the trailing-foil kinematics adapt to the upstream wake. For example, Handy-Cardenas, Zhu & Breuer (Reference Handy-Cardenas, Zhu and Breuer2025) classified wake–foil interactions in tandem configurations according to whether the trailing foil avoids or collides with the upstream vortex. They further demonstrated that the heaving amplitude of the trailing foil strongly influences the interaction mode and the energy-harvesting performance. The underlying flow physical mechanisms of these vortex–foil interactions share significant parallels with the unsteady response of aerofoils encountering discrete vortex gusts (Jones & Cetiner Reference Jones and Cetiner2021; Jones, Cetiner & Smith Reference Jones, Cetiner and Smith2022). In such scenarios, both experimental and numerical studies have confirmed that the transient lift response is primarily governed by the gust-induced change in the effective angle of attack (Martínez-Muriel & Flores Reference Martínez-Muriel and Flores2020; Biler et al. Reference Biler, Sedky, Jones, Saritas and Cetiner2021). In nature, insects are masters at exploiting vortex dynamics, often using wake-capture mechanisms to enhance lift or propulsion (Dickinson, Lehmann & Sane Reference Dickinson, Lehmann and Sane1999). In particular, four-wing insects such as dragonflies and damselflies exploit intricate vortex interactions between their forewing and hindwing to enhance flight agility and efficiency (Lehmann Reference Lehmann2008). Maybury & Lehmann (Reference Maybury and Lehmann2004) experimentally revealed the fluid dynamic mechanisms underlying the modulation of lift in four-winged flight. They showed that forewing wake interaction disrupts the hindwing’s LEV and alters the local flow direction and velocity, thereby significantly affecting aerodynamic performance. Usherwood & Lehmann (Reference Usherwood and Lehmann2008) discovered that the appropriate phasing of the fore- and hindwings in dragonflies can improve aerodynamic efficiency by eliminating swirling flows in the wake. This mechanism allows the hindwing to recover the lateral momentum induced by the forewing and redirect it downward, thereby reducing wasted energy and enhancing lift support. Inspired by the studies introduced above, it is reasonable to believe that identifying vortex–foil interaction modes facilitates a more effective extraction of the wake energy.
Efficient energy harvesting in tandem-wing systems often involves avoiding direct interactions with vortices. Young et al. (Reference Young, Tian, Liu, Lai, Nadim and Lucey2020) demonstrated that the unsteady wake generated by the leading foil can enable the system to exceed the Betz limit. However, it remains challenging to effectively exploit such unsteady effects. Constructive interactions between the trailing foil and the wake structures shed by the upstream foil require precise kinematic control, informed by the characteristics of the wake, while detailed investigations into the interactions between incoming vortices and trailing foils remain limited. In particular, the influence of these interactions on the unsteady force acting on the trailing foil, as well as their potential to enhance energy harvesting, is not yet well understood.
This study investigates the energy-harvesting performance of two flapping foils in tandem and staggered arrangements, focusing on identifying the vortex–foil interaction modes based on which a predictive framework for energy harvesting can be developed. The objective is to elucidate the mechanisms of vortex–foil interactions and to explore strategies for extracting unsteady kinetic energy from the wake of the leading foil. We aim to identify both constructive and destructive interactions and to understand the mechanisms responsible for force variation on the trailing foil. To achieve this, the force and moment partitioning method (FMPM) (Menon & Mittal Reference Menon and Mittal2021a , Reference Menon and Mittalb , Reference Menon and Mittalc ) is employed to quantify force generation and power extraction, offering insights into the fundamental physics of vortex–foil interaction. This method enables intuitive evaluation of energy-harvesting performance through the visualisation of vortex structures in the flow field. Based on the observed wake characteristics, it also guides the design of optimised trailing-foil kinematics for efficient wake energy utilisation.
The rest of the paper is organised as follows. The physical model and numerical methods are described in § 2. In § 3.1, we investigate the mechanisms of vortex–foil interaction and identify both constructive and destructive interaction modes. In § 3.2, a mechanism-based predictive framework is proposed and applied to two foils under varied kinematic and wake conditions. Finally, concluding remarks are provided in § 4.
2. Physical model and numerical methods
2.1. Physical model
The NACA 0015 foil with chord length $c$
is considered, as shown in figure 1. The pitch axis is at
$c$
is considered, as shown in figure 1. The pitch axis is at $c/3$
from the leading edge. To facilitate the introduction of the kinematics and discussions, we introduce the index
$c/3$
from the leading edge. To facilitate the introduction of the kinematics and discussions, we introduce the index $i$
to denote the foils:
$i$
to denote the foils: $i=1$
represents the leading foil and
$i=1$
represents the leading foil and $i=2$
denotes the trailing one. The pitching and heaving motions of the flapping foil are prescribed by the following equations:
$i=2$
denotes the trailing one. The pitching and heaving motions of the flapping foil are prescribed by the following equations:
 \begin{align} &\theta _i(t)=\theta _{0i} \sin {(2 \pi f t+\phi _i)}, \\[-10pt] \nonumber \end{align}
 \begin{align} &h_i(t)=h_{0i} \sin {(2 \pi f t+\pi /2+\phi _i)+L_{yi}}, \\[10pt] \nonumber \end{align}
where $f$
is the flapping frequency,
$f$
is the flapping frequency, $\phi _i$
is the phase difference and
$\phi _i$
is the phase difference and $h_{0i}$
and
$h_{0i}$
and $\theta _{0i}$
denote the heaving and pitching amplitudes, respectively. Here a phase difference of
$\theta _{0i}$
denote the heaving and pitching amplitudes, respectively. Here a phase difference of $\pi /2$
is set between the pitching and heaving motions, following the work of Kinsey & Dumas (Reference Kinsey and Dumas2008). The phase difference between the leading and trailing foils is defined as
$\pi /2$
is set between the pitching and heaving motions, following the work of Kinsey & Dumas (Reference Kinsey and Dumas2008). The phase difference between the leading and trailing foils is defined as $\phi _{1-2}=\phi _1-\phi _2$
, while the inter-foil spacings in the
$\phi _{1-2}=\phi _1-\phi _2$
, while the inter-foil spacings in the $x$
and
$x$
and $y$
directions are represented by
$y$
directions are represented by $\Delta L_x=L_{x2}-L_{x1}$
and
$\Delta L_x=L_{x2}-L_{x1}$
and $\Delta L_y=L_{y2}-L_{y1}$
, respectively.
$\Delta L_y=L_{y2}-L_{y1}$
, respectively.
Schematic of two flapping foils.

The effective angle of attack $\alpha (t)$
is presented as follows (Kinsey & Dumas Reference Kinsey and Dumas2008):
$\alpha (t)$
is presented as follows (Kinsey & Dumas Reference Kinsey and Dumas2008):
 \begin{align} \alpha (t)=\arctan {(-\dot {h}(t)/U)}-\theta (t), \end{align}
where $\dot {h}(t)$
denotes the heaving velocity.
$\dot {h}(t)$
denotes the heaving velocity.
To facilitate the discussion of energy-harvesting performance, the instantaneous lift coefficient ( $C_L$
), moment coefficient (
$C_L$
), moment coefficient ( $C_M$
) and power coefficient (
$C_M$
) and power coefficient ( $C_P$
) are defined as
$C_P$
) are defined as
 \begin{align} C_L=\frac {F_y(t)}{\frac {1}{2}\rho U^2 c}, \quad C_M= \frac {M(t)}{\frac {1}{2}\rho U^2 c^2}, \quad C_P=\frac {P(t)}{\frac {1}{2}\rho U^3 c}=C_L\frac {\dot {h}(t)}{U}+C_M\frac {\dot {\theta }(t)c}{U}, \end{align}
where $F_y(t)$
is the lift,
$F_y(t)$
is the lift, $M(t)$
is the moment,
$M(t)$
is the moment, $P(t)$
is the power extracted from the flow and
$P(t)$
is the power extracted from the flow and $\dot {\theta }(t)$
is the pitching velocity. As the foils are rigid,
$\dot {\theta }(t)$
is the pitching velocity. As the foils are rigid, $P(t)=F_y(t)\dot {h}(t)+M(t)\dot {\theta }(t)$
. The average value of a coefficient
$P(t)=F_y(t)\dot {h}(t)+M(t)\dot {\theta }(t)$
. The average value of a coefficient $C$
is calculated over
$C$
is calculated over $m$
cycles according to
$m$
cycles according to
 \begin{align} \bar {C}=\frac {1}{m\,T}\int _t^{t+m\,T}C(t)\,\text{d}t, \end{align}
where $m$
is a positive integer and
$m$
is a positive integer and $T$
is the period of one complete oscillation.
$T$
is the period of one complete oscillation.
The efficiency of power generation is commonly measured as the ratio of the cycle-averaged power output $\bar {P}$
to the power available in the flow through the frontal area swept by the foil:
$\bar {P}$
to the power available in the flow through the frontal area swept by the foil:
 \begin{align} \eta =\frac {\bar {P}}{\frac{1}{2}\rho U^3 d}=\bar {C_P}\frac {c}{d}, \end{align}
where $d$
is the largest total distance swept by the foil. For the efficiency of an unaligned multiple foil configuration, the extra swept area should be considered.
$d$
is the largest total distance swept by the foil. For the efficiency of an unaligned multiple foil configuration, the extra swept area should be considered.
2.2. Governing equations and numerical method
The recursive regularised lattice Boltzmann method (LBM) (Aidun & Clausen Reference Aidun and Clausen2010; Krüger et al. Reference Krüger, Kusumaatmaja, Kuzmin, Shardt, Silva and Viggen2017; Wang, Liu & Rajamuni Reference Wang, Liu and Rajamuni2023), combined with an iterative feedback immersed boundary method (Peskin Reference Peskin2002; Mittal & Iaccarino Reference Mittal and Iaccarino2005; Huang & Tian Reference Huang and Tian2019; Griffith & Patankar Reference Griffith and Patankar2020; Verzicco Reference Verzicco2023), is employed to calculate the fluid dynamics which is described by the incompressible Navier–Stokes equations:
 \begin{align} & \boldsymbol{\nabla }\boldsymbol{\cdot }\boldsymbol{u}=0, \\[-12pt] \nonumber \end{align}
 \begin{align} & \rho \left (\frac {\partial \boldsymbol{u}}{\partial t}+\boldsymbol{u}\boldsymbol{\cdot }\boldsymbol{\nabla }\boldsymbol{u}\right )=-\boldsymbol{\nabla }p +\mu \boldsymbol{\nabla} ^2 \boldsymbol{u}+\boldsymbol{f}, \\[10pt] \nonumber \end{align}
where $\boldsymbol{u}$
denotes the velocity,
$\boldsymbol{u}$
denotes the velocity, $p$
represents the pressure and
$p$
represents the pressure and $\boldsymbol{f}$
represents the body force.
$\boldsymbol{f}$
represents the body force.
In the LBM, the discretised lattice Boltzmann equation is used (He, Chen & Doolen Reference He, Chen and Doolen1998):
 \begin{align} f_i(\boldsymbol{x}+\boldsymbol{c_i}\Delta t, t+\Delta t)-f_i(\boldsymbol{x},t)=-\frac {1}{\tau }\left [f_i(\boldsymbol{x},t)-f_i^{\textit{eq}}(\boldsymbol{x},t)\right ]+\left (1-\frac {1}{2\tau }\right )F_i \Delta t, \end{align}
where $f_i(\boldsymbol{x},t)$
denotes the particle distribution function,
$f_i(\boldsymbol{x},t)$
denotes the particle distribution function, $f_i^{\textit{eq}}(\boldsymbol{x},t)$
represents the equilibrium distribution,
$f_i^{\textit{eq}}(\boldsymbol{x},t)$
represents the equilibrium distribution, $\boldsymbol{c_i}$
is the discrete lattice velocity,
$\boldsymbol{c_i}$
is the discrete lattice velocity, $\Delta t$
is the lattice time step,
$\Delta t$
is the lattice time step, $\tau =\mu /(\rho c_s^2 \Delta t)+1/2$
is the relaxation time,
$\tau =\mu /(\rho c_s^2 \Delta t)+1/2$
is the relaxation time, $c_s=\Delta x/(\Delta t \sqrt {3})$
is the ideal speed of sound for the LBM in lattice units with
$c_s=\Delta x/(\Delta t \sqrt {3})$
is the ideal speed of sound for the LBM in lattice units with $\Delta x$
being the lattice spacing and
$\Delta x$
being the lattice spacing and $F_i$
accounts for the discrete lattice effects induced by the body force density
$F_i$
accounts for the discrete lattice effects induced by the body force density $\boldsymbol{f}$
.
$\boldsymbol{f}$
.
In the regularisation procedure, redundant high-order non-equilibrium components that are unnecessary for the flows considered in this work are removed. The distribution function $f_i$
is then decomposed into its equilibrium component,
$f_i$
is then decomposed into its equilibrium component, $f_i^{(0)}=f_i^{\textit{eq}}$
, and first-order non-equilibrium component,
$f_i^{(0)}=f_i^{\textit{eq}}$
, and first-order non-equilibrium component, $f_i^{(1)}$
, with an additional term to account for the body force contribution (Latt & Chopard Reference Latt and Chopard2006):
$f_i^{(1)}$
, with an additional term to account for the body force contribution (Latt & Chopard Reference Latt and Chopard2006):
 \begin{align} f_i=f_i^{(0)}+f_i^{(1)}-\frac {\Delta t}{2}F_i. \end{align}
Substituting (2.10) into (2.9), the equation becomes (Coreixas et al. Reference Coreixas, Wissocq, Puigt, Boussuge and Sagaut2017)
 \begin{align} f_i(\boldsymbol{x}+\boldsymbol{c_i}\Delta t, t+\Delta t)=f_i^{(0)}(\boldsymbol{x}, t)+\left (1-\frac {1}{\tau }\right )f_i^{(1)}+\frac {\Delta t}{2}F_i. \end{align}
Through projecting the distribution function onto Hermite bases, the equilibrium distribution function $f_i^{(0)}$
and non-equilibrium distribution function
$f_i^{(0)}$
and non-equilibrium distribution function $f_i^{(1)}$
can be represented as expansions of Hermite polynomials up to an arbitrary order N:
$f_i^{(1)}$
can be represented as expansions of Hermite polynomials up to an arbitrary order N:
 \begin{align} f_i^{(0)}\approx \omega _i\sum _{n=0}^N\frac {1}{n!}\boldsymbol{a}_0^{(n)}:\mathcal{H}_i^{(n)}, \quad f_i^{(1)}\approx \omega _i\sum _{n=2}^N\frac {1}{n!}\boldsymbol{a}_1^{(n)}:\mathcal{H}_i^{(n)}, \end{align}
where $\omega _i$
is the weight function, coefficients
$\omega _i$
is the weight function, coefficients $\boldsymbol{a}_0^{(n)}$
and
$\boldsymbol{a}_0^{(n)}$
and $\boldsymbol{a}_1^{(n)}$
denote the
$\boldsymbol{a}_1^{(n)}$
denote the $n$
th-order Hermite coefficients of
$n$
th-order Hermite coefficients of $f_i^{(0)}$
and
$f_i^{(0)}$
and $f_i^{(1)}$
, respectively,
$f_i^{(1)}$
, respectively, $\mathcal{H}_i^{(n)}$
corresponds to the
$\mathcal{H}_i^{(n)}$
corresponds to the $n$
th-order Hermite polynomial tensor associated with the discrete velocity and the colon symbol ‘:’ denotes tensor contraction, summing over all indices to combine
$n$
th-order Hermite polynomial tensor associated with the discrete velocity and the colon symbol ‘:’ denotes tensor contraction, summing over all indices to combine $\boldsymbol{a}^{(n)}$
and
$\boldsymbol{a}^{(n)}$
and $\mathcal{H}_i^{(n)}$
. Further details and comprehensive formulations can be found in Coreixas et al. (Reference Coreixas, Wissocq, Puigt, Boussuge and Sagaut2017) and Rajamuni et al. (Reference Rajamuni, Liu, Wang, Ravi, Young, Lai and Tian2024). The force term
$\mathcal{H}_i^{(n)}$
. Further details and comprehensive formulations can be found in Coreixas et al. (Reference Coreixas, Wissocq, Puigt, Boussuge and Sagaut2017) and Rajamuni et al. (Reference Rajamuni, Liu, Wang, Ravi, Young, Lai and Tian2024). The force term $F_i$
follows the formulation of Guo, Zheng & Shi (Reference Guo, Zheng and Shi2002):
$F_i$
follows the formulation of Guo, Zheng & Shi (Reference Guo, Zheng and Shi2002):
 \begin{align} F_i=\omega _i\left [\frac {\boldsymbol{c_i}-\boldsymbol{u}}{c_s^2}+\frac {\boldsymbol{c_i}\boldsymbol{\cdot }\boldsymbol{u}}{c_s^4}\boldsymbol{c_i}\right ]\boldsymbol{\cdot }\boldsymbol{f}. \end{align}
For the D2Q9 lattice model, these weights $\omega _i$
are defined as
$\omega _i$
are defined as $\omega _0=4/9$
,
$\omega _0=4/9$
, $\omega _i=1/9$
for
$\omega _i=1/9$
for $i=1 \ \text{to}\ 4$
and
$i=1 \ \text{to}\ 4$
and $\omega _i=1/36$
for
$\omega _i=1/36$
for $i=5 \ \text{to}\ 8$
. To optimise the computational efficiency, a geometry-adaptive mesh refinement framework (Xu et al. Reference Xu, Tian, Young and Lai2018) is employed. Data transfer between different mesh blocks is facilitated using a multi-block technique (Yu, Mei & Shyy Reference Yu, Mei and Shyy2002), defined as follows:
$i=5 \ \text{to}\ 8$
. To optimise the computational efficiency, a geometry-adaptive mesh refinement framework (Xu et al. Reference Xu, Tian, Young and Lai2018) is employed. Data transfer between different mesh blocks is facilitated using a multi-block technique (Yu, Mei & Shyy Reference Yu, Mei and Shyy2002), defined as follows:
 \begin{align} &\tilde {f_i}^{(c)}=f_i^{(0, f)}+m\frac {\tau _c-1}{\tau _f}f_i^{(1,f)}, \\[-12pt] \nonumber \end{align}
 \begin{align} &\tilde {f_i}^{(f)}=f_i^{(0, c)}+\frac {\tau _f-1}{m\tau _c}f_i^{(1,c)}, \\[10pt] \nonumber \end{align}
where $\tilde {f_i}$
represents the post-collision distribution function, with coarse-grid quantities indicated by the superscript
$\tilde {f_i}$
represents the post-collision distribution function, with coarse-grid quantities indicated by the superscript $c$
and fine-grid quantities by the superscript
$c$
and fine-grid quantities by the superscript $f$
.
$f$
.
The feedback immersed boundary method, as described by Goldstein, Handler & Sirovich (Reference Goldstein, Handler and Sirovich1993) and Huang & Tian (Reference Huang and Tian2019), is employed to handle moving boundaries. To facilitate the description of the method, the following signs are used: $\boldsymbol{x}$
or
$\boldsymbol{x}$
or $\boldsymbol{x}_c$
corresponds to a point in the fluid domain and
$\boldsymbol{x}_c$
corresponds to a point in the fluid domain and $\boldsymbol{X}$
or
$\boldsymbol{X}$
or $\boldsymbol{X}_c$
represents a specific Lagrangian point located on the foil surface. The method is based on the following equations:
$\boldsymbol{X}_c$
represents a specific Lagrangian point located on the foil surface. The method is based on the following equations:
 \begin{align} &\boldsymbol{F}_{\textit{ib}}(s,t)=\beta \rho ({s},t)[\boldsymbol{U} (s,t)-\boldsymbol{U}_{\textit{ib}}(s,t)],\\[-12pt] \nonumber \end{align}
 \begin{align} &\boldsymbol{U}_{\textit{ib}}(s,t)=\int _{ \varOmega } \boldsymbol{u}(\boldsymbol{x},t)\delta (\boldsymbol{x}-\boldsymbol{X}(s,t)){\rm d}{ \boldsymbol{x}}, \\[-12pt] \nonumber \end{align}
 \begin{align} & \boldsymbol{f}(\boldsymbol{x},t)=\int _{ \varGamma } \boldsymbol{F}_{\textit{ib}}(s,t)\delta (\boldsymbol{x}-\boldsymbol{X}(s,t)){\rm d}s, \\[10pt] \nonumber \end{align}
where $\varOmega$
is the fluid domain,
$\varOmega$
is the fluid domain, $\varGamma$
is the fluid–structure interface,
$\varGamma$
is the fluid–structure interface, $s$
is the arc length coordinate along the boundary,
$s$
is the arc length coordinate along the boundary, $\boldsymbol{F}_{\textit{ib}}$
is the Lagrangian force,
$\boldsymbol{F}_{\textit{ib}}$
is the Lagrangian force, $\boldsymbol{U}(s,t)$
is the desired velocity of the immersed boundary,
$\boldsymbol{U}(s,t)$
is the desired velocity of the immersed boundary, $\boldsymbol{U}_{\textit{ib}}$
is the actual immersed boundary velocity interpolated from the surrounding ambient fluid velocity field
$\boldsymbol{U}_{\textit{ib}}$
is the actual immersed boundary velocity interpolated from the surrounding ambient fluid velocity field $\boldsymbol{u}(\boldsymbol{x},t)$
using the Dirac delta function
$\boldsymbol{u}(\boldsymbol{x},t)$
using the Dirac delta function $\delta$
(Peskin Reference Peskin2002) and the constant coefficient
$\delta$
(Peskin Reference Peskin2002) and the constant coefficient $\beta$
, which was analysed by Huang et al. (Reference Huang, Liu, Wang, Ravi, Young, Lai and Tian2022), is the feedback coefficient. To enhance numerical stability and maintain accuracy, a small feedback coefficient is employed alongside several iterations.
$\beta$
, which was analysed by Huang et al. (Reference Huang, Liu, Wang, Ravi, Young, Lai and Tian2022), is the feedback coefficient. To enhance numerical stability and maintain accuracy, a small feedback coefficient is employed alongside several iterations.
2.3. The FMPM
The FMPM is an important tool for identifying key local processes contributing to force and moment (Menon & Mittal Reference Menon and Mittal2021a
,
Reference Menon and Mittalb
,
Reference Menon and Mittalc
; Li & Wu Reference Li and Wu2018; Li et al. Reference Li, Wang, Graham and Zhao2020a
,
Reference Li, Zhao and Grahamb
; Lee et al. Reference Lee, Hsieh, Chang and Chu2012). This method was originally proposed by Quartapelle & Napolitano (Reference Quartapelle and Napolitano1983), and later was extended to flapping wings (see e.g. Moriche, Flores & García-Villalba Reference Moriche, Flores and García-Villalba2017; Menon & Mittal Reference Menon and Mittal2021c
; Menon, Kumar & Mittal Reference Menon, Kumar and Mittal2022; Zhu & Breuer Reference Zhu and Breuer2023; Zhu et al. Reference Zhu, Lee, Kumar, Menon, Mittal and Breuer2023; Kumar, Seo & Mittal Reference Kumar, Seo and Mittal2025). By introducing an auxiliary potential field, the pressure force integrated over the body surface can be replaced with local dynamic processes expressed as a volume integral. Chang (Reference Chang1992) further advanced the theory by decomposing the total force into two components: a body-acceleration part and a vortex-force part. This method was later extended to compressible flows (Chang & Lei Reference Chang and Lei1997), multiple body systems (Chang, Yang & Chu Reference Chang, Yang and Chu2008; Wang et al. Reference Wang, Zhao, Graham and Li2022) and the acoustic partitioning method (Seo et al. Reference Seo, Menon and Mittal2022, Reference Seo, Zhang, Mittal and Cattafesta2023). In this method, the potential field $\varphi$
must satisfy the Laplace equation,
$\varphi$
must satisfy the Laplace equation, $\boldsymbol{\nabla} ^2\varphi =0$
. For the force in the
$\boldsymbol{\nabla} ^2\varphi =0$
. For the force in the $i$
direction,
$i$
direction, $\varphi$
is subject to specific boundary conditions. On the target body surface, it must satisfy
$\varphi$
is subject to specific boundary conditions. On the target body surface, it must satisfy $\boldsymbol{\nabla }\varphi \boldsymbol{\cdot }\boldsymbol{n}=\boldsymbol{n}\boldsymbol{\cdot }\boldsymbol{e_i}$
, where
$\boldsymbol{\nabla }\varphi \boldsymbol{\cdot }\boldsymbol{n}=\boldsymbol{n}\boldsymbol{\cdot }\boldsymbol{e_i}$
, where $\boldsymbol{n}$
is the unit normal vector pointing inward to the body surface and
$\boldsymbol{n}$
is the unit normal vector pointing inward to the body surface and $\boldsymbol{e_i}$
is the unit vector along the
$\boldsymbol{e_i}$
is the unit vector along the $i$
th Cartesian coordinate. On the outer surface and other body surfaces, the condition becomes
$i$
th Cartesian coordinate. On the outer surface and other body surfaces, the condition becomes $\boldsymbol{\nabla }\varphi \boldsymbol{\cdot }\boldsymbol{n}=0$
. When considering moments, the boundary condition on the target body surface is modified to
$\boldsymbol{\nabla }\varphi \boldsymbol{\cdot }\boldsymbol{n}=0$
. When considering moments, the boundary condition on the target body surface is modified to $\boldsymbol{\nabla }\varphi _k\boldsymbol{\cdot }\boldsymbol{n}=[(\boldsymbol{X}-\boldsymbol{X_c})\times \boldsymbol{n}]\boldsymbol{\cdot }\boldsymbol{e_k}$
, as derived by Menon & Mittal (Reference Menon and Mittal2021b). Here,
$\boldsymbol{\nabla }\varphi _k\boldsymbol{\cdot }\boldsymbol{n}=[(\boldsymbol{X}-\boldsymbol{X_c})\times \boldsymbol{n}]\boldsymbol{\cdot }\boldsymbol{e_k}$
, as derived by Menon & Mittal (Reference Menon and Mittal2021b). Here, $\boldsymbol{X}$
is the position vector of a point on the surface of the immersed body and
$\boldsymbol{X}$
is the position vector of a point on the surface of the immersed body and $\boldsymbol{X_c}$
represents the rotation centre used for moment calculation. The pressure-induced lift and moment can be written as
$\boldsymbol{X_c}$
represents the rotation centre used for moment calculation. The pressure-induced lift and moment can be written as
 \begin{align} \nonumber \int _Bp\boldsymbol{\cdot }n_y\text{d}S&=-\rho \int _{\partial V}\boldsymbol{n}\boldsymbol{\cdot }\left (\frac{\text{d}\boldsymbol{u}}{\text{d}t}\varphi _y\right )\,\text{d}S+\rho \int _{V_f}[\boldsymbol{\nabla }\boldsymbol{\cdot }(\boldsymbol{u}\boldsymbol{\cdot }\boldsymbol{\nabla }\boldsymbol{u})]\varphi _y \,\text{d}V \\ &\quad +\mu \int _{\partial V}(\boldsymbol{\omega }\times \boldsymbol{n})\boldsymbol{\cdot }\boldsymbol{\nabla }\varphi _y \,\text{d}S, \\[-12pt] \nonumber \end{align}
 \begin{align} \nonumber \int _Bp[(\boldsymbol{X}-\boldsymbol{X_c})\times \boldsymbol{n}]\boldsymbol{\cdot }\boldsymbol{e_k}\,\text{d}S&=-\rho \int _{\partial V}\boldsymbol{n}\boldsymbol{\cdot }\left (\frac{\text{d}\boldsymbol{u}}{\text{d}t}\varphi _k\right )\,\text{d}S+\rho \int _{V_f}[\boldsymbol{\nabla }\boldsymbol{\cdot }(\boldsymbol{u}\boldsymbol{\cdot }\boldsymbol{\nabla }\boldsymbol{u})]\varphi _k \,\text{d}V \\ &\quad +\mu \int _{\partial V}(\boldsymbol{\omega }\times \boldsymbol{n})\boldsymbol{\cdot }\boldsymbol{\nabla }\varphi _k \,\text{d}S, \\[10pt] \nonumber \end{align}
where the volume integral $\rho \int _{V_f}[\boldsymbol{\nabla }\boldsymbol{\cdot }(\boldsymbol{u}\boldsymbol{\cdot }\boldsymbol{\nabla }\boldsymbol{u})]\varphi _y \,\text{d}V$
is the vortex-induced lift denoted by
$\rho \int _{V_f}[\boldsymbol{\nabla }\boldsymbol{\cdot }(\boldsymbol{u}\boldsymbol{\cdot }\boldsymbol{\nabla }\boldsymbol{u})]\varphi _y \,\text{d}V$
is the vortex-induced lift denoted by $f^{\omega }$
.
$f^{\omega }$
.
Lift and power coefficients for $ \textit{Re}=1100$
,
$ \textit{Re}=1100$
, $f^*=0.14$
,
$f^*=0.14$
, $h_0^*=1$
and
$h_0^*=1$
and $\theta _0=76.3^\circ$
: (a) instantaneous lift coefficient and (b) instantaneous power coefficient.
$\theta _0=76.3^\circ$
: (a) instantaneous lift coefficient and (b) instantaneous power coefficient.

2.4. Validation
To validate the present numerical approach, a benchmark case described by Kinsey & Dumas (Reference Kinsey and Dumas2008) is conducted. The simulation parameters are set to match the reference case, with $ \textit{Re}=1100$
,
$ \textit{Re}=1100$
, $f^*=0.14$
,
$f^*=0.14$
, $h_0^*=1$
and
$h_0^*=1$
and $\theta _0=76.3^\circ$
. The simulations are conducted for 12 complete flapping cycles to ensure full development of the flow field. Over the final five cycles, the cycle-to-cycle variation in
$\theta _0=76.3^\circ$
. The simulations are conducted for 12 complete flapping cycles to ensure full development of the flow field. Over the final five cycles, the cycle-to-cycle variation in $\bar {C_P}$
is below 0.5 %, indicating that a periodic state is achieved. Consequently, the flow fields and aerodynamic loads averaged over the last four cycles (
$\bar {C_P}$
is below 0.5 %, indicating that a periodic state is achieved. Consequently, the flow fields and aerodynamic loads averaged over the last four cycles ( $m=4$
) are used to evaluate the performance and power-extraction efficiency. In figure 2, the lift and power coefficients obtained from the surface integrated force and from the FMPM are compared with those reported in the literature. A very good agreement is observed in both amplitude and phase, demonstrating that the unsteady force generation and energy extraction characteristics are accurately captured by the present model.
$m=4$
) are used to evaluate the performance and power-extraction efficiency. In figure 2, the lift and power coefficients obtained from the surface integrated force and from the FMPM are compared with those reported in the literature. A very good agreement is observed in both amplitude and phase, demonstrating that the unsteady force generation and energy extraction characteristics are accurately captured by the present model.
A mesh refinement study is performed to guarantee that the mesh spacing used in this work is fine enough. Three grid resolutions are tested, coarse ( $\Delta x= 0.01c$
), medium (
$\Delta x= 0.01c$
), medium ( $\Delta x= 0.005c$
) and fine (
$\Delta x= 0.005c$
) and fine ( $\Delta x= 0.0025c$
) meshes, corresponding to five, six and seven levels of refinement of the multi-block LBM. In lattice Boltzmann simulations, the time step is inherently linked to the mesh spacing. As a result, temporal and spatial resolutions are co-refined simultaneously. As shown in table 1, the cycle-averaged power coefficient, as well as the flow-induced forces and moments, exhibited converged outcomes in terms of mesh refinement. These results indicate that the computed quantities are effectively grid-independent. Consequently, the medium-resolution mesh is selected for all subsequent simulations, providing a satisfactory balance between accuracy and computational cost.
$\Delta x= 0.0025c$
) meshes, corresponding to five, six and seven levels of refinement of the multi-block LBM. In lattice Boltzmann simulations, the time step is inherently linked to the mesh spacing. As a result, temporal and spatial resolutions are co-refined simultaneously. As shown in table 1, the cycle-averaged power coefficient, as well as the flow-induced forces and moments, exhibited converged outcomes in terms of mesh refinement. These results indicate that the computed quantities are effectively grid-independent. Consequently, the medium-resolution mesh is selected for all subsequent simulations, providing a satisfactory balance between accuracy and computational cost.
Summary of the mesh independence study: $\Delta x$
denotes the grid spacing at the finest refinement level and
$\Delta x$
denotes the grid spacing at the finest refinement level and $N$
is the total number of grid points. The quantities
$N$
is the total number of grid points. The quantities $\overline {C_P}$
,
$\overline {C_P}$
, $\overline {|C_L|}$
and
$\overline {|C_L|}$
and $\overline {|C_M|}$
represent the cycle-averaged power, lift and moment coefficients, respectively.
$\overline {|C_M|}$
represent the cycle-averaged power, lift and moment coefficients, respectively.

2.5. Simulation set-up
The computational domain consists of an $80c \times 40c$
rectangular region, with the left boundary positioned
$80c \times 40c$
rectangular region, with the left boundary positioned $30c$
upstream and the right boundary
$30c$
upstream and the right boundary $50c$
downstream from the pivot location.
$50c$
downstream from the pivot location.
The kinematic configurations of the leading and trailing foils are established to isolate and analyse vortex–foil interactions. The validated single-foil case in § 2.4 is adopted for the leading foil. The trailing foil is positioned downstream to investigate how it can effectively exploit the wake shed by the leader. To isolate the interaction with a single incoming vortex, the trailing foil is assigned a heaving amplitude of $h_{02}^*=0.5$
, which is half that of the leading foil. For simplicity, its oscillation frequency is set to
$h_{02}^*=0.5$
, which is half that of the leading foil. For simplicity, its oscillation frequency is set to $f^*=0.14$
, matching that of the leading foil. The pitching amplitude is prescribed as
$f^*=0.14$
, matching that of the leading foil. The pitching amplitude is prescribed as $ \theta _{02}=60^\circ$
, which results in an angle of attack during middle stroke of
$ \theta _{02}=60^\circ$
, which results in an angle of attack during middle stroke of $|\alpha _{T/4}|=0.63$
, comparable to that of the leading foil. This configuration is motivated by previous findings (Kinsey & Dumas Reference Kinsey and Dumas2012), which show that foils oscillating at the same frequency and reaching similar
$|\alpha _{T/4}|=0.63$
, comparable to that of the leading foil. This configuration is motivated by previous findings (Kinsey & Dumas Reference Kinsey and Dumas2012), which show that foils oscillating at the same frequency and reaching similar $|\alpha _{T/4}|$
, even with different motion amplitudes, tend to exhibit similar wake structures and power-extraction efficiencies.
$|\alpha _{T/4}|$
, even with different motion amplitudes, tend to exhibit similar wake structures and power-extraction efficiencies.
The relative motion between the leading and trailing foils is characterised by three key parameters: $\Delta L_x$
,
$\Delta L_x$
, $\Delta L_y$
and
$\Delta L_y$
and $\phi _{1-2}$
. These parameters are systematically varied to isolate and control vortex–foil interactions. Figure 3 presents the cycle-averaged dynamic pressure ratio
$\phi _{1-2}$
. These parameters are systematically varied to isolate and control vortex–foil interactions. Figure 3 presents the cycle-averaged dynamic pressure ratio $(|\boldsymbol{u}|/U)^2$
and the vortex trajectories identified by the Q-criterion (Hunt, Wray & Moin Reference Hunt, Wray and Moin1988). The motion ranges of both the leading and trailing foils are also shown, with the trailing foil located at
$(|\boldsymbol{u}|/U)^2$
and the vortex trajectories identified by the Q-criterion (Hunt, Wray & Moin Reference Hunt, Wray and Moin1988). The motion ranges of both the leading and trailing foils are also shown, with the trailing foil located at $\Delta L_y=0.75c$
. It is observed that when
$\Delta L_y=0.75c$
. It is observed that when $\Delta L_x\gt 4c$
, both the dynamic pressure ratio distribution and vortex trajectory reach a relatively steady state in the
$\Delta L_x\gt 4c$
, both the dynamic pressure ratio distribution and vortex trajectory reach a relatively steady state in the $y$
direction. Additionally, the trajectories of the LEV and trailing-edge vortex are clearly separated. As
$y$
direction. Additionally, the trajectories of the LEV and trailing-edge vortex are clearly separated. As $\Delta L_x$
increases, the strength of the incoming vortex gradually weakens due to viscous dissipation. Therefore, to retain a relatively strong incoming vortex while minimising interference from other vortex structures such as the trailing-edge vortex,
$\Delta L_x$
increases, the strength of the incoming vortex gradually weakens due to viscous dissipation. Therefore, to retain a relatively strong incoming vortex while minimising interference from other vortex structures such as the trailing-edge vortex, $\Delta L_x=4c$
is selected for all subsequent test cases. We investigate 6 equally spaced transverse distances
$\Delta L_x=4c$
is selected for all subsequent test cases. We investigate 6 equally spaced transverse distances $(0\leq \Delta L_y \leq 1.25c)$
and 20 equally spaced phase differences
$(0\leq \Delta L_y \leq 1.25c)$
and 20 equally spaced phase differences $(-\pi \lt \phi _{1-2} \leq \pi )$
, resulting in a total of 120 testing cases. The interaction between the incoming vortex and the trailing foil can be independently controlled in the temporal and spatial domains through
$(-\pi \lt \phi _{1-2} \leq \pi )$
, resulting in a total of 120 testing cases. The interaction between the incoming vortex and the trailing foil can be independently controlled in the temporal and spatial domains through $\phi _{1-2}$
and
$\phi _{1-2}$
and $\Delta L_y$
.
$\Delta L_y$
.
Mean flow fields: (a) dynamic pressure ratio $(|\boldsymbol{u}|/U)^2$
and (b) vortex trajectories identified by the Q-criterion. Results correspond to
$(|\boldsymbol{u}|/U)^2$
and (b) vortex trajectories identified by the Q-criterion. Results correspond to $\Delta L_y = 0.75c$
.
$\Delta L_y = 0.75c$
.

For illustration, we consider the case of an incoming vortex rotating in the clockwise (CW) direction. During the downstroke, the trailing foil generates a counter-clockwise (CCW) LEV, resulting in an counter-rotating vortex interaction. Conversely, during the upstroke, a CW LEV is formed, leading to a co-rotating interaction with the incoming vortex. The timing of the interaction between the incoming vortex and the foil can be controlled by adjusting $\phi _{1-2}$
. Figure 4 shows the temporal evolution of the vortex–foil interaction. When
$\phi _{1-2}$
. Figure 4 shows the temporal evolution of the vortex–foil interaction. When $\phi _{1-2}$
varies from
$\phi _{1-2}$
varies from $-\pi$
to
$-\pi$
to $\pi$
, the position and angle of attack of the trailing foil remain fixed at each time step, while the incoming vortex gradually approaches and eventually sweeps across the foil. By adjusting
$\pi$
, the position and angle of attack of the trailing foil remain fixed at each time step, while the incoming vortex gradually approaches and eventually sweeps across the foil. By adjusting $\Delta L_y$
at a fixed
$\Delta L_y$
at a fixed $\phi _{1-2}$
, the spatial location of vortex–foil interaction can be systematically adjusted. As a result, these 120 cases span the full range of interaction scenarios, with the incoming vortex placed at different streamwise and transverse offsets around the trailing foil throughout its flapping motion, thereby capturing all possible modes of interaction.
$\phi _{1-2}$
, the spatial location of vortex–foil interaction can be systematically adjusted. As a result, these 120 cases span the full range of interaction scenarios, with the incoming vortex placed at different streamwise and transverse offsets around the trailing foil throughout its flapping motion, thereby capturing all possible modes of interaction.
Temporal evolution of vortex–foil interaction mode with varying $\phi _{1-2}$
and
$\phi _{1-2}$
and $\Delta L_y=0.75c$
: (a) downstroke phase at
$\Delta L_y=0.75c$
: (a) downstroke phase at $t/T=0.1$
and (b) upstroke phase at
$t/T=0.1$
and (b) upstroke phase at $t/T=0.6$
. Clockwise and counter-clockwise vorticity are represented by blue and red, respectively. Isolines of Q-criterion (
$t/T=0.6$
. Clockwise and counter-clockwise vorticity are represented by blue and red, respectively. Isolines of Q-criterion ( $Qc^2/U^2=1$
) are used to visualise the vortical structures.
$Qc^2/U^2=1$
) are used to visualise the vortical structures.

3. Results and discussion
3.1. Four modes of vortex–foil interaction
The present study examines vortex–foil interactions governed by a single dominant incoming vortex. As illustrated in figures 3 and 4, CW vortices generated by the leading foil are centred at $\Delta L_y \approx c$
, while CCW vortices are located at
$\Delta L_y \approx c$
, while CCW vortices are located at $\Delta L_y \approx -c$
. Interactions are classified according to the position of the incoming vortex relative to the trailing foil, distinguishing whether the vortex interacts with the pressure or suction side. By combining the vortex rotation (same or opposite) with the interaction location, four distinct interaction modes are identified: same rotation on the pressure side (SP), opposite rotation on the pressure side (OP), opposite rotation on the suction side (OS) and same rotation on the suction side (SS), as shown in figure 5. These interactions are systematically mapped by varying the phase difference
$\Delta L_y \approx -c$
. Interactions are classified according to the position of the incoming vortex relative to the trailing foil, distinguishing whether the vortex interacts with the pressure or suction side. By combining the vortex rotation (same or opposite) with the interaction location, four distinct interaction modes are identified: same rotation on the pressure side (SP), opposite rotation on the pressure side (OP), opposite rotation on the suction side (OS) and same rotation on the suction side (SS), as shown in figure 5. These interactions are systematically mapped by varying the phase difference $\phi _{1-2}$
and the transverse spacing
$\phi _{1-2}$
and the transverse spacing $\Delta L_y$
.
$\Delta L_y$
.
Schematic representation of the four vortex–foil interaction modes defined by the relative rotation between the incoming vortex and the foil-shed LEV and by the side of interaction. The modes are classified as: ( $a$
) SP; (
$a$
) SP; ( $b$
) OP; (
$b$
) OP; ( $c$
) OS; and (
$c$
) OS; and ( $d$
) SS. Dashed circles denote incoming vortices, solid circles denote the LEV and arrows indicate vortex rotation.
$d$
) SS. Dashed circles denote incoming vortices, solid circles denote the LEV and arrows indicate vortex rotation.

Interaction regime map of the trailing foil in the $\phi _{1-2}$
and
$\phi _{1-2}$
and $\Delta L_y$
parameter space: (a) downstroke and (b) upstroke. Colour contours show the cycle-averaged power coefficient, while dashed curves delineate regime boundaries and labelled regions indicate the dominant vortex–foil interaction modes.
$\Delta L_y$
parameter space: (a) downstroke and (b) upstroke. Colour contours show the cycle-averaged power coefficient, while dashed curves delineate regime boundaries and labelled regions indicate the dominant vortex–foil interaction modes.

To elucidate the role of vortex–foil interactions in energy harvesting, the cycle-averaged power coefficient ( $\bar {C_P}$
) is decomposed into contributions from the downstroke and upstroke phases, as shown in figure 6. During the downstroke, the trailing foil encounters both CCW (
$\bar {C_P}$
) is decomposed into contributions from the downstroke and upstroke phases, as shown in figure 6. During the downstroke, the trailing foil encounters both CCW ( $\Delta L_y \approx -c$
) and CW (
$\Delta L_y \approx -c$
) and CW ( $\Delta L_y \approx c$
) vortices. For
$\Delta L_y \approx c$
) vortices. For $\phi _{1-2} \in (-\pi , -0.3\pi ]$
, the SP-type interaction is dominant. In this regime, the CCW incoming vortex is close to the CCW foil-shed LEV on the pressure side, which typically reduces power extraction. This behaviour is discussed in § 3.1.1. As
$\phi _{1-2} \in (-\pi , -0.3\pi ]$
, the SP-type interaction is dominant. In this regime, the CCW incoming vortex is close to the CCW foil-shed LEV on the pressure side, which typically reduces power extraction. This behaviour is discussed in § 3.1.1. As $\phi _{1-2}$
increases, the CCW vortex bypasses the foil while the CW vortex approaches, triggering an OP-type interaction. Peak energy extraction occurs within
$\phi _{1-2}$
increases, the CCW vortex bypasses the foil while the CW vortex approaches, triggering an OP-type interaction. Peak energy extraction occurs within $\phi _{1-2} \approx 0.3\pi$
–
$\phi _{1-2} \approx 0.3\pi$
– $0.4\pi$
. The sensitivity of
$0.4\pi$
. The sensitivity of $\bar {C_P}$
to
$\bar {C_P}$
to $\Delta L_y$
arises from the spatial non-uniformity of the wake’s energy distribution. Even within the same type of interaction, the foil’s position relative to the vortex trajectory significantly affects
$\Delta L_y$
arises from the spatial non-uniformity of the wake’s energy distribution. Even within the same type of interaction, the foil’s position relative to the vortex trajectory significantly affects $\bar {C_P}$
. These characteristics are detailed in § 3.1.2. As
$\bar {C_P}$
. These characteristics are detailed in § 3.1.2. As $\phi _{1-2}$
increases further, configurations with
$\phi _{1-2}$
increases further, configurations with $\Delta L_y \lt 0.75c$
continue to exhibit the OP-type interaction. Here, the trailing foil operates below the CW vortex within a low-energy wake. Conversely, when
$\Delta L_y \lt 0.75c$
continue to exhibit the OP-type interaction. Here, the trailing foil operates below the CW vortex within a low-energy wake. Conversely, when $\Delta L_y \ge 0.75c$
, the foil operates above the CW vortex. This induces an OS-type interaction, which locally reduces power extraction. The associated mechanisms are discussed in § 3.1.3. As the CW vortex bypasses and the subsequent CCW vortex approaches, the system reverts to the SP-type interaction, leading to a continued decline in power. During the upstroke, the foil mainly encounters CW vortices. The SP-type interaction is dominant in most of the parameter space. However, specific configurations, such as
$\Delta L_y \ge 0.75c$
, the foil operates above the CW vortex. This induces an OS-type interaction, which locally reduces power extraction. The associated mechanisms are discussed in § 3.1.3. As the CW vortex bypasses and the subsequent CCW vortex approaches, the system reverts to the SP-type interaction, leading to a continued decline in power. During the upstroke, the foil mainly encounters CW vortices. The SP-type interaction is dominant in most of the parameter space. However, specific configurations, such as $(\Delta L_y = c, \phi _{1-2} = 0)$
,
$(\Delta L_y = c, \phi _{1-2} = 0)$
, $(\Delta L_y = 0.75c, \phi _{1-2} = -0.2\pi )$
and
$(\Delta L_y = 0.75c, \phi _{1-2} = -0.2\pi )$
and $(\Delta L_y = 0.5c, \phi _{1-2} = -0.4\pi )$
, correspond to the maximum
$(\Delta L_y = 0.5c, \phi _{1-2} = -0.4\pi )$
, correspond to the maximum $\bar {C_P}$
for each
$\bar {C_P}$
for each $\Delta L_y$
and exhibit the SS-type interaction. This interaction leads to higher energy harvesting than the SP-type, the mechanisms of which are detailed in § 3.1.4.
$\Delta L_y$
and exhibit the SS-type interaction. This interaction leads to higher energy harvesting than the SP-type, the mechanisms of which are detailed in § 3.1.4.
3.1.1. The SP-type interaction
During the downstroke phase, when $\phi _{1-2}$
varies from
$\phi _{1-2}$
varies from $-\pi$
to
$-\pi$
to $-0.3\pi$
, the trailing foil encounters a co-rotating vortex located on the pressure side of its path, corresponding to the SP-type interaction. The associated vortex structures and streamlines are shown in figure 7. Due to the considerable distance between the foil and the incoming vortex (localised at
$-0.3\pi$
, the trailing foil encounters a co-rotating vortex located on the pressure side of its path, corresponding to the SP-type interaction. The associated vortex structures and streamlines are shown in figure 7. Due to the considerable distance between the foil and the incoming vortex (localised at $y/c \approx -1$
), the low-pressure core of the incoming vortex does not directly affect the unsteady lift. Instead, it affects the flow indirectly by modifying the local flow field near the leading edge. First, the vortex reduces the inflow velocity along the foil trajectory, which is reflected in the decreased dynamic pressure ratio near the leading edge. In addition, it deflects the local flow direction, leading to a reduction in the effective angle of attack, as indicated by the tilted velocity vectors. The combined reduction in velocity magnitude and incidence weakens the development of the LEV over the suction side. Consequently, both lift production and power extraction are markedly reduced during this phase. As shown in figure 6(a), the SP-type interaction thus constitutes a destructive mode for energy harvesting and suppresses the cycle-averaged power output.
$y/c \approx -1$
), the low-pressure core of the incoming vortex does not directly affect the unsteady lift. Instead, it affects the flow indirectly by modifying the local flow field near the leading edge. First, the vortex reduces the inflow velocity along the foil trajectory, which is reflected in the decreased dynamic pressure ratio near the leading edge. In addition, it deflects the local flow direction, leading to a reduction in the effective angle of attack, as indicated by the tilted velocity vectors. The combined reduction in velocity magnitude and incidence weakens the development of the LEV over the suction side. Consequently, both lift production and power extraction are markedly reduced during this phase. As shown in figure 6(a), the SP-type interaction thus constitutes a destructive mode for energy harvesting and suppresses the cycle-averaged power output.
Visualisation of velocity vectors and the corresponding unsteady lift distribution for the SP-type interaction ( $\Delta L_y=0.75c$
and
$\Delta L_y=0.75c$
and $\phi _{1-2}=-0.9\pi$
). Velocity vectors are coloured by the dynamic pressure ratio
$\phi _{1-2}=-0.9\pi$
). Velocity vectors are coloured by the dynamic pressure ratio $(|\boldsymbol{u}|/U)^2$
, with overlaid contours of vortex-induced lift. Contour levels are in the range
$(|\boldsymbol{u}|/U)^2$
, with overlaid contours of vortex-induced lift. Contour levels are in the range $[-20,20]$
, where blue and red indicate negative and positive lift directions, respectively.
$[-20,20]$
, where blue and red indicate negative and positive lift directions, respectively.

3.1.2. The OP-type interaction
As $\phi _{1-2}$
continues to increase, the co-rotating vortex gradually passes over the trailing foil, and its adverse influence on performance diminishes. Around
$\phi _{1-2}$
continues to increase, the co-rotating vortex gradually passes over the trailing foil, and its adverse influence on performance diminishes. Around $\phi _{1-2}=-0.3\pi$
, the trailing foil crosses over the co-rotating vortex. Subsequently, a counter-rotating vortex is shed and gradually approaches the foil, leading to a transition into the OP-type interaction. Under this interaction mode, as
$\phi _{1-2}=-0.3\pi$
, the trailing foil crosses over the co-rotating vortex. Subsequently, a counter-rotating vortex is shed and gradually approaches the foil, leading to a transition into the OP-type interaction. Under this interaction mode, as $\phi _{1-2}$
further increases, indicating that the trailing foil moves progressively closer to the counter-rotating vortex, the power extraction steadily improves. The increasing proximity of the counter-rotating vortex enhances the beneficial vortex–foil interaction, leading to a gradual rise in unsteady lift and energy harvesting. This trend continues until
$\phi _{1-2}$
further increases, indicating that the trailing foil moves progressively closer to the counter-rotating vortex, the power extraction steadily improves. The increasing proximity of the counter-rotating vortex enhances the beneficial vortex–foil interaction, leading to a gradual rise in unsteady lift and energy harvesting. This trend continues until $\phi _{1-2}$
approaches approximately
$\phi _{1-2}$
approaches approximately $0.3\pi$
to
$0.3\pi$
to $0.4\pi$
, where the extracted power reaches its maximum value, as shown in figure 6(a). In contrast to the SP-type interaction, where the co-rotating vortex tends to reduce the effective angle of attack and suppress energy harvesting, the OP-type interaction promotes enhanced energy extraction. This enhancement arises from favourable modifications of both the local velocity magnitude and flow incidence. As illustrated in figure 8, when the foil approaches the counter-rotating vortex (localised at
$0.4\pi$
, where the extracted power reaches its maximum value, as shown in figure 6(a). In contrast to the SP-type interaction, where the co-rotating vortex tends to reduce the effective angle of attack and suppress energy harvesting, the OP-type interaction promotes enhanced energy extraction. This enhancement arises from favourable modifications of both the local velocity magnitude and flow incidence. As illustrated in figure 8, when the foil approaches the counter-rotating vortex (localised at $y/c \approx 1$
), the induced velocity field accelerates the flow near the leading edge, thereby placing the foil within a high-energy region. At the same time, the induced velocity deflects the inflow direction in a manner that increases the effective angle of attack. The locally intensified flow amplifies the strength of the LEV, thereby enhancing its capacity for energy extraction.
$y/c \approx 1$
), the induced velocity field accelerates the flow near the leading edge, thereby placing the foil within a high-energy region. At the same time, the induced velocity deflects the inflow direction in a manner that increases the effective angle of attack. The locally intensified flow amplifies the strength of the LEV, thereby enhancing its capacity for energy extraction.
Visualisation of velocity vectors for the OP-type interaction at $\Delta L_y=c$
: (a)
$\Delta L_y=c$
: (a) $\phi _{1-2}=0$
and (b)
$\phi _{1-2}=0$
and (b) $\phi _{1-2}=0.4\pi$
. Velocity vectors are coloured by dynamic pressure ratio
$\phi _{1-2}=0.4\pi$
. Velocity vectors are coloured by dynamic pressure ratio $(|\boldsymbol{u}|/U)^2$
.
$(|\boldsymbol{u}|/U)^2$
.

Time histories of lift and power coefficients and snapshots of vortex-induced lift contributions for the OP-type interaction at $\Delta L_y=0.5c$
: (a) comparison of lift coefficients and power coefficient for different
$\Delta L_y=0.5c$
: (a) comparison of lift coefficients and power coefficient for different $\phi _{1-2}$
, (b) distribution of vortex-induced lift for
$\phi _{1-2}$
, (b) distribution of vortex-induced lift for $\phi _{1-2}=0.4\pi$
and (c) distribution of vortex-induced lift for
$\phi _{1-2}=0.4\pi$
and (c) distribution of vortex-induced lift for $\phi _{1-2}=0.6\pi$
.
$\phi _{1-2}=0.6\pi$
.

In the OP-type interaction regime, variations in $\Delta L_y$
result in distinct energy-extraction behaviours. For cases with
$\Delta L_y$
result in distinct energy-extraction behaviours. For cases with $\Delta L_y\lt 0.75c$
, the cycle-averaged power output is relatively constrained, with
$\Delta L_y\lt 0.75c$
, the cycle-averaged power output is relatively constrained, with $\bar {C_P}$
values typically remaining below 0.15. As shown in figure 3, the trajectory of the incoming vortices is distributed over approximately one chord length in the vertical direction. In these configurations, the trailing foil moves below the counter-rotating vortex and remains within a comparatively low-energy wake region, thereby reducing its energy-extraction efficiency. The tandem configuration, in which the trailing foil oscillates with the same amplitude as the leading foil, also falls within this regime. Figure 9 presents the lift coefficient and the corresponding flow evolution at
$\bar {C_P}$
values typically remaining below 0.15. As shown in figure 3, the trajectory of the incoming vortices is distributed over approximately one chord length in the vertical direction. In these configurations, the trailing foil moves below the counter-rotating vortex and remains within a comparatively low-energy wake region, thereby reducing its energy-extraction efficiency. The tandem configuration, in which the trailing foil oscillates with the same amplitude as the leading foil, also falls within this regime. Figure 9 presents the lift coefficient and the corresponding flow evolution at $\Delta L_y=0.5c$
near the optimal
$\Delta L_y=0.5c$
near the optimal $\phi _{1-2}$
. Over the range
$\phi _{1-2}$
. Over the range $0 \le \phi _{1-2} \le 0.6\pi$
, the strength of the vortex–foil interaction increases as the trailing foil approaches the incoming counter-rotating vortex. The vortex-induced velocity alters the local inflow direction and increases the effective angle of attack, thereby promoting the earlier formation of the LEV. This effect is reflected in the
$0 \le \phi _{1-2} \le 0.6\pi$
, the strength of the vortex–foil interaction increases as the trailing foil approaches the incoming counter-rotating vortex. The vortex-induced velocity alters the local inflow direction and increases the effective angle of attack, thereby promoting the earlier formation of the LEV. This effect is reflected in the $C_L$
histories in figure 9(
$C_L$
histories in figure 9( $a$
), where
$a$
), where $\phi _{1-2}=0.6\pi$
produces an earlier and higher lift peak, while
$\phi _{1-2}=0.6\pi$
produces an earlier and higher lift peak, while $\phi _{1-2}=0$
exhibits a delayed and attenuated response. A trade-off arises between the peak force magnitude and its duration. Stronger interactions, such as
$\phi _{1-2}=0$
exhibits a delayed and attenuated response. A trade-off arises between the peak force magnitude and its duration. Stronger interactions, such as $\phi _{1-2}=0.6\pi$
, enhance instantaneous lift by reinforcing LEV growth, but simultaneously accelerate vortex detachment, shortening the period during which beneficial suction persists. Therefore, the system does not favour the strongest possible interaction. Instead, optimal performance is governed by a phase-synchronisation condition in which vortex arrival, LEV growth and foil kinematics remain temporally aligned. Within this framework, the optimal phase difference
$\phi _{1-2}=0.6\pi$
, enhance instantaneous lift by reinforcing LEV growth, but simultaneously accelerate vortex detachment, shortening the period during which beneficial suction persists. Therefore, the system does not favour the strongest possible interaction. Instead, optimal performance is governed by a phase-synchronisation condition in which vortex arrival, LEV growth and foil kinematics remain temporally aligned. Within this framework, the optimal phase difference $\phi _{1-2}=0.4\pi$
corresponds to a balanced state where the incoming vortex is captured to augment LEV development while avoiding premature shedding. This alignment sustains force production over the energetically favourable portion of the cycle.
$\phi _{1-2}=0.4\pi$
corresponds to a balanced state where the incoming vortex is captured to augment LEV development while avoiding premature shedding. This alignment sustains force production over the energetically favourable portion of the cycle.
As the transverse spacing increases, the foil begins to enter the region accelerated by the vortex-induced velocity. When $\Delta L_y=0.75c$
, the extracted power increases significantly to around 0.25. Further increasing the spacing to
$\Delta L_y=0.75c$
, the extracted power increases significantly to around 0.25. Further increasing the spacing to $\Delta L_y=c$
leads to an even higher power extraction level of approximately 0.35. This trend is strongly influenced by the foil’s placement in the vortex-induced high-velocity region. However, beyond this point, additional increases in
$\Delta L_y=c$
leads to an even higher power extraction level of approximately 0.35. This trend is strongly influenced by the foil’s placement in the vortex-induced high-velocity region. However, beyond this point, additional increases in $\Delta L_y$
do not result in further energy gain. This is because the trailing foil gradually moves away from the vortex, reducing its ability to effectively capture the kinetic energy carried by the vortex. Although both
$\Delta L_y$
do not result in further energy gain. This is because the trailing foil gradually moves away from the vortex, reducing its ability to effectively capture the kinetic energy carried by the vortex. Although both $\Delta L_y=0.75c$
and
$\Delta L_y=0.75c$
and $\Delta L_y=c$
exhibit similar trends in power extraction, the magnitude differs significantly, as shown in figure 6(a). Specifically, for the downstroke phase, the peak
$\Delta L_y=c$
exhibit similar trends in power extraction, the magnitude differs significantly, as shown in figure 6(a). Specifically, for the downstroke phase, the peak $\bar {C_P}$
value for
$\bar {C_P}$
value for $\Delta L_y=c$
is approximately 0.41, which is significantly higher than the value of 0.30 observed for
$\Delta L_y=c$
is approximately 0.41, which is significantly higher than the value of 0.30 observed for $\Delta L_y=0.75c$
. Figure 10 compares the lift histories and visualises the detailed vortex–foil interaction structures for these two cases.
$\Delta L_y=0.75c$
. Figure 10 compares the lift histories and visualises the detailed vortex–foil interaction structures for these two cases.
At $\Delta L_y=0.75c$
, the LEV formed at the early stage of the cycle exhibits a stronger vortex strength than in the
$\Delta L_y=0.75c$
, the LEV formed at the early stage of the cycle exhibits a stronger vortex strength than in the $\Delta L_y\lt 0.75c$
cases, owing to the enhanced vortex–foil interaction. This reinforcement produces a stronger suction peak at the leading edge. As the cycle progresses into the mid-pitching phase (
$\Delta L_y\lt 0.75c$
cases, owing to the enhanced vortex–foil interaction. This reinforcement produces a stronger suction peak at the leading edge. As the cycle progresses into the mid-pitching phase ( $t/T\gt 0.35$
), the lift magnitude declines, primarily due to the detachment of the LEV. At the same time, similar to the
$t/T\gt 0.35$
), the lift magnitude declines, primarily due to the detachment of the LEV. At the same time, similar to the $\Delta L_y\lt 0.75c$
regime, the incoming vortex is observed to cross to the pressure side of the trailing foil (see figure 10
b). In this case, the vortex is closer to the foil surface, so that its low-pressure core exerts a more direct influence on lift generation. The FMPM reveals the competing contributions of the vortical structures. The upper vortex enclosed by the dashed box accounts for 22 % of the positive lift, while the remainder of the positive lift originates from the strain-dominated flow (Menon & Mittal Reference Menon and Mittal2021c
). In contrast, the lower vortex within the box contributes 52 % of the total negative lift. The upward force generated by the incoming vortex only partially compensates for the downward lift induced by the LEV. Overall, the stronger LEV formed in the early stage leads to improved net power extraction compared with the
$\Delta L_y\lt 0.75c$
regime, the incoming vortex is observed to cross to the pressure side of the trailing foil (see figure 10
b). In this case, the vortex is closer to the foil surface, so that its low-pressure core exerts a more direct influence on lift generation. The FMPM reveals the competing contributions of the vortical structures. The upper vortex enclosed by the dashed box accounts for 22 % of the positive lift, while the remainder of the positive lift originates from the strain-dominated flow (Menon & Mittal Reference Menon and Mittal2021c
). In contrast, the lower vortex within the box contributes 52 % of the total negative lift. The upward force generated by the incoming vortex only partially compensates for the downward lift induced by the LEV. Overall, the stronger LEV formed in the early stage leads to improved net power extraction compared with the $\Delta L_y\lt 0.75c$
regime.
$\Delta L_y\lt 0.75c$
regime.
The optimal OP-type interaction is observed at $\Delta L_y=c$
and
$\Delta L_y=c$
and $\phi _{1-2}=0.4\pi$
, as shown in figure 10(c). In this configuration, the trailing foil aligns favourably with the vortex-induced high-speed region during the downstroke and interacts with the incoming vortex near the end of the stroke. Instead of passing to the pressure side of the foil, the vortex induces additional velocity near the leading edge, which enhances the strength of the developing LEV. This effect is evident in the lift history shown in figure 10(a) as sustained lift during
$\phi _{1-2}=0.4\pi$
, as shown in figure 10(c). In this configuration, the trailing foil aligns favourably with the vortex-induced high-speed region during the downstroke and interacts with the incoming vortex near the end of the stroke. Instead of passing to the pressure side of the foil, the vortex induces additional velocity near the leading edge, which enhances the strength of the developing LEV. This effect is evident in the lift history shown in figure 10(a) as sustained lift during $t/T=0.3{-}0.4$
in contrast to the rapid decay observed at
$t/T=0.3{-}0.4$
in contrast to the rapid decay observed at $\Delta L_y=0.75c$
. The vortex then merges with the LEV and dissipates, effectively transferring its energy to the foil-attached vortex. This interaction enables more efficient energy transfer, allowing the trailing foil to convert the vortex energy into unsteady lift more effectively. As a result, the strength of the LEV is enhanced, and the power extraction recovers to a level comparable to that under free-stream conditions.
$\Delta L_y=0.75c$
. The vortex then merges with the LEV and dissipates, effectively transferring its energy to the foil-attached vortex. This interaction enables more efficient energy transfer, allowing the trailing foil to convert the vortex energy into unsteady lift more effectively. As a result, the strength of the LEV is enhanced, and the power extraction recovers to a level comparable to that under free-stream conditions.
Time histories of lift and power coefficients and snapshots of vortex-induced lift contributions for the OP-type interaction at $\phi _{1-2}=0.4\pi$
: (a) comparison of lift coefficients and power coefficient for different
$\phi _{1-2}=0.4\pi$
: (a) comparison of lift coefficients and power coefficient for different $\Delta L_y$
, (b) distribution of vortex-induced lift at
$\Delta L_y$
, (b) distribution of vortex-induced lift at $\Delta L_y=0.75c$
and (c) distribution of vortex-induced lift at
$\Delta L_y=0.75c$
and (c) distribution of vortex-induced lift at $\Delta L_y=c$
. The dashed box indicates the region used for force integration.
$\Delta L_y=c$
. The dashed box indicates the region used for force integration.

3.1.3. The OS-type interaction
As $\phi _{1-2}$
increases beyond
$\phi _{1-2}$
increases beyond $0.4 \pi$
, a gradual decline in power extraction is observed in figure 6(a). For configurations with
$0.4 \pi$
, a gradual decline in power extraction is observed in figure 6(a). For configurations with $\Delta L_y\lt 0.75c$
, the counter-rotating incoming vortex convects over the upper surface of the trailing foil, confining it to a low-energy region and thus reducing its energy-harvesting capability. In contrast, for cases with
$\Delta L_y\lt 0.75c$
, the counter-rotating incoming vortex convects over the upper surface of the trailing foil, confining it to a low-energy region and thus reducing its energy-harvesting capability. In contrast, for cases with $\Delta L_y\geq 0.75c$
, the elevated position of the trailing foil gives rise to a distinct interaction mode. In this regime, the counter-rotating incoming vortex is located on the suction side of the foil, indicating the emergence of a new interaction mechanism.
$\Delta L_y\geq 0.75c$
, the elevated position of the trailing foil gives rise to a distinct interaction mode. In this regime, the counter-rotating incoming vortex is located on the suction side of the foil, indicating the emergence of a new interaction mechanism.
Figure 11 compares the lift coefficients for $\phi _{1-2}=0.4 \pi$
and
$\phi _{1-2}=0.4 \pi$
and $0.8\pi$
at a transverse spacing of
$0.8\pi$
at a transverse spacing of $\Delta L_y = c$
. Furthermore, it presents the instantaneous flow structures and vortex-induced lift for the
$\Delta L_y = c$
. Furthermore, it presents the instantaneous flow structures and vortex-induced lift for the $\phi _{1-2}=0.8 \pi$
case, which corresponds to an OS-type interaction. When these two counter-rotating vortices interact, the strength of the foil-shed LEV is significantly strengthened, resulting in a marked increase in the magnitude of the lift force. Surprisingly, the FMPM reveals that the incoming vortex contributes only 4 % to the total negative lift, while the strengthened LEV accounts for up to 69.7 %. This indicates that the incoming vortex does not directly induce suction via its low-pressure core, but rather modifies the local flow velocity near the foil, thereby enhancing the strength of the LEV and indirectly increasing the lift magnitude. Although this interaction leads to an initial lift enhancement, the benefit proves to be short-lived. The locally accelerated velocity field, induced by the vortex–vortex interaction, rapidly advects both vortices away from the region for force generating. Consequently, their contribution to the lift magnitude decreases sharply. This mode of interaction provides only transient benefits and is ultimately destructive for sustained energy-harvesting performance.
$\phi _{1-2}=0.8 \pi$
case, which corresponds to an OS-type interaction. When these two counter-rotating vortices interact, the strength of the foil-shed LEV is significantly strengthened, resulting in a marked increase in the magnitude of the lift force. Surprisingly, the FMPM reveals that the incoming vortex contributes only 4 % to the total negative lift, while the strengthened LEV accounts for up to 69.7 %. This indicates that the incoming vortex does not directly induce suction via its low-pressure core, but rather modifies the local flow velocity near the foil, thereby enhancing the strength of the LEV and indirectly increasing the lift magnitude. Although this interaction leads to an initial lift enhancement, the benefit proves to be short-lived. The locally accelerated velocity field, induced by the vortex–vortex interaction, rapidly advects both vortices away from the region for force generating. Consequently, their contribution to the lift magnitude decreases sharply. This mode of interaction provides only transient benefits and is ultimately destructive for sustained energy-harvesting performance.
Time histories of lift and power coefficients and snapshots of vortex-induced lift contributions for the OS-type interaction at $\Delta L_y=c$
: (a) comparison of lift coefficients and power coefficient for different
$\Delta L_y=c$
: (a) comparison of lift coefficients and power coefficient for different $\phi _{1-2}$
and (b) distribution of vortex-induced lift at
$\phi _{1-2}$
and (b) distribution of vortex-induced lift at $\phi _{1-2}=0.8\pi$
. The dashed box indicates the region used for force integration.
$\phi _{1-2}=0.8\pi$
. The dashed box indicates the region used for force integration.

Time histories of lift and power coefficients and snapshots of vortex-induced lift contributions for the SS-type interaction: (a) comparison of lift coefficients and power coefficient, (b) distribution of vortex-induced lift at $\Delta L_y=0.75c$
and
$\Delta L_y=0.75c$
and $\phi _{1-2}=-0.2\pi$
and (c) distribution of vortex-induced lift at
$\phi _{1-2}=-0.2\pi$
and (c) distribution of vortex-induced lift at $\Delta L_y=0.5c$
and
$\Delta L_y=0.5c$
and $\phi _{1-2}=-0.4\pi$
.
$\phi _{1-2}=-0.4\pi$
.

3.1.4. The SS-type interaction
The final interaction mode considered is the SS-type interaction, in which the incoming vortex is co-rotating with the foil-shed LEV and is located on the suction side of the foil. This configuration occurs under specific conditions, centred around ( $\Delta L_y=c$
,
$\Delta L_y=c$
, $\phi _{1-2}=0$
), (
$\phi _{1-2}=0$
), ( $\Delta L_y=0.75c$
,
$\Delta L_y=0.75c$
, $\phi _{1-2}=-0.2\pi$
) and (
$\phi _{1-2}=-0.2\pi$
) and ( $\Delta L_y=0.5c$
,
$\Delta L_y=0.5c$
, $\phi _{1-2}=-0.4\pi$
), as identified by the dashed circles in figure 6(b). Notably, for each considered transverse spacing
$\phi _{1-2}=-0.4\pi$
), as identified by the dashed circles in figure 6(b). Notably, for each considered transverse spacing $\Delta L_y$
, these points correspond to the maximum
$\Delta L_y$
, these points correspond to the maximum $\bar {C_P}$
achievable at that spacing, confirming that the SS-type interaction constitutes a favourable mechanism for power extraction at these discrete configurations. Figure 12 presents the corresponding lift evolution and detailed flow structures for this interaction mode. For the
$\bar {C_P}$
achievable at that spacing, confirming that the SS-type interaction constitutes a favourable mechanism for power extraction at these discrete configurations. Figure 12 presents the corresponding lift evolution and detailed flow structures for this interaction mode. For the $\Delta L_y=0.75c$
case (
$\Delta L_y=0.75c$
case ( $\phi _{1-2}=-0.2\pi$
), the SS-type interaction emerges at
$\phi _{1-2}=-0.2\pi$
), the SS-type interaction emerges at $t/T \gt 0.7$
, whereas for the
$t/T \gt 0.7$
, whereas for the $\Delta L_y=0.5c$
case (
$\Delta L_y=0.5c$
case ( $\phi _{1-2}=-0.4\pi$
), it is delayed until
$\phi _{1-2}=-0.4\pi$
), it is delayed until $t/T \gt 0.8$
owing to the different transverse spacing. Despite these temporal differences, both cases exhibit a marked increase in the
$t/T \gt 0.8$
owing to the different transverse spacing. Despite these temporal differences, both cases exhibit a marked increase in the $C_L$
magnitude once the SS-type interaction is established. Despite the strength and close proximity of the incoming vortex, direct interaction between the co-rotating vortices does not result in significant lift enhancement. Initially, as the co-rotating incoming vortex approaches the trailing foil, its induced velocity field suppresses the formation of the LEV and may reverse its rotation. This process produces relatively low lift during the early stage of the stroke, resembling an SP-type interaction. However, once the incoming vortex convects past the leading edge and aligns with the foil-shed LEV on the suction side, the interaction transitions into the SS-type regime. In this phase, the vortex-induced velocity accelerates shear-layer roll-up and reinforces LEV strength. As the foil continues its stroke, the strengthened LEV remains close to the surface while convected towards the trailing edge. Simultaneously, the decreasing angle of attack increases the projected area of the foil exposed to the sustained suction. Consistent with the mechanism identified by Hoke et al. (Reference Hoke, Young and Lai2023), this leads to a more favourable projection of the force onto the plunging direction, thereby producing a delayed enhancement in lift and power extraction. This transition demonstrates that although co-rotating vortices are generally detrimental to performance, they become constructive when the interaction is tuned to the SS-type interaction.
$C_L$
magnitude once the SS-type interaction is established. Despite the strength and close proximity of the incoming vortex, direct interaction between the co-rotating vortices does not result in significant lift enhancement. Initially, as the co-rotating incoming vortex approaches the trailing foil, its induced velocity field suppresses the formation of the LEV and may reverse its rotation. This process produces relatively low lift during the early stage of the stroke, resembling an SP-type interaction. However, once the incoming vortex convects past the leading edge and aligns with the foil-shed LEV on the suction side, the interaction transitions into the SS-type regime. In this phase, the vortex-induced velocity accelerates shear-layer roll-up and reinforces LEV strength. As the foil continues its stroke, the strengthened LEV remains close to the surface while convected towards the trailing edge. Simultaneously, the decreasing angle of attack increases the projected area of the foil exposed to the sustained suction. Consistent with the mechanism identified by Hoke et al. (Reference Hoke, Young and Lai2023), this leads to a more favourable projection of the force onto the plunging direction, thereby producing a delayed enhancement in lift and power extraction. This transition demonstrates that although co-rotating vortices are generally detrimental to performance, they become constructive when the interaction is tuned to the SS-type interaction.
3.1.5. Summary of the four vortex–foil interaction modes
A total of 120 vortex–foil interaction cases are classified into four canonical modes based on the relative rotation and spatial positioning of the incoming vortex and foil-shed LEV: SP-type, OP-type, OS-type and SS-type. A classification framework is then established by systematically comparing their effects on power extraction, lift generation and flow evolution.
Among these four modes, two are found to enhance energy harvesting. The OP-type interaction emerges as the most effective and frequently observed mode. In this regime, the foil encounters a counter-rotating incoming vortex during its stroke, which increases the local flow velocity and strengthens the LEV. Particularly under staggered configurations, the incoming vortex merges with the developing LEV and dissipates, thereby transferring its energy to the foil-shed LEV. The SS-type interaction, also beneficial, occurs when a co-rotating incoming vortex convects along the same side as the LEV. Although LEV growth is initially suppressed due to the preceding SP-type interaction, the subsequent transition to SS-type accelerates shear-layer roll-up, leading to a delayed increase in lift magnitude. Constructive effects thus arise only once the incoming vortex has convected to the same side as the foil-shed LEV. In brief, the improved performance originates from enhanced unsteady lift through local velocity modification that strengthens or promotes LEV development. This mechanism governs the constructive effects observed in these two interaction modes.
By contrast, the SP-type interaction proves least effective. Here, a co-rotating incoming vortex passes near the pressure side of the foil, reducing the effective angle of attack and suppressing LEV formation. As a result, both lift generation and energy extraction remain limited. The OS-type interaction constitutes a distinct regime in which strong coupling between counter-rotating vortices momentarily enhances the LEV, producing large instantaneous lift magnitude. The induced local acceleration, however, rapidly advects both vortices downstream, leading to early LEV detachment and a rapid decay of lift magnitude. Although this mode is capable of producing the highest peak forces, it is not conducive to sustained energy harvesting.
These findings highlight that the primary role of the incoming vortex is not to provide direct suction through its low-pressure core, but rather to modify the local flow velocity and direction, thereby regulating LEV dynamics. The OP- and SS-type interactions are thus identified as the most effective mechanisms for energy extraction, with implications for the design and control of multiple foil energy-harvesting systems.
3.2. A predictive framework based on four interaction modes
Based on the analysis in § 3.1, a general framework is developed to predict the phase difference between two foils that maximises their energy-harvesting efficiency. The framework is not limited to tandem wings with identical kinematics but applies to arbitrary streamwise spacings, trailing-foil amplitudes and upstream wake conditions. To represent the influence of incoming vortices on unsteady force generation, four canonical interaction modes are defined and classified as either constructive or destructive. Particularly, in both constructive modes, the incoming vortices improve the efficiency of the trailing foil by enhancing the unsteady lift through altering the local velocity to strengthen the LEV or promote its roll-up. Once the upstream wake structure is identified, the kinematics of the trailing foil are designed to synchronise with the incoming vortices, ensuring an OP- or SS-type interaction. Based on this synchronisation, the framework directly specifies both $\phi _{1-2}$
and
$\phi _{1-2}$
and $\Delta L_y$
of the trailing foil. The method is applicable to arbitrary streamwise spacings
$\Delta L_y$
of the trailing foil. The method is applicable to arbitrary streamwise spacings $\Delta L_x$
. By aligning the foil’s motion with the identified wake topology, the approach enables the rapid prediction of trailing-foil kinematics that achieve near-optimal energy harvesting. This provides a practical framework for optimising the placement and motion of the trailing foil to maximise the power extraction.
$\Delta L_x$
. By aligning the foil’s motion with the identified wake topology, the approach enables the rapid prediction of trailing-foil kinematics that achieve near-optimal energy harvesting. This provides a practical framework for optimising the placement and motion of the trailing foil to maximise the power extraction.
A practical guideline for determining this optimal phase difference is outlined below. The leading-foil motion is first simulated to obtain its wake structure. The streamwise spacing between the foils can be chosen arbitrarily. However, to avoid blockage effects of the trailing foil on the leading foil, a sufficiently large separation ( $\Delta L_x\gt 3c$
) is recommended (Zhao et al. Reference Zhao, Jiang, Wang, Qadri, Li and Tang2023). The dominant LEV is then tracked downstream. The time instant at which the vortex reaches a position approximately
$\Delta L_x\gt 3c$
) is recommended (Zhao et al. Reference Zhao, Jiang, Wang, Qadri, Li and Tang2023). The dominant LEV is then tracked downstream. The time instant at which the vortex reaches a position approximately $0.5c$
upstream of the target streamwise location
$0.5c$
upstream of the target streamwise location $\Delta L_x$
is denoted as
$\Delta L_x$
is denoted as $t_0$
. At this instant, the corresponding pitching angle of the leading foil,
$t_0$
. At this instant, the corresponding pitching angle of the leading foil, $\theta _1(t_0)$
, is recorded. Based on the constructive interaction modes identified in previous sections, the spatial relationship between the trailing foil and the incoming vortex is then determined to satisfy the synchronisation conditions illustrated in figure 10(c) or figure 12(b). Accordingly, the favourable pitching angle
$\theta _1(t_0)$
, is recorded. Based on the constructive interaction modes identified in previous sections, the spatial relationship between the trailing foil and the incoming vortex is then determined to satisfy the synchronisation conditions illustrated in figure 10(c) or figure 12(b). Accordingly, the favourable pitching angle $\theta _2(t_0)$
and the transverse placement
$\theta _2(t_0)$
and the transverse placement $\Delta L_y$
of the trailing foil are specified to ensure constructive vortex interception. By applying the inverse sine function to the kinematic equation (2.1) at this characteristic time
$\Delta L_y$
of the trailing foil are specified to ensure constructive vortex interception. By applying the inverse sine function to the kinematic equation (2.1) at this characteristic time $t_0$
, the individual phases are extracted from the target pitching angles
$t_0$
, the individual phases are extracted from the target pitching angles $\theta _1(t_0)$
and
$\theta _1(t_0)$
and $\theta _2(t_0)$
. The optimal phase difference is subsequently evaluated as
$\theta _2(t_0)$
. The optimal phase difference is subsequently evaluated as
 \begin{align} \phi _{1-2}=\arcsin {\left (\frac {\theta _1(t_0)}{\theta _{01}}\right )}-\arcsin {\left (\frac {\theta _2(t_0)}{\theta _{02}}\right )}, \end{align}
where $\theta _{01}$
and
$\theta _{01}$
and $\theta _{02}$
are the pitching amplitudes of the leading and trailing foils, respectively. Although the method provides a single predicted value, it is suggested to explore a range around this point in practical applications, since the performance of the trailing foil is highly sensitive to small variations in kinematics under strong vortex–foil interactions (Handy-Cardenas et al. Reference Handy-Cardenas, Zhu and Breuer2025). The validity and general utility of the framework are demonstrated through a series of representative test cases.
$\theta _{02}$
are the pitching amplitudes of the leading and trailing foils, respectively. Although the method provides a single predicted value, it is suggested to explore a range around this point in practical applications, since the performance of the trailing foil is highly sensitive to small variations in kinematics under strong vortex–foil interactions (Handy-Cardenas et al. Reference Handy-Cardenas, Zhu and Breuer2025). The validity and general utility of the framework are demonstrated through a series of representative test cases.
3.2.1. Robustness to variations in streamwise spacings
This section examines whether the previously identified interaction modes and their effects persist under variations in streamwise spacing. Specifically, an increased separation of $\Delta L_x=6c$
is considered. To isolate the effect of streamwise spacing, the kinematics of both the leading and trailing foils remain identical to those used previously in § 3.1, with all other parameters unchanged.
$\Delta L_x=6c$
is considered. To isolate the effect of streamwise spacing, the kinematics of both the leading and trailing foils remain identical to those used previously in § 3.1, with all other parameters unchanged.
As shown in figure 13, when the incoming vortex has convected to a position approximately $0.5c$
upstream of the target location (i.e.
$0.5c$
upstream of the target location (i.e. $\Delta L_x \approx 5.5c$
), the instantaneous pitching angle of the leading foil is recorded, which in this case is close to
$\Delta L_x \approx 5.5c$
), the instantaneous pitching angle of the leading foil is recorded, which in this case is close to $\theta _{01}$
. To maximise energy-harvesting efficiency, the kinematics of the trailing foil are then designed to synchronise with this wake configuration, specifically targeting a constructive interaction regime. Consistent with the analysis of optimal interaction, the OP-type interaction is considered here as a representative constructive regime to assess the predictive capability of the framework. According to the spatial alignment condition for OP-type synchronisation shown in figure 10(c), the trailing foil should align with the incoming vortex when it reaches its maximum angle of attack. This condition specifies a favourable transverse placement of
$\theta _{01}$
. To maximise energy-harvesting efficiency, the kinematics of the trailing foil are then designed to synchronise with this wake configuration, specifically targeting a constructive interaction regime. Consistent with the analysis of optimal interaction, the OP-type interaction is considered here as a representative constructive regime to assess the predictive capability of the framework. According to the spatial alignment condition for OP-type synchronisation shown in figure 10(c), the trailing foil should align with the incoming vortex when it reaches its maximum angle of attack. This condition specifies a favourable transverse placement of $\Delta L_y = c$
, while the corresponding target pitching angle of the trailing foil at this instant is approximately
$\Delta L_y = c$
, while the corresponding target pitching angle of the trailing foil at this instant is approximately $-\theta _{02}$
. Using (3.1), the resulting predicted phase difference
$-\theta _{02}$
. Using (3.1), the resulting predicted phase difference $\phi _{1-2}$
is close to
$\phi _{1-2}$
is close to $\pi$
.
$\pi$
.
Upstream wake structure and predicted trailing-foil motion. Clockwise and counter-clockwise vorticity are represented by blue and red, respectively.

To assess the validity of this prediction, a full parametric study was subsequently carried out. As shown in figure 14, the optimal $\phi _{1-2}$
lies within the predicted interval. Despite the increased streamwise spacing, the peak performance is observed in the OP-type interaction, in agreement with the prediction. This confirms the robustness of the constructive interaction to variations in streamwise separation. Moreover, the results are consistent with the concepts of the global-phase and wake-phase models (Kinsey & Dumas Reference Kinsey and Dumas2012; Ribeiro et al. Reference Ribeiro, Su, Guillaumin, Breuer and Franck2021), reinforcing the view that optimal energy extraction is governed primarily by the nature of the interaction mode itself. Identifying the dominant interaction mode therefore provides a powerful predictive tool, allowing a more targeted selection of phase differences and significantly reducing the need for exhaustive parametric sweeps. In practical design applications, this suggests that a narrow search around the predicted phase difference is sufficient to identify the optimal configuration.
$\phi _{1-2}$
lies within the predicted interval. Despite the increased streamwise spacing, the peak performance is observed in the OP-type interaction, in agreement with the prediction. This confirms the robustness of the constructive interaction to variations in streamwise separation. Moreover, the results are consistent with the concepts of the global-phase and wake-phase models (Kinsey & Dumas Reference Kinsey and Dumas2012; Ribeiro et al. Reference Ribeiro, Su, Guillaumin, Breuer and Franck2021), reinforcing the view that optimal energy extraction is governed primarily by the nature of the interaction mode itself. Identifying the dominant interaction mode therefore provides a powerful predictive tool, allowing a more targeted selection of phase differences and significantly reducing the need for exhaustive parametric sweeps. In practical design applications, this suggests that a narrow search around the predicted phase difference is sufficient to identify the optimal configuration.
(a) Comparison for two streamwise spacings, $\Delta L_x=4c$
and
$\Delta L_x=4c$
and $\Delta L_x=6c$
: cycle-averaged power coefficient, with the shaded region indicating the predicted optimal interval. (b) Interaction mode corresponding to the optimal case at
$\Delta L_x=6c$
: cycle-averaged power coefficient, with the shaded region indicating the predicted optimal interval. (b) Interaction mode corresponding to the optimal case at $\Delta L_x=6c$
,
$\Delta L_x=6c$
, $\Delta L_y=c$
and
$\Delta L_y=c$
and $\phi _{1-2}=-0.9\pi$
(OP-type interaction).
$\phi _{1-2}=-0.9\pi$
(OP-type interaction).

3.2.2. Applicability to variations in trailing-foil amplitude
Attention is now turned to the influence of the trailing-foil amplitude on the interaction modes. In particular, this section examines the case in which both foils oscillate with equal amplitudes of $h_0^*=1$
, a configuration that has been widely adopted in previous studies of tandem wings (Kinsey & Dumas Reference Kinsey and Dumas2012; Ribeiro et al. Reference Ribeiro, Su, Guillaumin, Breuer and Franck2021; He et al. Reference He, Yang, Mo, Zhao, Wang and Ghassemi2022; Ribeiro & Franck Reference Ribeiro and Franck2024). Both tandem and staggered arrangements are considered to assess the effect of the trailing-foil amplitude. Since the streamwise spacing does not influence the results, a value of
$h_0^*=1$
, a configuration that has been widely adopted in previous studies of tandem wings (Kinsey & Dumas Reference Kinsey and Dumas2012; Ribeiro et al. Reference Ribeiro, Su, Guillaumin, Breuer and Franck2021; He et al. Reference He, Yang, Mo, Zhao, Wang and Ghassemi2022; Ribeiro & Franck Reference Ribeiro and Franck2024). Both tandem and staggered arrangements are considered to assess the effect of the trailing-foil amplitude. Since the streamwise spacing does not influence the results, a value of $\Delta L_x=4c$
is used throughout this section. As shown in figure 15, the pitching angle of the leading foil is approximately
$\Delta L_x=4c$
is used throughout this section. As shown in figure 15, the pitching angle of the leading foil is approximately $0$
at the time instant when the incoming vortex reaches
$0$
at the time instant when the incoming vortex reaches $\Delta L_x \approx 3.5c$
. Consistent with the previous analysis, the OP-type interaction is adopted as a representative constructive regime. At this instant, the incoming vortex is located at
$\Delta L_x \approx 3.5c$
. Consistent with the previous analysis, the OP-type interaction is adopted as a representative constructive regime. At this instant, the incoming vortex is located at $\Delta L_y \approx c$
. Accordingly, the trailing foil is positioned at
$\Delta L_y \approx c$
. Accordingly, the trailing foil is positioned at $\Delta L_y=c$
to satisfy the spatial alignment condition illustrated in figure 10(c), from which the pitching angle of the trailing foil is predicted to be approximately
$\Delta L_y=c$
to satisfy the spatial alignment condition illustrated in figure 10(c), from which the pitching angle of the trailing foil is predicted to be approximately $-\theta _{02}$
. The corresponding phase difference
$-\theta _{02}$
. The corresponding phase difference $\phi _{1-2}$
is therefore expected to be close to
$\phi _{1-2}$
is therefore expected to be close to $0.5\pi$
, as evaluated using (3.1).
$0.5\pi$
, as evaluated using (3.1).
Upstream wake structure and predicted trailing-foil motion.

A comprehensive parametric study was then performed to evaluate the accuracy of this prediction. Figure 16 presents the efficiencies of the leading foil, trailing foil and the overall system for varying $\Delta L_y$
and
$\Delta L_y$
and $\phi _{1-2}$
. The results show that, across different
$\phi _{1-2}$
. The results show that, across different $\Delta L_y$
values, the trailing foil consistently achieves peak efficiency within
$\Delta L_y$
values, the trailing foil consistently achieves peak efficiency within $\phi _{1-2}=0.2\pi {-}0.8\pi$
, as predicted. The corresponding flow structures for selected cases under high-energy-extraction conditions are shown in figure 17. Owing to the identical streamwise spacing, the same
$\phi _{1-2}=0.2\pi {-}0.8\pi$
, as predicted. The corresponding flow structures for selected cases under high-energy-extraction conditions are shown in figure 17. Owing to the identical streamwise spacing, the same $\phi _{1-2}$
indicates that the incoming vortex shares a similar sense of rotation and spatial alignment relative to the foil. All cases exhibit features characteristic of OP-type interactions.
$\phi _{1-2}$
indicates that the incoming vortex shares a similar sense of rotation and spatial alignment relative to the foil. All cases exhibit features characteristic of OP-type interactions.
Efficiencies of the leading foil, trailing foil and the overall system for the case with trailing-foil heaving amplitude $h_{02}^*=1$
. The shaded region indicates the predicted optimal interval.
$h_{02}^*=1$
. The shaded region indicates the predicted optimal interval.

Representative flow structures under high-power-extraction conditions, corresponding to OP-type interactions at (a) $\Delta L_y=c$
and
$\Delta L_y=c$
and $\phi _{1-2}=0.6\pi$
and (b)
$\phi _{1-2}=0.6\pi$
and (b) $\Delta L_y=0$
and
$\Delta L_y=0$
and $\phi _{1-2}=0.6\pi$
.
$\phi _{1-2}=0.6\pi$
.

In addition, different local maxima are observed in ( $\Delta L_y=0.5c$
,
$\Delta L_y=0.5c$
, $\phi _{1-2}=-0.3\pi$
) and (
$\phi _{1-2}=-0.3\pi$
) and ( $\Delta L_y=0$
,
$\Delta L_y=0$
, $\phi _{1-2}=-0.6\pi$
) in figure 16. The corresponding representative flow structures at these local maxima are shown in figure 18. All of these cases are associated with the SS-type interaction, which serves as an alternative constructive mode for enhancing energy extraction. It should be noted that the case with
$\phi _{1-2}=-0.6\pi$
) in figure 16. The corresponding representative flow structures at these local maxima are shown in figure 18. All of these cases are associated with the SS-type interaction, which serves as an alternative constructive mode for enhancing energy extraction. It should be noted that the case with $\Delta L_y=0$
involves symmetric interactions with the incoming vortex during both the upstroke and downstroke. Although an SS-type interaction eventually develops, the initial SP-type interaction, being unfavourable, undermines its benefit. These local maxima indicate that an initially unfavourable SP-type interaction transitions to a constructive SS-type interaction, resulting in enhanced power recovery. This finding validates the proposed classification framework, demonstrating that optimal energy harvesting conditions can be identified from the characteristics of the wake structure alone without exhaustive parameters sweeps. Moreover, it reveals that constructive and destructive interaction modes can partially cancel each other out. For practical design, it is therefore essential to identify and promote constructive interaction modes while suppressing destructive ones in order to maximise overall energy-harvesting efficiency.
$\Delta L_y=0$
involves symmetric interactions with the incoming vortex during both the upstroke and downstroke. Although an SS-type interaction eventually develops, the initial SP-type interaction, being unfavourable, undermines its benefit. These local maxima indicate that an initially unfavourable SP-type interaction transitions to a constructive SS-type interaction, resulting in enhanced power recovery. This finding validates the proposed classification framework, demonstrating that optimal energy harvesting conditions can be identified from the characteristics of the wake structure alone without exhaustive parameters sweeps. Moreover, it reveals that constructive and destructive interaction modes can partially cancel each other out. For practical design, it is therefore essential to identify and promote constructive interaction modes while suppressing destructive ones in order to maximise overall energy-harvesting efficiency.
Representative flow structures under high-power-extraction conditions, corresponding to SS-type interactions at (a) $\Delta L_y=0$
and
$\Delta L_y=0$
and $\phi _{1-2}=-0.6\pi$
and (b)
$\phi _{1-2}=-0.6\pi$
and (b) $\Delta L_y=0.5c$
and
$\Delta L_y=0.5c$
and $\phi _{1-2}=-0.3\pi$
.
$\phi _{1-2}=-0.3\pi$
.

As shown in figure 16, although the staggered configuration improves the trailing foil’s energy-extraction efficiency in the wake, it does not produce a corresponding improvement in the overall system efficiency. The efficiency is computed based on the combined swept area of both foils, as defined in (2.6). Since the beneficial vortex–foil interaction occupies only a brief segment of each oscillation cycle, its contribution is diluted when averaged over the full cycle and total area, resulting in only a marginal net gain.
These results further demonstrate that, even with variations in the kinematic parameters of the trailing foil, the optimal configurations continue to rely on the previously identified constructive interaction modes while avoiding destructive ones. This confirms the applicability of the classification framework for performance prediction across a range of trailing-foil kinematics.
3.2.3. Generality across wake conditions
In the preceding analyses, a leading-foil configuration with $\theta _{01}=76.33^\circ$
,
$\theta _{01}=76.33^\circ$
, $f^*=0.14$
and
$f^*=0.14$
and $h_{01}^*=1$
was employed to generate the upstream wake. To evaluate the robustness of the identified interaction modes under modified wake conditions, an alternative set of parameters is now considered for the leading foil. Specifically,
$h_{01}^*=1$
was employed to generate the upstream wake. To evaluate the robustness of the identified interaction modes under modified wake conditions, an alternative set of parameters is now considered for the leading foil. Specifically, $\theta _{01}=60^\circ$
,
$\theta _{01}=60^\circ$
, $f^*=0.14$
and
$f^*=0.14$
and $h_{01}^*=0.5$
are prescribed, resulting in a narrower wake in which the shed LEVs remain concentrated near
$h_{01}^*=0.5$
are prescribed, resulting in a narrower wake in which the shed LEVs remain concentrated near $\Delta L_y=\pm 0.5c$
. The trailing foil is assigned the same kinematic parameters as the leading foil. A similar prediction procedure is then carried out. As shown in figure 19, when the incoming vortex approaches
$\Delta L_y=\pm 0.5c$
. The trailing foil is assigned the same kinematic parameters as the leading foil. A similar prediction procedure is then carried out. As shown in figure 19, when the incoming vortex approaches $\Delta L_x \approx 3.5c$
, the pitching angle of the leading foil is approximately
$\Delta L_x \approx 3.5c$
, the pitching angle of the leading foil is approximately $-20^\circ$
. Based on the optimal OP-type interaction, the trailing foil is positioned at
$-20^\circ$
. Based on the optimal OP-type interaction, the trailing foil is positioned at $\Delta L_y = 0.5c$
, where its pitching angle is predicted to be about
$\Delta L_y = 0.5c$
, where its pitching angle is predicted to be about $-\theta _{02}$
. Using (3.1), the corresponding phase difference is therefore expected to be close to
$-\theta _{02}$
. Using (3.1), the corresponding phase difference is therefore expected to be close to $0.4\pi$
.
$0.4\pi$
.
Upstream wake structure and predicted trailing-foil motion.

Efficiencies of the leading foil, trailing foil and the overall system for the case with leading-foil heaving amplitude $h_{01}^*=0.5$
.
$h_{01}^*=0.5$
.

The validity of this prediction is further examined through parametric simulations. Figure 20 presents the efficiencies of the leading foil, the trailing foil and the overall system under this modified wake. For $\Delta L_y=0.5c$
, the trailing foil achieves peak efficiency when
$\Delta L_y=0.5c$
, the trailing foil achieves peak efficiency when $\phi _{1-2}=0.3\pi$
. This corresponds to the OP-type interaction shown in figure 21(a). When
$\phi _{1-2}=0.3\pi$
. This corresponds to the OP-type interaction shown in figure 21(a). When $\Delta L_y=0$
, the optimal efficiency is observed at
$\Delta L_y=0$
, the optimal efficiency is observed at $\phi _{1-2}=-0.4\pi$
, which is associated with the SS-type interaction, as shown in figure 21(b). In this case, constructive interactions occur during both the upstroke and the downstroke. However, for the case of
$\phi _{1-2}=-0.4\pi$
, which is associated with the SS-type interaction, as shown in figure 21(b). In this case, constructive interactions occur during both the upstroke and the downstroke. However, for the case of $\Delta L_y=0.5c$
, the OP-type interaction enhances performance only during the downstroke. Compared with tandem configurations using
$\Delta L_y=0.5c$
, the OP-type interaction enhances performance only during the downstroke. Compared with tandem configurations using $h_0^*=1$
, the overall system efficiency is significantly improved. The compact vortex structure generated by the leading foil allows the trailing foil to engage in constructive interaction modes twice within a flapping cycle, thereby enhancing energy-extraction efficiency. This highlights the critical role of the upstream wake structure in determining the overall system efficiency.
$h_0^*=1$
, the overall system efficiency is significantly improved. The compact vortex structure generated by the leading foil allows the trailing foil to engage in constructive interaction modes twice within a flapping cycle, thereby enhancing energy-extraction efficiency. This highlights the critical role of the upstream wake structure in determining the overall system efficiency.
Representative flow structures under high-power-extraction conditions at (a) $\Delta L_y=0.5c$
,
$\Delta L_y=0.5c$
, $\phi _{1-2}=0.3\pi$
(OP-type interaction) and (b)
$\phi _{1-2}=0.3\pi$
(OP-type interaction) and (b) $\Delta L_y=0$
,
$\Delta L_y=0$
, $\phi _{1-2}=-0.4\pi$
(SS-type interaction).
$\phi _{1-2}=-0.4\pi$
(SS-type interaction).

Importantly, even under modified wake structures, the trailing foil still achieves optimal performance by making use of the same constructive interaction modes identified earlier. This confirms the robustness of the classification framework and highlights its predictive capability across a broad range of upstream wake conditions. These examples validate the accuracy of the mechanism-based performance prediction across a range of trailing-foil kinematics and upstream wake structures. By recognising the specific combinations of the four interaction modes, one can rapidly identify optimal trajectory regions. This approach effectively avoids inefficient regimes and greatly reduces the need for exhaustive parametric studies across a wide range of kinematic parameters.
4. Conclusion
In this study, the influence of an incoming vortex on the unsteady force of a flapping foil is investigated in order to understand its effects on the power-extraction capability. The goal is to develop a general theoretical framework for predicting and designing multiple foil energy-harvesting systems. By controlling the phase difference and the transverse spacing, we systematically varied the temporal and spatial offsets between the incoming vortex and the flapping foil. Based on vortex rotation and relative interaction position, the interactions are classified into four canonical modes that govern the mechanisms of energy exchange between the incoming vortex and the trailing foil. The combinations of these fundamental modes determine both high-performance and low-performance configurations.
Among four interaction modes, two are identified as constructive. These interactions enhance the energy-harvesting efficiency of the trailing foil by increasing unsteady lift through local flow modifications that strengthen LEV formation or promote its roll-up. The most favourable interaction occurs when a counter-rotating incoming vortex impinges on the side opposite to the LEV, corresponding to the OP-type interaction. This interaction typically improves the strength of the LEV and increases the magnitude of the lift. Within this class, the optimal configuration is achieved when the vortex impinges near stroke reversal. In this situation, the incoming vortex merges with the LEV and transfers its energy entirely to it. This process enhances the strength of the LEV and maintains lift during stroke reversal, thereby supporting sustained energy extraction. A secondary beneficial interaction arises when a co-rotating incoming vortex engages on the suction side (SS-type interaction). Sweeping along the foil surface, it assists LEV formation and improves energy-harvesting performance.
Two types of destructive interactions are also identified. When the counter-rotating incoming vortex engages directly on the suction side, it produces a pronounced instantaneous lift enhancement. Force decomposition based on the FMPM framework indicates that the primary influence of the incoming vortex on unsteady forces arises from modifications to the local velocity induced by the vortex, rather than through the direct suction of its low-pressure core. However, this enhancement is typically short-lived due to rapid downstream convection, resulting in only a modest contribution to cycle-averaged power extraction. The most detrimental case occurs when a co-rotating vortex acts on the side opposite to the LEV, inducing a velocity field that deflects the incoming flow, reduces the effective angle of attack, suppresses LEV formation and weakens lift.
A mechanism-based predictive framework is developed based on the systematic classification of vortex–foil interactions and the identified mechanisms of constructive interactions. The validity and generality of this framework are demonstrated through systematic variations of inter-foil spacing, trailing-foil kinematics and upstream wake structures. It is observed that all high-performance cases correspond to interactions characterised by the two identified constructive interactions and their mechanism of enhancing energy-harvesting efficiency. Although only a qualitative range of the optimal configuration is provided, this mechanism-based framework enables rapid and effective prediction of optimal configurations without the need for exhaustive exploration of the kinematic parameter space. Its general applicability extends to a broad class of vortex–foil interaction problems beyond tandem-foil systems with identical kinematics. Furthermore, while the present study focuses on a two-foil system to isolate the fundamental vortex–foil interactions, the mechanism-based framework can be extended to multi-foil configurations. By using the upstream wake as an input condition, the optimal kinematics for the trailing row of foils can be predicted. In configurations with multiple rows, this naturally leads to a sequential design strategy, where the kinematics of each downstream row are determined based on the wake structures generated by the upstream foils. Although configurations with more than two foils have not been explicitly tested here, this approach establishes a practical pathway for future studies on high-density foil arrays, enabling rapid identification of near-optimal kinematics without exhaustive parameter sweeps.
It should be emphasised that the present predictive framework is formulated on the basis of two-dimensional flow physics and considers interactions with a single dominant primary vortex. While this approach enables a clear and systematic mapping of the fundamental interaction mechanisms, its applicability to fully three-dimensional configurations remains inherently limited. In three-dimensional flows, particularly for low-aspect-ratio foils, wingtip vortices may disrupt the two-dimensional coherence of the wake. Moreover, more complex wake topologies, such as interacting vortex pairs, require further investigation. Nevertheless, the current study provides a valuable insight into vortex–foil interactions, enabling the design of trailing-foil trajectories informed by upstream wake structures and constructive interaction modes, thereby demonstrating its predictive capability in identifying configurations that optimise energy extraction in unsteady flow environments.
Funding
This work was supported by the Australian Research Council (grant numbers DP200101500 and DP240100294) and conducted with the assistance of computational resources from the National Computational Infrastructure (NCI), which is supported by the Australian Government.
Declaration of interests
The authors report no conflict of interest.
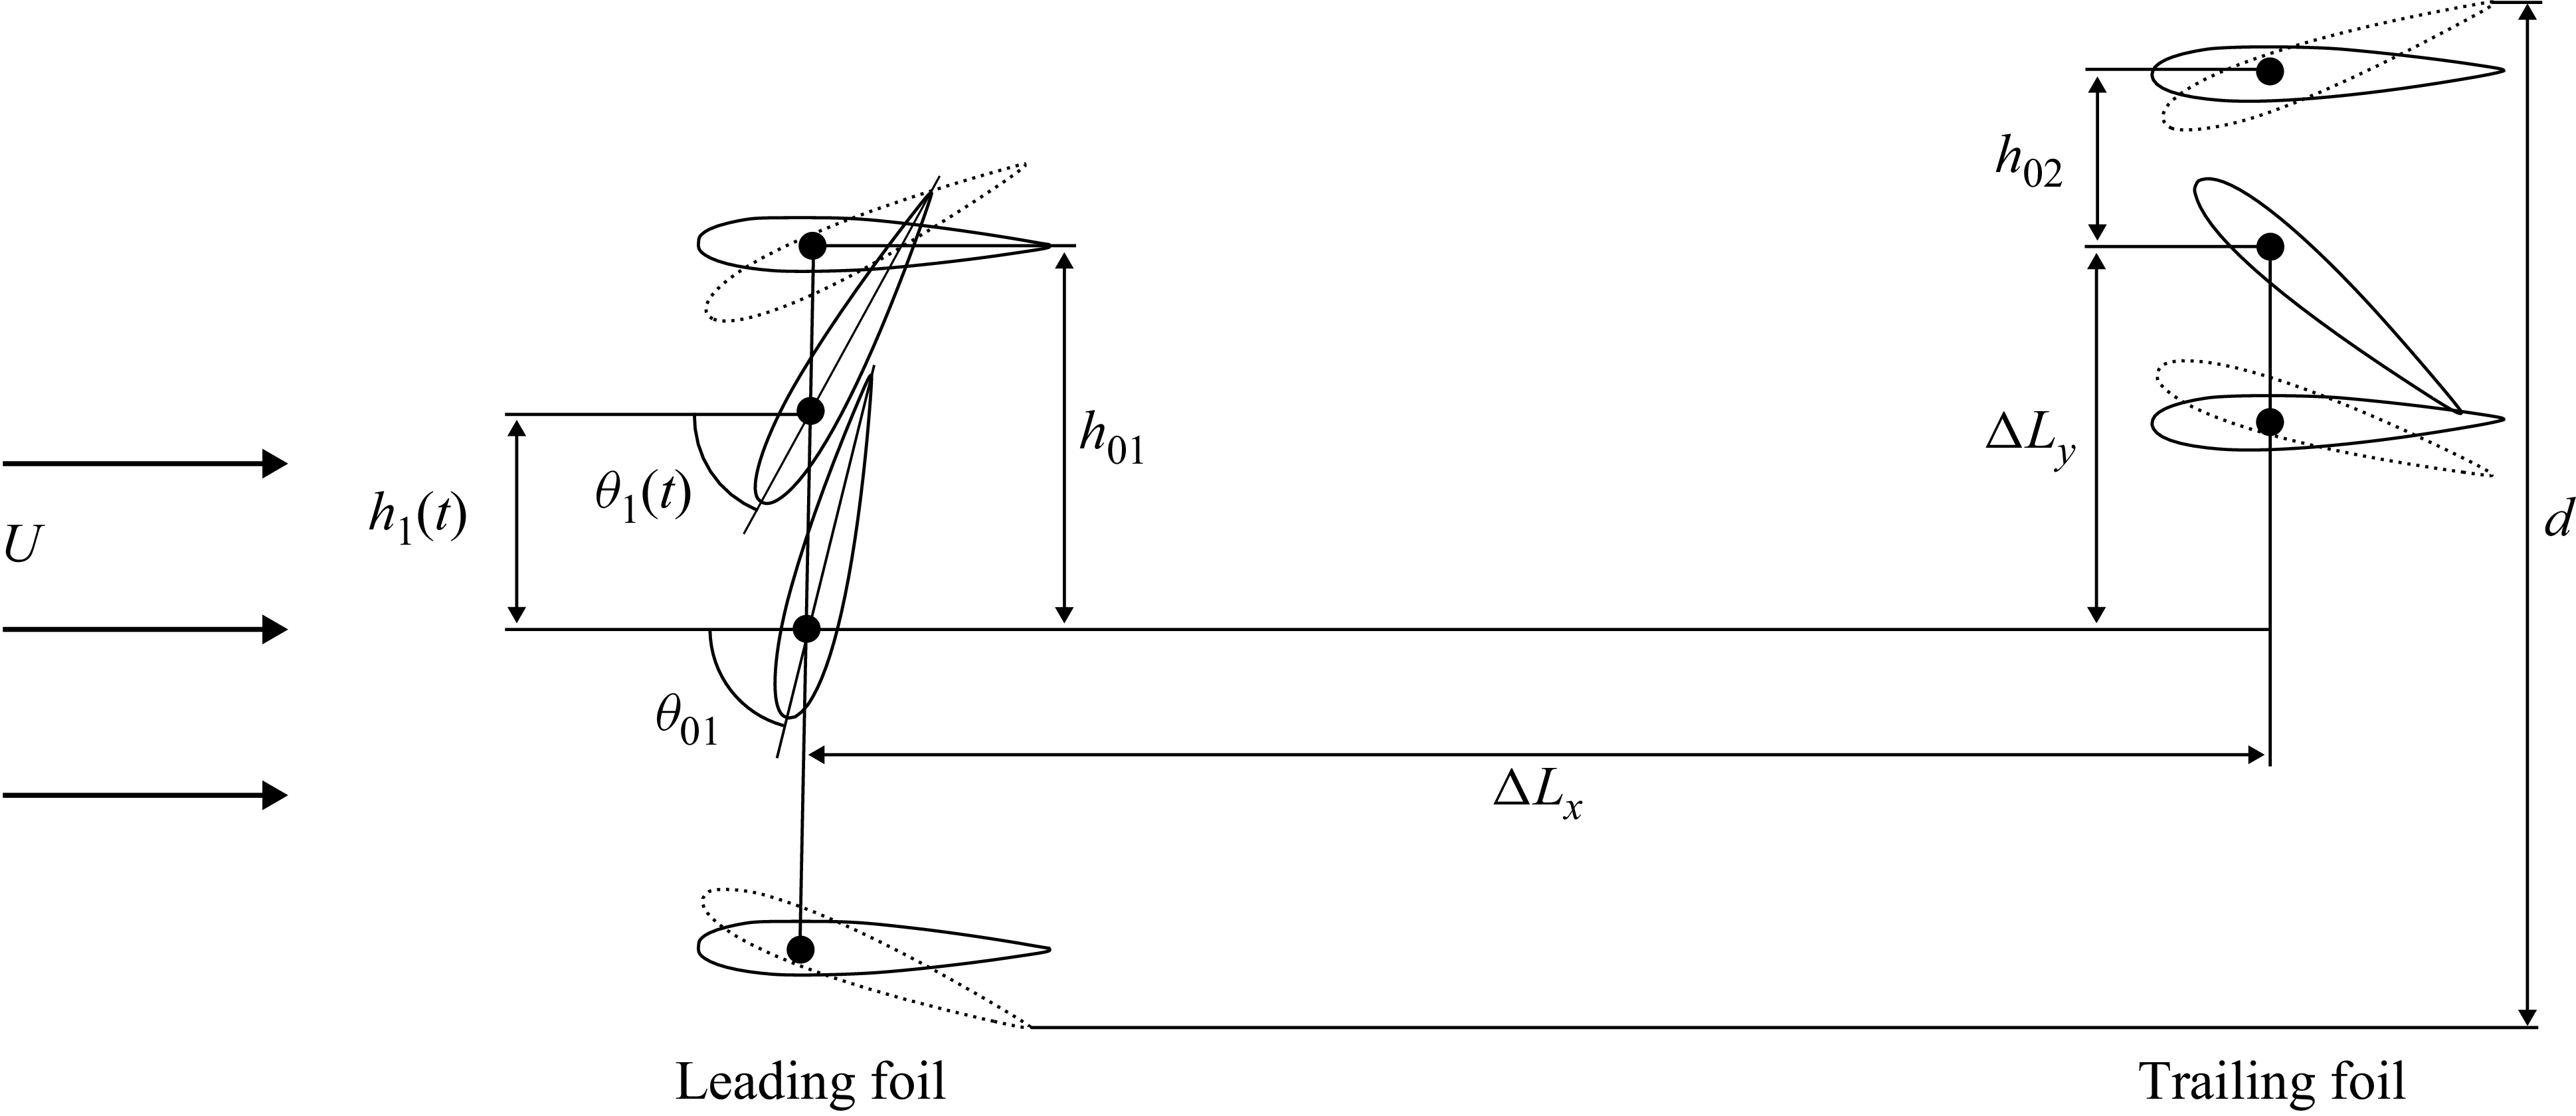


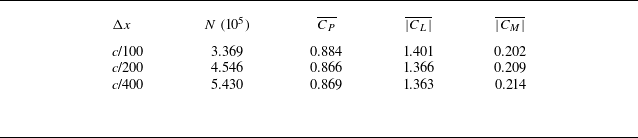


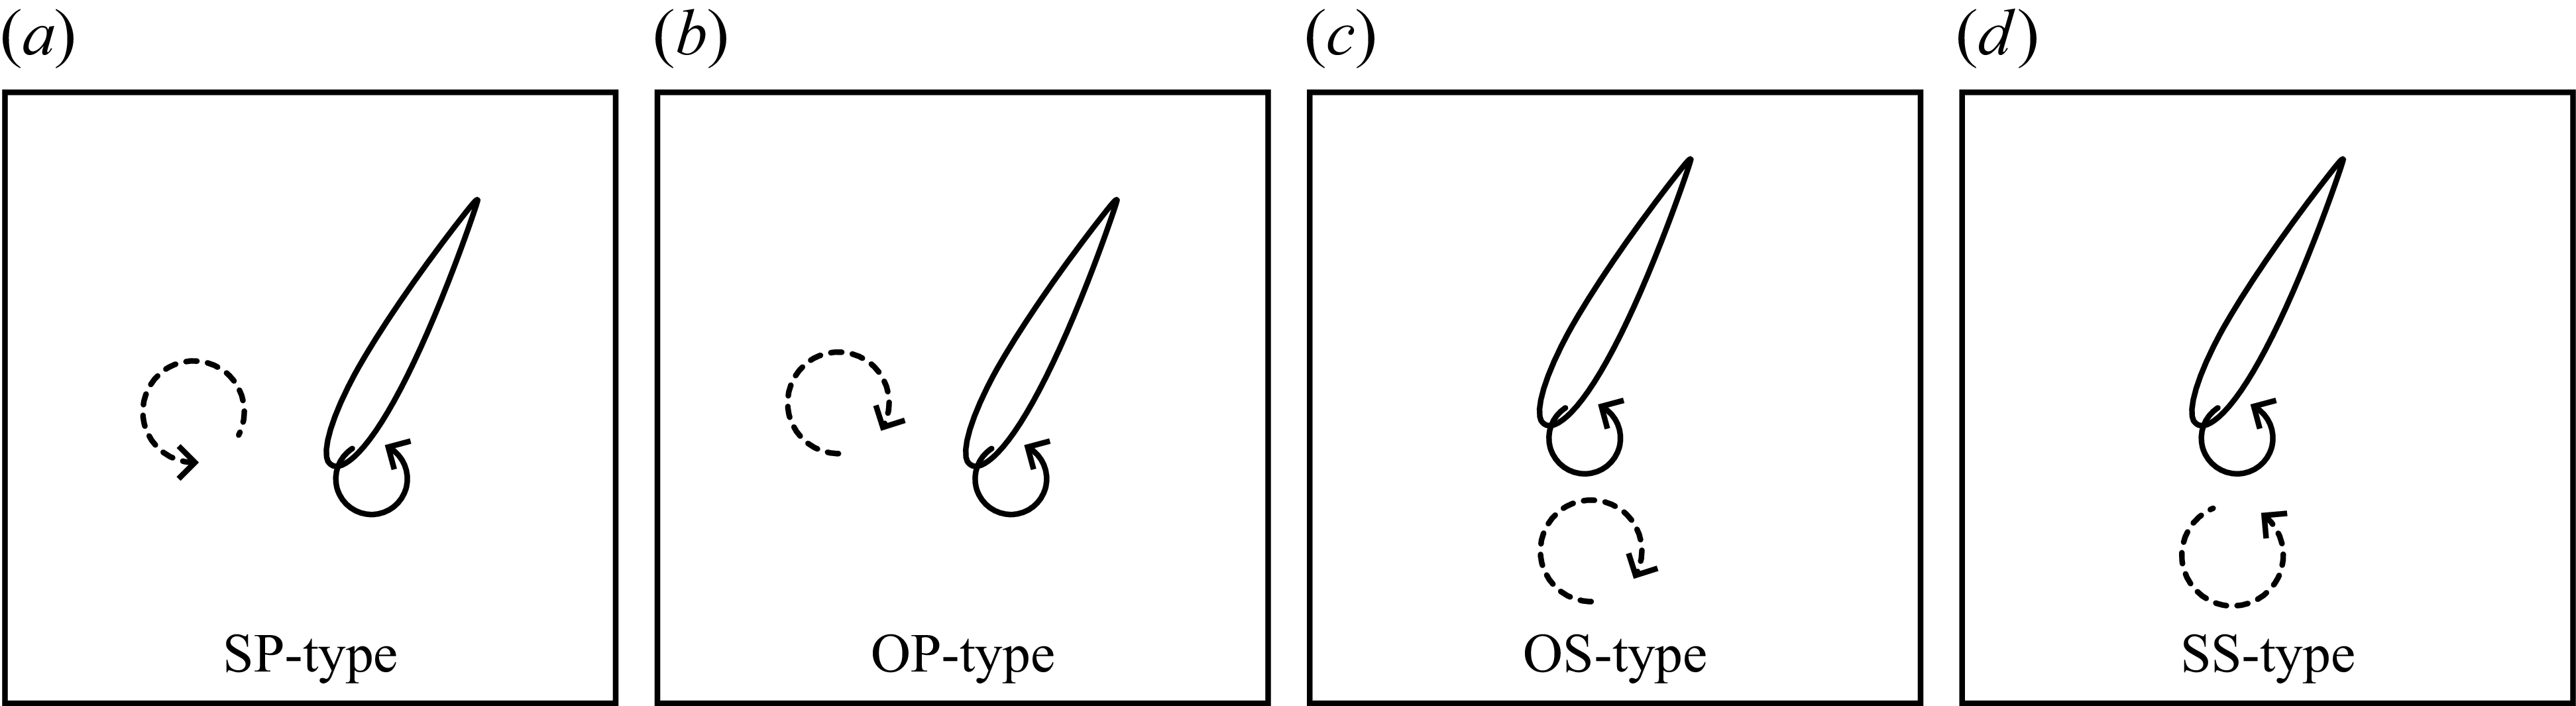


 Open access