


Introduction
Under what conditions do racial minority candidates enter and win elections in particular districts? Answers to this question provide critical normative and policy implications related to the Voting Rights Act (VRA) and redistricting in the U.S. (Bullock Reference Bullock2010; Davidson and Grofman Reference Davidson and Grofman1994; Grofman Reference Grofman1998; Grofman, Handley, and Niemi Reference Grofman, Handley and Niemi1992). To explain when and why minority candidates emerge or not, the literature provides two competing theories, which emphasize either voter demand (Abosch, Barreto, and Woods Reference Abosch, Barreto, Woods and Henderson2007; Branton Reference Branton2009; Casellas Reference Casellas2011; Davidson and Grofman Reference Davidson and Grofman1994; Lublin Reference Lublin1997; Lublin et al. Reference Lublin, Brunell, Grofman and Handley2009; Trounstine and Valdini Reference Trounstine and Valdini2008) or minority candidate supply (Fraga, Juenk, and Shah Reference Fraga, Juenke and Shah2020; Juenke Reference Juenke2014; Juenke and Shah Reference Juenke and Shah2015; Reference Juenke and Shah2016; Shah Reference Shah2014), but the interaction between the two has not been fully explored (but see Canon Reference Canon1999; Lublin et al. Reference Lublin, Handley, Brunell and Grofman2019). This article integrates these competing theories under a unified theory of minority candidates’ strategic entry: minority candidates decide to run for office when they see a high probability of winning based on district racial composition and prior electoral performance of coethnic candidates. Consequently, I argue that the percentage of minority voters in a district remains the most important determinant of minority descriptive representation (Handley, Grofman, and Arden Reference Handley, Grofman, Arden and Grofman1998; Hicks et al. Reference Hicks, Klarner, McKee and Smith2018; Lublin Reference Lublin1997; Lublin et al. Reference Lublin, Handley, Brunell and Grofman2019; Reingold Reference Reingold2019), but its influence varies by the performance of minority candidates relative to their white counterparts in the most recent election (and vice versa), which is a function of a host of other factors, including the relative turnout rates of minority and white voters, the cohesion of these groups, and strategic coordination among candidates.
This article makes several contributions to the literature on minority representation and racial and ethnic politics. First, it introduces a quantitatively predictive logical model of minority representation following an influential approach in comparative politics (Li and Shugart Reference Li and Shugart2016; Shugart and Taagepera Reference Shugart and Taagepera2017; Sikk and Taagepera Reference Sikk and Taagepera2014; Taagepera Reference Taagepera2007; Reference Taagepera2008; Taagepera and Nemčok Reference Taagepera and Nemčok2019; Taagepera and Sikk Reference Taagepera and Sikk2010). Specifically, I develop a parsimonious mathematical formula based on deductive logic that can logically explain and accurately predict minority candidate emergence and electoral success in first-past-the-post (FPTP) elections. The logical model states that the probability of minority candidate emergence is a deterministic function of (1) the vote shares of the most vote-earning minority and white candidates in the most recent election and (2) the percentage of minority voters in the electorate. It suggests that minority candidates enter races when they see a high probability of winning, which they estimate using information from the most recent election and district racial composition.
Moreover, I demonstrate how the logical model unifies a range of factors that affect minority descriptive representation. Specifically, I discuss that the past minority electoral performance depends on the proportion and turnout of minority voters (Grofman, Handley, and Lublin Reference Grofman, Handley and Lublin2001), the level of minority bloc voting and white crossover (or racially polarized voting) (Engstrom Reference Engstrom2015), and strategic coordination among minority candidates (Schousen, Canon, and Sellers Reference Schousen, Canon, Sellers and Grofman1998). These three factors in turn depend on many variables, including the sense of “electoral influence” (Fraga Reference Fraga2018); district partisanship (Juenke and Shah Reference Juenke and Shah2016; Lublin et al. Reference Lublin, Handley, Brunell and Grofman2019); incumbency (Casellas Reference Casellas2011; Voss and Lublin Reference Voss and Lublin2001); “racial threat” and “social contact” (Avery and Fine Reference Avery and Fine2012; Key Reference Key1949; Liu Reference Liu2001a; Reference Liu2001b; Oliver and Wong Reference Oliver and Wong2003); urbanization and residential segregation (Rocha and Espino Reference Rocha and Espino2009; Voss and Miller Reference Voss and Miller2001); the relative balance between minority and white voters (Liu and Vanderleeuw Reference Liu and Vanderleeuw2007); the legacy of slavery-based economy (Acharya, Blackwell, and Sen Reference Acharya, Blackwell and Sen2020); and election and candidate-specific factors such as candidates’ names (Casellas Reference Casellas2011, 91–93), scandals (Parent and Perry Reference Parent, Perry, Bullock and Rozell2017), deracialized campaigns (Vanderleeuw, Liu, and Marsh Reference Vanderleeuw, Liu and Marsh2004), and natural disasters (Liu and Vanderleeuw Reference Liu and Vanderleeuw2007). Additionally, I show that the percentage of minority voters is important because it is closely related to the concept of the threshold of exclusion (Brischetto and Engstrom Reference Brischetto and Engstrom1997; Engstrom Reference Engstrom2010; Rae, Hanby, and Loosemore Reference Rae, Hanby and Loosemore1971). In short, the logical model systematically summarizes a set of important factors into a single equation with only two terms, which also reconciles previous debates over the necessity of majority-minority districts in electing minority candidates (Cameron, Epstein, and O’Halloran Reference Cameron, Epstein and O’Halloran1996; Grofman, Handley, and Lublin Reference Grofman, Handley and Lublin2001; Lublin Reference Lublin1997; Reference Lublin1999; Lublin et al. Reference Lublin, Handley, Brunell and Grofman2019).
Furthermore, I empirically assess the model predictions by leveraging two unique data on mayoral elections in Louisiana from 1986 to 2016 and state legislative general elections in 36 states in 2012 and 2014. The results show that the logical model can accurately predict about 90% of Black, Latino, and Asian candidate emergence and about 95% of electoral success in 41 different electoral contexts.
Finally, I illustrate how researchers can use the logical model to answer many important questions in redistricting and voting rights cases (for other useful tools in redistricting, see e.g., Cho and Cain Reference Cho and Cain2020; Gelman and King Reference Gelman and King1994; Kaufman, King, and Komisarchik Reference Kaufman, King and KomisarchikForthcoming; McGhee Reference McGhee2020). I demonstrate that the logical model can be used to (1) predict the probability of minority electoral success in various conditions (e.g., with different percentages of minority voters, levels of minority bloc voting and white crossover, and voter turnout), (2) compute how much increasing the percentage of minority voters in a district from A (e.g., less than 50) to B (e.g., over 50) changes the probability of minority electoral success (Hicks et al. Reference Hicks, Klarner, McKee and Smith2018), (3) discover what percentage of minority voters is “sufficient to provide [them] with a realistic opportunity to elect their candidates of choice” in given districts (Davidson and Grofman Reference Davidson and Grofman1994, 5) with an electoral “sweet spot” (Lublin et al. Reference Lublin, Handley, Brunell and Grofman2019), (4) quantify how much a given district may potentially dilute minority voting strength by “packing” minority voters (Bullock Reference Bullock2010; Gerken Reference Gerken2001), and (5) predict the number of minority officeholders at the jurisdiction level (Grofman, Handley, and Lublin Reference Grofman, Handley and Lublin2001, 1387). To facilitate future applications, I offer an easy-to-use R package logical that implements all the procedures discussed in this article and Appendix C.
Voter-Demand and Candidate-Supply Theories
To explain the relative lack of minority descriptive representation, scholars have considered two competing theories: voter-demand and candidate-supply theories (Juenke and Shah Reference Juenke and Shah2015; Reference Juenke and Shah2016).Footnote 1 The demand-side theory sees the relative dearth of minority politicians as a minority candidate defeat problem. According to this viewpoint, minority candidates cannot win electoral contests outside of majority-minority districts due to strong opposition from white voters (Abosch, Barreto, and Woods Reference Abosch, Barreto, Woods and Henderson2007; Branton Reference Branton2009; Casellas Reference Casellas2011; Davidson and Grofman Reference Davidson and Grofman1994; Lublin Reference Lublin1997; Lublin et al. Reference Lublin, Brunell, Grofman and Handley2009; Trounstine and Valdini Reference Trounstine and Valdini2008).Footnote 2 Thus, the relative lack of minority representatives is the result of white voters who do not vote for minority candidates. An important normative and policy implication of the voter demand theory is that creation and maintenance of majority-minority districts is the solution to minority underrepresentation (but see Cameron, Epstein, and O’Halloran Reference Cameron, Epstein and O’Halloran1996; Grofman, Handley, and Lublin Reference Grofman, Handley and Lublin2001; Lublin et al. Reference Lublin, Handley, Brunell and Grofman2019).Footnote 3
In contrast, more recent scholarship based on the supply-side theory describes minority underrepresentation as a minority candidate retreat problem. The supply-side theorists argue that minority candidates often have good chances of winning even outside of majority-minority districts once they enter races (Fraga, Juenke, and Shah Reference Fraga, Juenke and Shah2020; Juenke Reference Juenke2014; Juenke and Shah Reference Juenke and Shah2015; Reference Juenke and Shah2016; Shah Reference Shah2014). Therefore, the lack of minority representatives is due to potential minority candidates who decide not to run for office.Footnote 4 One implication of this theory is that one can improve minority representation by providing potential minority candidates with high-quality information about the likelihood of winning and more resources to campaign (Fraga, Juenke, and Shah Reference Fraga, Juenke and Shah2020; Juenke and Shah Reference Juenke and Shah2015; Reference Juenke and Shah2016).
While each theory advances our understanding of minority representation, there are several unsolved problems. First, previous research does not explicitly specify a condition under which potential minority candidates run for office (e.g., minority candidates emerge when A is greater than B). Next, while both theories recognize that white voters are less likely to vote for minority candidates, they do not fully quantify the variation of white crossover voting in different elections and explain how minority candidates respond to it. Finally, neither camp provides any quantitative and theoretical prediction about the probability of minority candidate emergence and electoral success. Instead, previous research leaves any predictions to associated statistical models, the details of which (e.g., functional form) are rarely theoretically determined. Indeed, almost all predicted probabilities reported in the literature are not predictions from theoretical models but rather simulations based on statistical models (with estimated coefficients and some typical values of independent variables). These simulation-based probabilities are extremely dependent on specific data and statistical assumptions that one employs and are often not available to (and used by) other researchers (but see, Lublin et al. Reference Lublin, Handley, Brunell and Grofman2019).Footnote 5
Below, I demonstrate how the proposed model solves these problems and unifies the competing theories. Unlike existing studies, the logical model makes precise quantitative predictions for any district with no statistical estimation.
A Logical Model of Minority Candidate Emergence
This section first introduces a logical model of minority candidate emergence. It then discusses how the model relates to various concepts and visualizes its quantitative predictions and their implications.Footnote 6
Quantitatively Predictive Logical Models
To theorize minority candidate emergence, I adopt a powerful approach in comparative politics to derive a quantitatively predictive logical model (or logical model) (Li and Shugart Reference Li and Shugart2016; Shugart and Taagepera Reference Shugart and Taagepera2017; Sikk and Taagepera Reference Sikk and Taagepera2014; Taagepera Reference Taagepera2007; Reference Taagepera2008; Taagepera and Nemčok Reference Taagepera and Nemčok2019; Taagepera and Sikk Reference Taagepera and Sikk2010).Footnote 7 This approach uses deductive logic (as opposed to statistical estimation or even data) to derive a parsimonious mathematical formula that can both explain and predict the outcome of interest.
A canonical example is the seat product model developed and extended primarily by Taagepera (Reference Taagepera2007) and Shugart and Taagepera (Reference Shugart and Taagepera2017). This model states that the (average) effective number of seat-winning parties in a given country ( $ {N}_s $
) is a deterministic function of its average district magnitude (M) and assembly size (S):
$ {N}_s $
) is a deterministic function of its average district magnitude (M) and assembly size (S):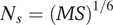 $ {N}_s={(MS)}^{1/6} $
. Research shows that the Seat Product (MS) can also explain and predict the effective number of vote-earning parties, deviation from proportionality, cabinet duration, and even the number of presidential candidates (Shugart and Taagepera Reference Shugart and Taagepera2017, 149).
$ {N}_s={(MS)}^{1/6} $
. Research shows that the Seat Product (MS) can also explain and predict the effective number of vote-earning parties, deviation from proportionality, cabinet duration, and even the number of presidential candidates (Shugart and Taagepera Reference Shugart and Taagepera2017, 149).
As this example illustrates, logical models have only few variables, which are (ideally) subject to change in order to assist in (re)designing political institutions. Thus, there is a direct link between theory and application under this approach. Logical models can sharply tell by how much the outcome of interest changes (i.e., quantitative predictions) if one varies specific parts of their formulas without any statistical estimation or data. For this reason, logical models can offer considerably detailed advice for electoral engineering and constitutional design, which have enormous effects on representation (Li and Shugart Reference Li and Shugart2016, 23).
Scope Conditions
I make four assumptions to model district-level minority candidate emergence. Here, I use the term district to refer to a geographically limited area in which a single candidate wins a single seat in the spirit of FPTP. Thus, “districts” considered here include legislative single-member districts, executive offices, and different positions under at-large elections (Abott and Magazinnik Reference Abott and Magazinnik2020).
Assumption 1 (Biracial Elections). Two racial groups (minority and white voters) compete with each other over a single seat.
This assumption clarifies that the proposed model predicts minority candidate emergence in “biracial elections” (Grofman, Handley, and Lublin Reference Grofman, Handley and Lublin2001, 1388).Footnote 8 Focusing on minority descriptive representation, I also assume that minority candidates are the only minority-preferred candidates while recognizing that the literature also discusses that white Democrats can be minority-preferred candidates in certain conditions (Handley, Grofman, and Arden Reference Handley, Grofman, Arden and Grofman1998; Schousen, Canon, and Sellers Reference Schousen, Canon, Sellers and Grofman1998).Footnote 9
Assumption 2 (Potential Candidates). There is always at least one minority politician who would run for office regardless of the number of minority voters in a district.
This assumption excludes the possibility that we do not observe any minority candidate because there is no minority politician in the “eligibility pool” of potential candidates (Fox and Lawless Reference Fox and Lawless2004; Lawless Reference Lawless2012).
Assumption 3 (Short-Term Instrumentally Rational Candidates). Minority candidates are short-term instrumentally rational such that their primary goal is to get elected in upcoming elections.
This assumption rules out the possibility that minority candidates emerge because of noninstrumental reasons or long-term benefits, such as raising voice for symbolic representation or earning name recognition for future candidacy.
Assumption 4 (The Most Viable Candidate). Whether a district has at least one minority candidate solely depends on the strategic decision of the most viable minority politician in the district.
This assumption states that, in each district, less viable minority politicians would not run for office unless the most viable minority politician runs.Footnote 10 This assumption allows me to model district-level minority candidate emergence as the decision making of the most viable minority politician whose sole agenda is to win an upcoming biracial election.
The Logical Model
I argue that the most viable minority candidates decide to run for office when they see a high probability of winning in the upcoming elections. I then theorize that they calculate the likelihood of winning from two sources of information: (1) the electoral performance of coethnic candidates in the most recent elections and (2) the racial composition of a district. Formally, I introduce the following logical model of minority candidate emergence:
 $$ {P}_{\mathrm{run}}=\Phi \left({(MC)}^{1/2}-50\right), $$
where $ {P}_{\mathrm{run}} $
is the probability of minority candidate emergence,
$ {P}_{\mathrm{run}} $
is the probability of minority candidate emergence, $ \Phi $
is a cumulative distribution function (CDF) of the standard normal distribution, and
$ \Phi $
is a cumulative distribution function (CDF) of the standard normal distribution, and $ MC $
is a product of two terms representing the two sources of information (detailed below). Here, I briefly describe how I obtained Equation 1 while leaving more detailed explanations to Appendix A.
$ MC $
is a product of two terms representing the two sources of information (detailed below). Here, I briefly describe how I obtained Equation 1 while leaving more detailed explanations to Appendix A.
Step I (Strategic Candidate Entry)
First, I model the probability of minority candidate entry by the probability that the most viable minority candidates think they can win (or the estimated probability of winning): $ {P}_{\mathrm{run}}={\hat{P}}_{\mathrm{win}} $
. This step builds upon the political ambition literature that theorizes that strategic candidates are more likely to run for office when they see a higher probability of winning (e.g., Black Reference Black1972; Branton Reference Branton2009; Lazarus Reference Lazarus2008).
$ {P}_{\mathrm{run}}={\hat{P}}_{\mathrm{win}} $
. This step builds upon the political ambition literature that theorizes that strategic candidates are more likely to run for office when they see a higher probability of winning (e.g., Black Reference Black1972; Branton Reference Branton2009; Lazarus Reference Lazarus2008).
Step II (The Racial Margin of Victory)
Next, I model the estimated probability of winning as a function of a new concept that I call the racial margin of victory. The racial margin of victory is a margin of victory for the most viable minority candidate. It represents how safely minority candidates win their seats relative to their white counterparts (e.g., landslide victory, close defeat, etc.). I show that it is half the difference between the vote shares that the top (i.e., most vote-earning) minority and white candidates receive: $ \frac{1}{2}\left({V}_t^M-{V}_t^W\right)\hskip1.5pt \in \hskip1.5pt \left(-50,50\right) $
in FPTP elections at time
$ \frac{1}{2}\left({V}_t^M-{V}_t^W\right)\hskip1.5pt \in \hskip1.5pt \left(-50,50\right) $
in FPTP elections at time $ t $
.Footnote
11
$ t $
.Footnote
11
To illustrate the key idea, suppose that these future vote shares are ex ante known before the election. Then, if the most viable minority candidate can obtain one more vote than her white counterpart (i.e., $ \frac{1}{2}\left({V}_t^M-{V}_t^W\right)>0 $
), she is expected to win with certainty (i.e.,
$ \frac{1}{2}\left({V}_t^M-{V}_t^W\right)>0 $
), she is expected to win with certainty (i.e., $ {\hat{P}}_{\mathrm{win}}=1 $
). Otherwise, she is expected to lose with certainty (i.e.,
$ {\hat{P}}_{\mathrm{win}}=1 $
). Otherwise, she is expected to lose with certainty (i.e., $ {\hat{P}}_{\mathrm{win}}=0 $
). More concisely, one can represent this idea as
$ {\hat{P}}_{\mathrm{win}}=0 $
). More concisely, one can represent this idea as
 which takes 1 if the inside condition holds or 0 otherwise.
In reality, no candidate can foresee the exact vote shares that she and other candidates obtain before the election, so the most viable minority candidate needs to guess these future vote shares. To formalize this idea, I model the estimated probability of winning by the standard normal CDF with the estimated racial margin of victory: $ {\hat{P}}_{\mathrm{win}}=\Phi \left(\frac{1}{2}\left({\hat{V}}_t^M-{\hat{V}}_t^W\right)\right), $
where
$ {\hat{P}}_{\mathrm{win}}=\Phi \left(\frac{1}{2}\left({\hat{V}}_t^M-{\hat{V}}_t^W\right)\right), $
where $ \Phi $
accounts for the uncertainty around their guesses. This equation states that when the estimated racial margin of victory is positive (negative), the probability of winning becomes increasingly higher (lower) than 0.5. In fact, the estimated racial margin of victory is what Fraga, Juenke, and Shah (Reference Fraga, Juenke and Shah2020, 772) called “perceptions of minority candidate viability.”
$ \Phi $
accounts for the uncertainty around their guesses. This equation states that when the estimated racial margin of victory is positive (negative), the probability of winning becomes increasingly higher (lower) than 0.5. In fact, the estimated racial margin of victory is what Fraga, Juenke, and Shah (Reference Fraga, Juenke and Shah2020, 772) called “perceptions of minority candidate viability.”
Step III (Two Logical Bounds)
Third, I argue that minority candidates can estimate the future racial margin of victory by considering two logical bounds (or limit cases). One limit scenario is that the future racial margin of victory (at time $ t $
) is equivalent to the racial margin of victory in the most recent election (at time
$ t $
) is equivalent to the racial margin of victory in the most recent election (at time $ t-1 $
), which I denote by
$ t-1 $
), which I denote by $ {M}_0=\frac{1}{2}\left({V}_{t-1}^M-{V}_{t-1}^W\right)\hskip1.5pt \in \hskip1.5pt \left(-50,50\right) $
.Footnote
12 The other extreme case is that it is identical to the racial margin of victory based on the district’s racial composition (with the assumption that minority and white voters cohesively vote for their coethnic candidates), which I denote by
$ {M}_0=\frac{1}{2}\left({V}_{t-1}^M-{V}_{t-1}^W\right)\hskip1.5pt \in \hskip1.5pt \left(-50,50\right) $
.Footnote
12 The other extreme case is that it is identical to the racial margin of victory based on the district’s racial composition (with the assumption that minority and white voters cohesively vote for their coethnic candidates), which I denote by $ {C}_0\hskip1.5pt \in \hskip1.5pt \left(-50,50\right) $
. The next subsection details what these two logical bounds mean substantively.
$ {C}_0\hskip1.5pt \in \hskip1.5pt \left(-50,50\right) $
. The next subsection details what these two logical bounds mean substantively.
I contend that the future racial margin of victory cannot be larger than $ {M}_0 $
and smaller than
$ {M}_0 $
and smaller than $ {C}_0 $
(and vice versa) and it will be located somewhere between the two logical bounds:
$ {C}_0 $
(and vice versa) and it will be located somewhere between the two logical bounds:
 $$ {C}_0\hskip1.5pt \le \hskip1.5pt \frac{1}{2}\left({\hat{V}}_t^M-{\hat{V}}_t^W\right)\hskip1.5pt \le \hskip1.5pt {M}_0\hskip1em \mathrm{or}\hskip1em {M}_0\hskip1.5pt \le \hskip1.5pt \frac{1}{2}\left({\hat{V}}_t^M-{\hat{V}}_t^W\right)\hskip1.5pt \le \hskip1.5pt {C}_0. $$
Given that, I argue that the most likely results (or our best guess) can be represented by the geometric mean (i.e., average) of these two extreme cases. Importantly, it is our best guess “in the absence of other information” (Shugart and Taagepera Reference Shugart and Taagepera2017, 105) and it could be off for actual (future) results due to various election or candidate-specific factors (see below). I use the geometric mean (over other metrics such as the arithmetic mean) because while $ {M}_0 $
may take extreme values in some elections (i.e., minority candidates may do extremely well or poorly), the geometric mean is robust to such extreme values and commonly used in the logical model approach (Taagepera Reference Taagepera2008, 120–27). Since
$ {M}_0 $
may take extreme values in some elections (i.e., minority candidates may do extremely well or poorly), the geometric mean is robust to such extreme values and commonly used in the logical model approach (Taagepera Reference Taagepera2008, 120–27). Since $ {M}_0 $
and
$ {M}_0 $
and $ {C}_0 $
may contain negative values and the geometric mean cannot be computed for negative values, however, I take the geometric mean of slightly adjusted quantities (
$ {C}_0 $
may contain negative values and the geometric mean cannot be computed for negative values, however, I take the geometric mean of slightly adjusted quantities ( $ M={M}_0+50 $
and
$ M={M}_0+50 $
and $ C={C}_0+50 $
) without changing any substantive meaning:
$ C={C}_0+50 $
) without changing any substantive meaning: $ {(MC)}^{1/2} $
. Finally, I model the estimated racial margin of victory as
$ {(MC)}^{1/2} $
. Finally, I model the estimated racial margin of victory as $ \frac{1}{2}\left({\hat{V}}_t^M-{\hat{V}}_t^W\right)={(MC)}^{1/2}-50 $
, where
$ \frac{1}{2}\left({\hat{V}}_t^M-{\hat{V}}_t^W\right)={(MC)}^{1/2}-50 $
, where $ -50 $
readjusts for the above transformation (see, again, Appendix A for more detailed explanations).
$ -50 $
readjusts for the above transformation (see, again, Appendix A for more detailed explanations).
Connecting all three steps, I obtain
 $$ {P}_{\mathrm{run}}={\hat{P}}_{\mathrm{win}}=\Phi \left(\frac{1}{2}\left({\hat{V}}_t^M-{\hat{V}}_t^W\right)\right)=\Phi \left({(MC)}^{1/2}-50\right). $$
The logical model states that minority candidate emergence can be explained by minority candidates’ decision-making process (as the supply-side theory argues). It also claims that minority candidates estimate the probability of winning by looking at past ( $ M $
) and expected (
$ M $
) and expected ( $ C $
) voter demand (as the demand-side theory contends). Consequently, the model unifies the two competing theories under a single equation.
$ C $
) voter demand (as the demand-side theory contends). Consequently, the model unifies the two competing theories under a single equation.
How $ M $
and
$ C $
Relate to Other Determinants of Minority Representation
$ M $
and
$ C $
Relate to Other Determinants of Minority Representation


At first glance, the logical model may look “too simple” because it potentially ignores many other important determinants of minority representation. In contrast, this subsection demonstrates that the model is simple because it hierarchically summarizes various factors that affect minority electoral success. Below, I discuss how the two logical bounds $ M $
and
$ M $
and $ C $
relate to many other concepts discussed in the literature.
$ C $
relate to many other concepts discussed in the literature.
$ M $
Summarizes a Variety of Factors

First, $ M $
is the racial margin of victory in the most recent election. It summarizes a range of information about factors that influence the electoral performance of minority candidates just as the effective number of parties summarizes complex information about “cohesion of parties and their ability to get one’s way in negotiations” (Taagepera Reference Taagepera2007, 285). Recall that
$ M $
is the racial margin of victory in the most recent election. It summarizes a range of information about factors that influence the electoral performance of minority candidates just as the effective number of parties summarizes complex information about “cohesion of parties and their ability to get one’s way in negotiations” (Taagepera Reference Taagepera2007, 285). Recall that $ M $
is a function of how many votes the top minority and white candidates received in the most recent election. These vote shares then offer rich information about how voters in particular districts behave in biracial elections. Figure 1 visualizes this chain of associations. Here, U represents a set of factors that influence
$ M $
is a function of how many votes the top minority and white candidates received in the most recent election. These vote shares then offer rich information about how voters in particular districts behave in biracial elections. Figure 1 visualizes this chain of associations. Here, U represents a set of factors that influence $ {V}_{t-1}^M $
and
$ {V}_{t-1}^M $
and $ {V}_{t-1}^W $
, whereas T denotes a set of elements that affect U (i.e., T
$ {V}_{t-1}^W $
, whereas T denotes a set of elements that affect U (i.e., T $ \to $
U
$ \to $
U $ \to $ $ {V}_{t-1}^M $
,
$ {V}_{t-1}^M $
, $ {V}_{t-1}^W $
).
$ {V}_{t-1}^W $
).
How the Racial Margin of Victory Relates to Other Factors
Note: The racial margin of victory ( $ M $
) is a function of the vote shares of the top minority and white candidates in the most recent election (
$ M $
) is a function of the vote shares of the top minority and white candidates in the most recent election ( $ {V}_{t-1}^M,{V}_{t-1}^W $
). These vote shares are in turn functions of three factors (U): the proportion and turnout of minority voters, degree of minority bloc and white crossover voting, and strategic coordination among minority and white candidates. U depends on various factors (T), including district partisanship, incumbency, geographical concentration of minorities, urbanization, residential segregation, and historical factors.
$ {V}_{t-1}^M,{V}_{t-1}^W $
). These vote shares are in turn functions of three factors (U): the proportion and turnout of minority voters, degree of minority bloc and white crossover voting, and strategic coordination among minority and white candidates. U depends on various factors (T), including district partisanship, incumbency, geographical concentration of minorities, urbanization, residential segregation, and historical factors.
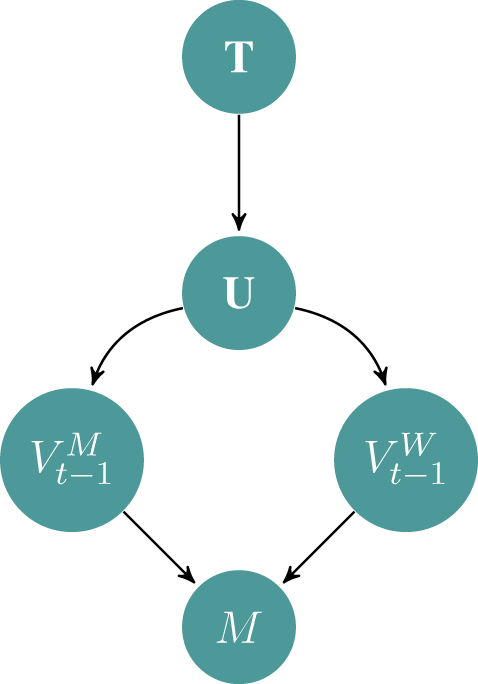
According to the literature, U has three factors: (1) the proportion of minority voters among those who turn out, (2) the strength of minority bloc and white crossover voting, and (3) the level of strategic coordination within minority and white candidates. It may seem intuitive that the proportion of minority voters affects $ {V}_{t-1}^M $
(and
$ {V}_{t-1}^M $
(and $ {V}_{t-1}^W $
) (i.e., the more minority voters, the more votes the top minority candidate receives). What seems less obvious is that
$ {V}_{t-1}^W $
) (i.e., the more minority voters, the more votes the top minority candidate receives). What seems less obvious is that $ M $
contains information about the turnout gap by race (the difference in turnout rates between minority and white voters) (Fraga Reference Fraga2018) in the most recent election. While accounting for the turnout gap has been a keystone in the literature (e.g., Grofman, Handley, and Lublin Reference Grofman, Handley and Lublin2001, 1404–07),
$ M $
contains information about the turnout gap by race (the difference in turnout rates between minority and white voters) (Fraga Reference Fraga2018) in the most recent election. While accounting for the turnout gap has been a keystone in the literature (e.g., Grofman, Handley, and Lublin Reference Grofman, Handley and Lublin2001, 1404–07), $ M $
incorporates it systematically.
$ M $
incorporates it systematically.
The strength of minority bloc and white crossover voting also matters (Lublin Reference Lublin1997, 47–48). Minority bloc voting means that minority voters cohesively vote for their coethnic candidates over other candidates. In contrast, white crossover voting means that white voters cast ballots on minority candidates instead of white candidates. In the literature on the VRA and redistricting, scholars often use the term racially polarized voting to describe the combination of minority bloc voting and the lack of white crossover (Abosch, Barreto, and Woods Reference Abosch, Barreto, Woods and Henderson2007; Crayton Reference Crayton2012; Engstrom Reference Engstrom2015; Grofman, Handley, and Niemi Reference Grofman, Handley and Niemi1992). The level of racially polarized voting and the percentage of minority voters solely determine $ M $
when there is only one minority and white candidates, respectively (Grofman, Handley, and Lublin Reference Grofman, Handley and Lublin2001, 1407–09).
$ M $
when there is only one minority and white candidates, respectively (Grofman, Handley, and Lublin Reference Grofman, Handley and Lublin2001, 1407–09).
Strategic coordination within minority and white candidates also affects both $ {V}_{t-1}^M $
and
$ {V}_{t-1}^M $
and $ {V}_{t-1}^W $
. Recall that the racial margin of victory is not about how many votes minority candidates collectively received, but about how many votes the minority candidate with the highest chance of winning received compared with the most viable white candidate. It suggests that
$ {V}_{t-1}^W $
. Recall that the racial margin of victory is not about how many votes minority candidates collectively received, but about how many votes the minority candidate with the highest chance of winning received compared with the most viable white candidate. It suggests that $ M $
reflects how well both minority and white candidates coordinated within each group so that there would be less vote splitting (Cox Reference Cox1997). Thus, minority representation is often a collective action problem (Schousen, Canon, and Sellers Reference Schousen, Canon, Sellers and Grofman1998). Indeed, when multiple minority candidates emerge under a divided minority leadership, it could easily make a less-preferred white candidate the plurality winner even in majority-minority districts (Vanderleeuw, Liu, and Marsh Reference Vanderleeuw, Liu and Marsh2004).
$ M $
reflects how well both minority and white candidates coordinated within each group so that there would be less vote splitting (Cox Reference Cox1997). Thus, minority representation is often a collective action problem (Schousen, Canon, and Sellers Reference Schousen, Canon, Sellers and Grofman1998). Indeed, when multiple minority candidates emerge under a divided minority leadership, it could easily make a less-preferred white candidate the plurality winner even in majority-minority districts (Vanderleeuw, Liu, and Marsh Reference Vanderleeuw, Liu and Marsh2004).
By now, readers may wonder how other factors that may relate to minority representation fit into the logical model. These factors are considered as elements of T in Figure 1. For example, research shows that the relative size of coethnic voters (and the sense of “electoral influence” from it) would affect the turnout gap by race (Fraga Reference Fraga2018). Scholars have also argued that strategic coordination among minority candidates may become more difficult in majority-minority districts (Schousen, Canon, and Sellers Reference Schousen, Canon, Sellers and Grofman1998). Also, research finds that heavily democratic districts often yield a high level of white crossover voting, which in turn increases $ {V}_{t-1}^M $
(and decreases
$ {V}_{t-1}^M $
(and decreases $ {V}_{t-1}^W $
), resulting in a larger value of
$ {V}_{t-1}^W $
), resulting in a larger value of $ M $
(Juenke and Shah Reference Juenke and Shah2016; Lublin et al. Reference Lublin, Handley, Brunell and Grofman2019). Moreover, incumbency may affect minority and white vote choices (Liu Reference Liu2001a; Voss and Lublin Reference Voss and Lublin2001), while term limits may attenuate such incumbency advantage (Casellas Reference Casellas2011).
$ M $
(Juenke and Shah Reference Juenke and Shah2016; Lublin et al. Reference Lublin, Handley, Brunell and Grofman2019). Moreover, incumbency may affect minority and white vote choices (Liu Reference Liu2001a; Voss and Lublin Reference Voss and Lublin2001), while term limits may attenuate such incumbency advantage (Casellas Reference Casellas2011).
Meanwhile, the “racial threat” (or “social contact”) hypothesis contends that the geographical concentration of racial minorities decreases (or increases) white crossover (Avery and Fine Reference Avery and Fine2012; Key Reference Key1949; Liu Reference Liu2001a; Reference Liu2001b; Oliver and Wong Reference Oliver and Wong2003), while other research shows that such an influence may be contingent upon urbanization and residential segregation (Rocha and Espino Reference Rocha and Espino2009; Voss and Miller Reference Voss and Miller2001;Weaver and Bagchi-Sen Reference Weaver and Bagchi-Sen2015). Alternatively, Liu and Vanderleeuw (Reference Liu and Vanderleeuw2007) theorize that the highest level of racially polarized voting occurs when minority and white voters have an equal share of the electorate. In addition to (or instead of) contemporary factors, the history of slavery-based local economy may also make white crossover less likely (Acharya, Blackwell, and Sen Reference Acharya, Blackwell and Sen2020). Finally, many election and candidate-specific factors could influence turnout rates and voting behaviors of minority and white voters, such as candidates’ names (Casellas Reference Casellas2011, 91–93), scandals (Parent and Perry Reference Parent, Perry, Bullock and Rozell2017), deracialized campaigns (Vanderleeuw, Liu, and Marsh Reference Vanderleeuw, Liu and Marsh2004), and natural disasters (Liu and Vanderleeuw Reference Liu and Vanderleeuw2007). All of these factors are inside T and thus incorporated in the logical model.
The logical model contends that by only looking at $ M $
, minority candidates can learn about their likely electoral results because it summarizes a set of factors that directly or indirectly determine the relative performance of minority candidates. I define
$ M $
, minority candidates can learn about their likely electoral results because it summarizes a set of factors that directly or indirectly determine the relative performance of minority candidates. I define $ M $
as a logical benchmark for the upcoming election because there is likely a temporal dependency between voting behavior in two consecutive elections. That is, I assume that a set of factors that determined the racial margin of victory at time
$ M $
as a logical benchmark for the upcoming election because there is likely a temporal dependency between voting behavior in two consecutive elections. That is, I assume that a set of factors that determined the racial margin of victory at time $ t-1 $
(“last time”) is likely to produce similar results at time
$ t-1 $
(“last time”) is likely to produce similar results at time $ t $
(“this time”) since these factors are not likely to change in a short period and may even persist for a long time (Acharya, Blackwell, and Sen Reference Acharya, Blackwell and Sen2020). This idea is also consistent with previous studies, including Marschall, Ruhil, and Shah (Reference Marschall, Ruhil and Shah2010, 114–15) and Shah (Reference Shah2014, 269, 271), that argue that prior minority candidacy and electoral performance may affect future minority representation.
$ t $
(“this time”) since these factors are not likely to change in a short period and may even persist for a long time (Acharya, Blackwell, and Sen Reference Acharya, Blackwell and Sen2020). This idea is also consistent with previous studies, including Marschall, Ruhil, and Shah (Reference Marschall, Ruhil and Shah2010, 114–15) and Shah (Reference Shah2014, 269, 271), that argue that prior minority candidacy and electoral performance may affect future minority representation.
$ C $
Reflects Extreme Racial Polarization

Next, $ C $
is the expected racial margin of victory based on district racial composition in the most adverse conditions for minority voters.
$ C $
is the expected racial margin of victory based on district racial composition in the most adverse conditions for minority voters. $ C $
is computed based on three assumptions: (1) there is only a single viable minority and white candidates, respectively (no vote splitting within each group), (2) minority and white voters turn out at the same level (no turnout gap), and (3) there exist perfect minority bloc voting and no white crossover (extreme racially polarized voting). Namely,
$ C $
is computed based on three assumptions: (1) there is only a single viable minority and white candidates, respectively (no vote splitting within each group), (2) minority and white voters turn out at the same level (no turnout gap), and (3) there exist perfect minority bloc voting and no white crossover (extreme racially polarized voting). Namely, $ C $
is the racial margin of victory that one could observe when minority and white voters fully concentrate their ballots on their coethnic candidates.Footnote
14 These assumptions are closely related to the well-established concept of the threshold of exclusion (Rae, Hanby, and Loosemore Reference Rae, Hanby and Loosemore1971), which represents the minimum vote shares that a minority group (or party) needs to earn in order to win at least one seat under given electoral systems (e.g., FPTP, cumulative voting, or limited voting) when all other voters attempt to most effectively exclude minority representation (Brischetto and Engstrom Reference Brischetto and Engstrom1997; Engstrom Reference Engstrom2010).
$ C $
is the racial margin of victory that one could observe when minority and white voters fully concentrate their ballots on their coethnic candidates.Footnote
14 These assumptions are closely related to the well-established concept of the threshold of exclusion (Rae, Hanby, and Loosemore Reference Rae, Hanby and Loosemore1971), which represents the minimum vote shares that a minority group (or party) needs to earn in order to win at least one seat under given electoral systems (e.g., FPTP, cumulative voting, or limited voting) when all other voters attempt to most effectively exclude minority representation (Brischetto and Engstrom Reference Brischetto and Engstrom1997; Engstrom Reference Engstrom2010).
Not only do they provide a reasonable theoretical benchmark, these conditions are also consistent with the general patterns in American politics. Previous research has found a high degree of minority bloc voting and a low level, if not the absence, of white crossover in many places, including Louisiana (Engstrom et al. Reference Engstrom, Halpin, Hill, Caridas-Butterworth, Davidson and Grofman1994), Kentucky (Voss and Miller Reference Voss and Miller2001), Georgia (Voss and Lublin Reference Voss and Lublin2001), Alabama (Webster and Quinton Reference Webster and Quinton2010), Mississippi (Weaver and Bagchi-Sen Reference Weaver and Bagchi-Sen2015), New York City (Kaufmann Reference Kaufmann2004), Los Angeles (Abosch, Barreto, and Woods Reference Abosch, Barreto, Woods and Henderson2007), Atlanta (Bullock and Campbell Reference Bullock and Campbell1984), New Orleans (Liu Reference Liu2001a; Reference Liu2001b), Memphis (Vanderleeuw, Liu, and Marsh Reference Vanderleeuw, Liu and Marsh2004), and across states and regions (Ansolabehere, Persily, and Stewart Reference Ansolabehere, Persily and Stewart2012).
Given these theoretical and empirical nature of minority bloc and white crossover voting, I define $ C $
as a meaningful logical bound for the likely electoral performance of minority candidates. Remarkably,
$ C $
as a meaningful logical bound for the likely electoral performance of minority candidates. Remarkably, $ C $
turns out to be algebraically equivalent to the percentage of minority voters in the electorate:
$ C $
turns out to be algebraically equivalent to the percentage of minority voters in the electorate: $ C\hskip1.5pt \in \hskip1.5pt \left(\mathrm{0,100}\right) $
.Footnote
15 This algebraic equivalence is rather powerful because the percentage of minority voters is what line-drawers change in redistricting and is recognized as the most important determinant of minority representation (Grofman, Handley, and Niemi Reference Grofman, Handley and Niemi1992; Handley, Grofman, and Arden Reference Handley, Grofman, Arden and Grofman1998; Lublin et al. Reference Lublin, Handley, Brunell and Grofman2019).Footnote
16
$ C\hskip1.5pt \in \hskip1.5pt \left(\mathrm{0,100}\right) $
.Footnote
15 This algebraic equivalence is rather powerful because the percentage of minority voters is what line-drawers change in redistricting and is recognized as the most important determinant of minority representation (Grofman, Handley, and Niemi Reference Grofman, Handley and Niemi1992; Handley, Grofman, and Arden Reference Handley, Grofman, Arden and Grofman1998; Lublin et al. Reference Lublin, Handley, Brunell and Grofman2019).Footnote
16
Illustration of Model Predictions
To illustrate the quantitative predictions of the logical model, I first provide a simple example. Suppose that the top minority and white candidates obtained 30% and 50% of vote shares in the most recent election, respectively.Footnote
17 Suppose also that 60% of the district are minority voters. In this example, $ M=\frac{1}{2}\left(30-50\right)+50=40 $
and
$ M=\frac{1}{2}\left(30-50\right)+50=40 $
and $ C=60 $
. The model suggests that the probability of minority candidate emergence in this district becomes:
$ C=60 $
. The model suggests that the probability of minority candidate emergence in this district becomes: $ \Phi \left({\left(40\times 60\right)}^{1/2}-50\right)=\Phi \left(48.99-50\right)=\Phi \left(-1.01\right)=0.156 $
.
$ \Phi \left({\left(40\times 60\right)}^{1/2}-50\right)=\Phi \left(48.99-50\right)=\Phi \left(-1.01\right)=0.156 $
.
Next, I visualize the quantitative predictions of the model under varying conditions. Panel A of Figure 2 plots the probability of minority candidate emergence against $ {(MC)}^{1/2}-50 $
. It shows that the probability is lower than 0.5 when the entire term is negative, whereas it becomes higher than 0.5 when the value is positive. Again, this formalizes the theoretical story that minority candidates run for office when they see a high probability of winning.
$ {(MC)}^{1/2}-50 $
. It shows that the probability is lower than 0.5 when the entire term is negative, whereas it becomes higher than 0.5 when the value is positive. Again, this formalizes the theoretical story that minority candidates run for office when they see a high probability of winning.
Quantitative Predictions of the Logical Model
Note: This figure visualizes the probability of minority candidate emergence against $ {(MC)}^{1/2}-50 $
(the estimated future racial margin of victory) (Panel A) and
$ {(MC)}^{1/2}-50 $
(the estimated future racial margin of victory) (Panel A) and $ M $
with varying values of
$ M $
with varying values of $ C $
(% minority voters) (Panel B).
$ C $
(% minority voters) (Panel B).
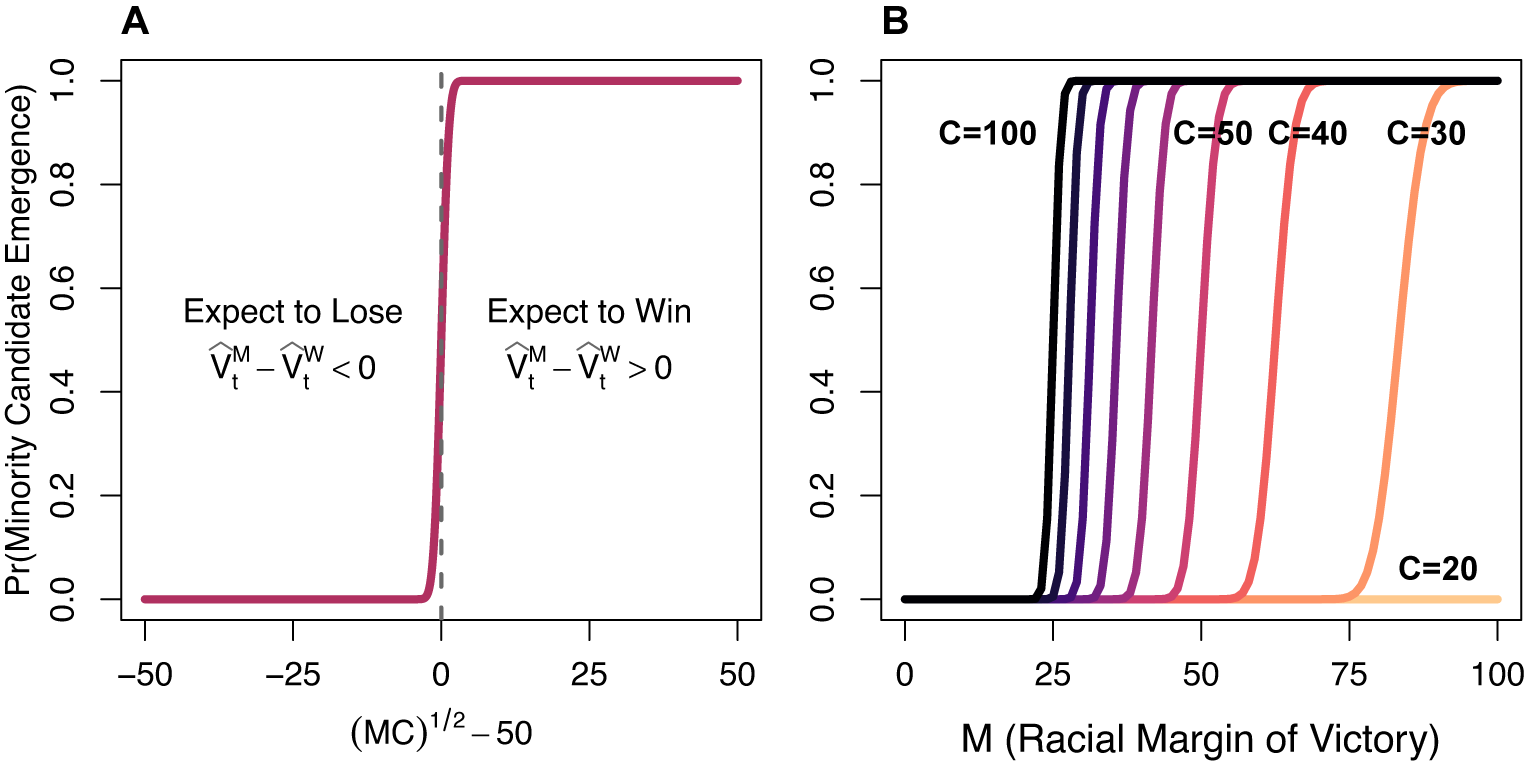
Panel B plots the probability of minority candidate emergence against $ M $
with varying values of
$ M $
with varying values of $ C $
. While researchers have long debated whether minority candidates can run and win in majority-white districts (Hicks et al. Reference Hicks, Klarner, McKee and Smith2018; Lublin et al. Reference Lublin, Handley, Brunell and Grofman2019), the logical model suggests that it depends on the value of
$ C $
. While researchers have long debated whether minority candidates can run and win in majority-white districts (Hicks et al. Reference Hicks, Klarner, McKee and Smith2018; Lublin et al. Reference Lublin, Handley, Brunell and Grofman2019), the logical model suggests that it depends on the value of $ M $
. For example, when
$ M $
. For example, when $ C=30 $
, the probability of minority candidate emergence is mostly 0, but it starts to increase after
$ C=30 $
, the probability of minority candidate emergence is mostly 0, but it starts to increase after $ M $
is beyond 75. It means that, in 30% minority districts, minority candidates do not usually emerge, but they could run if their coethnic candidates won with large margins or “did extremely well” relative to their white counterparts in the most recent election. Similarly, the logical model suggests that having majority-minority districts does not automatically guarantee the emergence and electoral success of minority candidates. When
$ M $
is beyond 75. It means that, in 30% minority districts, minority candidates do not usually emerge, but they could run if their coethnic candidates won with large margins or “did extremely well” relative to their white counterparts in the most recent election. Similarly, the logical model suggests that having majority-minority districts does not automatically guarantee the emergence and electoral success of minority candidates. When $ C=60 $
, for instance, the probability of minority candidate emergence is generally high, but it gets increasingly low after
$ C=60 $
, for instance, the probability of minority candidate emergence is generally high, but it gets increasingly low after $ M $
is less than 40. It suggests that, in 60% minority districts, minority candidates usually appear, but they may not run if their coethnic candidates lost with great margins or “did extremely poorly” relative to their white counterparts in the most recent election.Footnote
18 Indeed, this result reconciles influential and competing theories on the necessity of majority-minority districts in electing minority candidates (Cameron, Epstein, and O’Halloran Reference Cameron, Epstein and O’Halloran1996; Grofman, Handley, and Lublin Reference Grofman, Handley and Lublin2001; Lublin Reference Lublin1997; Reference Lublin1999; Lublin et al. Reference Lublin, Handley, Brunell and Grofman2019).
$ M $
is less than 40. It suggests that, in 60% minority districts, minority candidates usually appear, but they may not run if their coethnic candidates lost with great margins or “did extremely poorly” relative to their white counterparts in the most recent election.Footnote
18 Indeed, this result reconciles influential and competing theories on the necessity of majority-minority districts in electing minority candidates (Cameron, Epstein, and O’Halloran Reference Cameron, Epstein and O’Halloran1996; Grofman, Handley, and Lublin Reference Grofman, Handley and Lublin2001; Lublin Reference Lublin1997; Reference Lublin1999; Lublin et al. Reference Lublin, Handley, Brunell and Grofman2019).
Assessing Model Predictions
This section assesses the model predictions by leveraging two unique datasets. It demonstrates that the logical model can predict about 90% of minority candidate emergence and 95% of minority electoral success in various electoral contexts.
Data
To test how well the model can predict minority candidate emergence in the real world, I leverage data on mayoral elections in 313 Louisiana municipalities from 1986 to 2016 (N = 2,037).Footnote 19 Louisiana mayoral elections offer a desirable context to evaluate the model predictions for multiple reasons. First, more than 96% of registered voters in Louisiana are either African American or white, yielding ideal conditions (biracial elections) to assess the model predictions (Appendix B.2). Second, the cultural, religious, and political differences between northern and southern Louisiana whites yield a rich variation in the degree of white crossover voting (Parent Reference Parent2006, 20). Third, Louisiana adopts a unique electoral system where all candidates participate in a single election regardless of party affiliation (Parent and Perry Reference Parent, Perry, Bullock and Rozell2017), which allows me to assess the model predictions without having to account for multiple stages of partisan primaries and general elections (Grofman, Handley, and Lublin Reference Grofman, Handley and Lublin2001, 1409–11).Footnote 20 Finally, Louisiana is one of the states with extensive studies on and court rulings about redistricting and voting rights (Adegible Reference Adegible2007; Engstrom and Kirksey Reference Engstrom, Kirksey and Grofman1998; Engstrom et al. Reference Engstrom, Halpin, Hill, Caridas-Butterworth, Davidson and Grofman1994), which is a kind of environment where the model can be most relevant.
Model Prediction and its Novelty
To assess the model predictions, I first compare them with the actual minority candidate emergence in the data. Figure 3 visualizes the model predictions along with the observed data in a contour plot, where the $ x $
-axis is
$ x $
-axis is $ M $
and the
$ M $
and the $ y $
-axis is
$ y $
-axis is $ C $
measured by the percentage of African Americans in each municipality. The gradation of color represents the predicted probability of Black candidate emergence based on the logical model. The figure visually confirms that the logical model predicts observed Black candidate emergence quite accurately in Louisiana municipalities, including New Orleans (Liu Reference Liu2001a; Reference Liu2001b; Liu and Vanderleeuw Reference Liu and Vanderleeuw2007). Namely, most elections with Black candidates (
$ C $
measured by the percentage of African Americans in each municipality. The gradation of color represents the predicted probability of Black candidate emergence based on the logical model. The figure visually confirms that the logical model predicts observed Black candidate emergence quite accurately in Louisiana municipalities, including New Orleans (Liu Reference Liu2001a; Reference Liu2001b; Liu and Vanderleeuw Reference Liu and Vanderleeuw2007). Namely, most elections with Black candidates ( $ \circ $
) are located in the upper-right region (where
$ \circ $
) are located in the upper-right region (where $ {P}_{\mathrm{run}}>0.9 $
) and most elections without Black candidate (
$ {P}_{\mathrm{run}}>0.9 $
) and most elections without Black candidate ( $ \times $
) appear in the lower-left area (where
$ \times $
) appear in the lower-left area (where $ {P}_{\mathrm{run}}<0.1 $
).Footnote
21
$ {P}_{\mathrm{run}}<0.1 $
).Footnote
21
Model Predictions with Observed Minority Candidate Emergence
Note: This figure shows the observed minority candidate emergence in Louisiana mayoral elections over the model predictions. It illustrates that most elections with Black candidates ( $ \circ $
) are located in the upper-right region (where
$ \circ $
) are located in the upper-right region (where $ {P}_{\mathrm{run}}>0.9 $
) and most elections without Black candidates (
$ {P}_{\mathrm{run}}>0.9 $
) and most elections without Black candidates ( $ \times $
) appear in the lower-left area (where
$ \times $
) appear in the lower-left area (where $ {P}_{\mathrm{run}}<0.1 $
).
$ {P}_{\mathrm{run}}<0.1 $
).
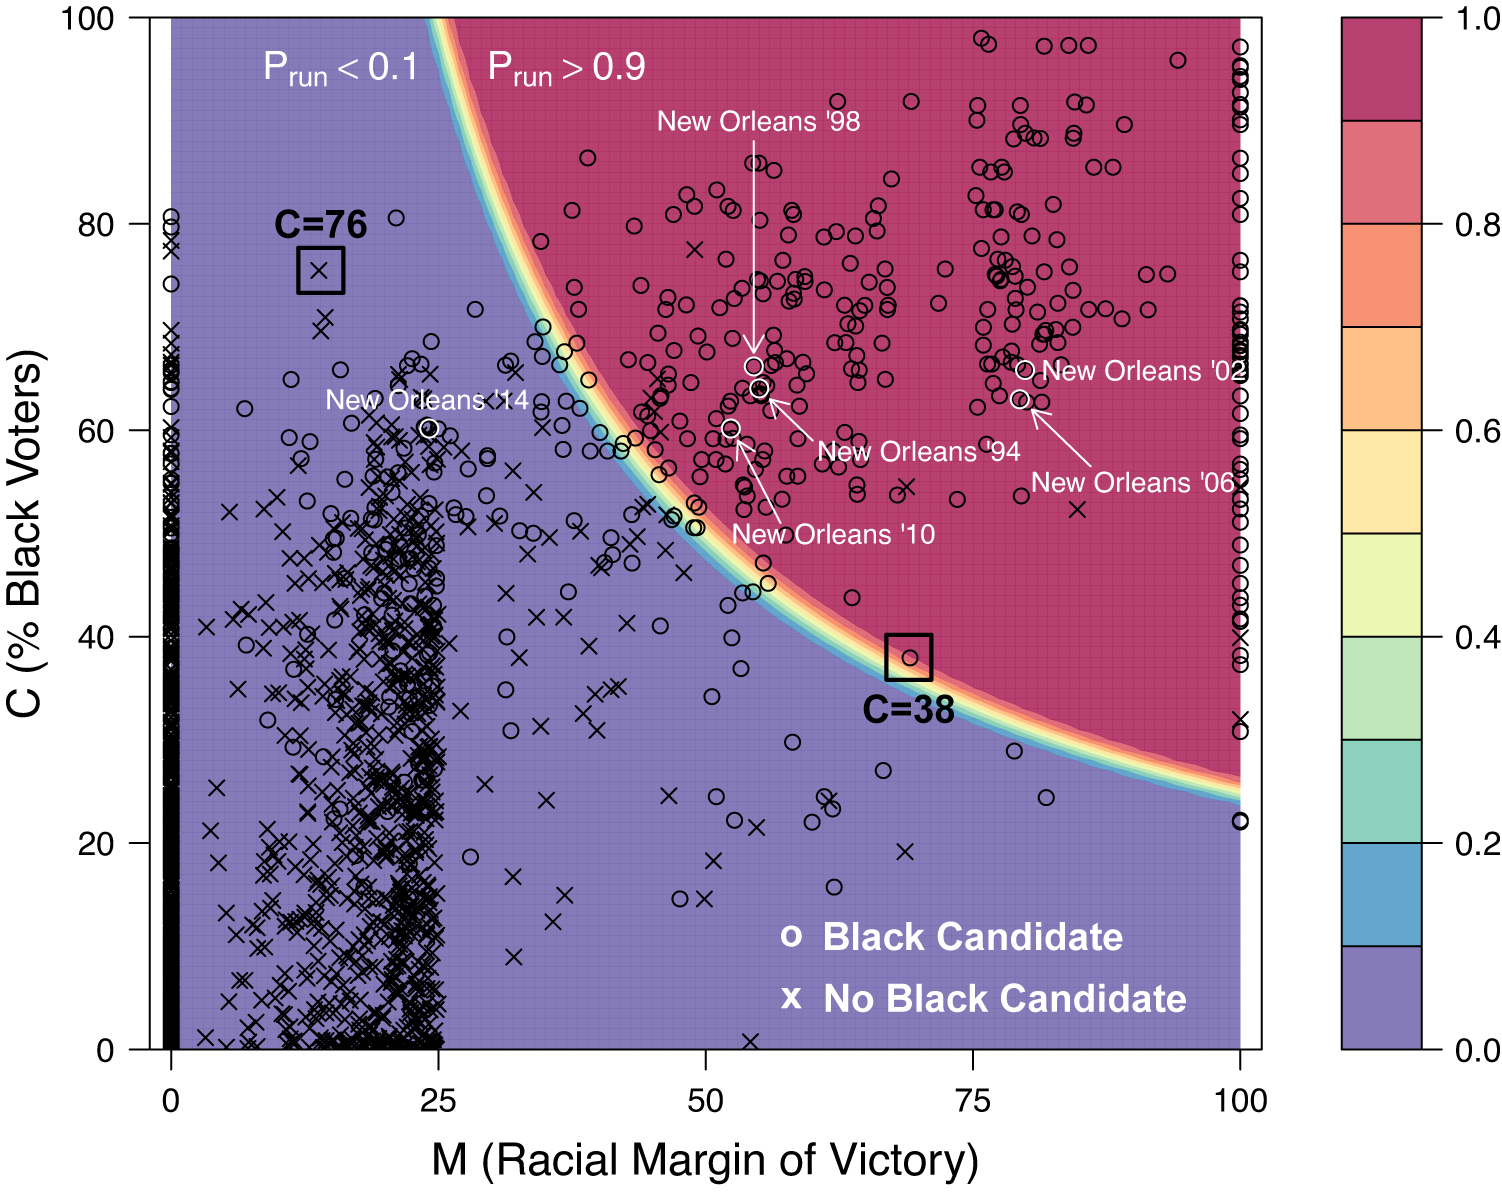
To highlight the novelty of the model, I also mark two observations (with squares) as examples of cases that previous research cannot fully explain, but the logical model can. The left case indicates the absence of minority candidate in a heavily majority-minority district ( $ C=76 $
), and the right case shows the presence of minority candidate in a majority-white district (
$ C=76 $
), and the right case shows the presence of minority candidate in a majority-white district ( $ C=38 $
). Both elections are generally puzzling to prior studies that have argued that minority candidate emergence is the norm in majority-minority districts and highly unlikely in less than 40% minority districts. In contrast, the logical model indicates that both of these cases “make sense” (with predicted probabilities being 0.00 and 0.89, respectively). Indeed, the model predicts the absence of minority candidates even in majority-minority districts when their coethnic candidates performed poorly in the most recent elections (relative to their white counterparts). Conversely, it predicts the emergence of minority candidates even in majority-white districts when their coethnic candidates won the last elections with a large racial margin of victory. Consequently, the logical model offers a novel insight that the district’s racial composition is only half the story of minority candidate emergence.
$ C=38 $
). Both elections are generally puzzling to prior studies that have argued that minority candidate emergence is the norm in majority-minority districts and highly unlikely in less than 40% minority districts. In contrast, the logical model indicates that both of these cases “make sense” (with predicted probabilities being 0.00 and 0.89, respectively). Indeed, the model predicts the absence of minority candidates even in majority-minority districts when their coethnic candidates performed poorly in the most recent elections (relative to their white counterparts). Conversely, it predicts the emergence of minority candidates even in majority-white districts when their coethnic candidates won the last elections with a large racial margin of victory. Consequently, the logical model offers a novel insight that the district’s racial composition is only half the story of minority candidate emergence.
Predictive Performance
Next, I compute the accuracy of the model predictions based on the expected percentage correctly predicted (ePCP). The ePCP provides the percentage of observations for which the model can correctly predict their values (i.e., 0 or 1) while accounting for how close such predictions are (e.g., 0.51 vs. 0.99) (Herron Reference Herron1999, 91–92). The ePCP is an ideal measure of prediction accuracy in this context because “closeness to the predicted value is what matters” for logical models (Taagepera Reference Taagepera2007, 118).
Column 1 of Table 1 shows that the logical model can correctly predict, on average, about 89% of cases. It also reports that the model accurately predicts minority candidate emergence in various contexts defined by $ C $
, types of cities, features of elections, electoral systems for city-councils, and years (before vs. after the Republican Revolution in 1994).
$ C $
, types of cities, features of elections, electoral systems for city-councils, and years (before vs. after the Republican Revolution in 1994).
Predictive Performance of the Logical Model Relative to Regressions

Note: This table reports the predictive performance of the logical model and linear and logistic regressions in ePCP = $ {N}^{-1}\left({\Sigma}_{y_i=1}{\hat{p}}_i+{\Sigma}_{y_i=0}\left(1-{\hat{p}}_i\right)\right), $
in % where
$ {N}^{-1}\left({\Sigma}_{y_i=1}{\hat{p}}_i+{\Sigma}_{y_i=0}\left(1-{\hat{p}}_i\right)\right), $
in % where $ N $
is the number of units and
$ N $
is the number of units and $ {y}_i $
and
$ {y}_i $
and $ {\hat{p}}_i $
are true and predicted values for unit
$ {\hat{p}}_i $
are true and predicted values for unit $ i $
, respectively.
$ i $
, respectively.
Readers may wonder how much the logical model improves upon conventional methods in predicting minority candidate emergence. To investigate, I estimate a set of linear probability models (LPM) and logistic regressions with the observed values of $ M $
,
$ M $
, $ C $
, and minority candidate emergence to generate in-sample ePCPs.Footnote
22 Columns 2–3 show that the logical model has a higher predictive performance than these ad hoc regressions in all subsets of data. This is a remarkable result because these regressions are estimated or trained using actual data while the logical model is not. Moreover, I run both regressions with 34 additional variables that previous research tends to include, finding that the logical model performs as good as and even better than such heavily parameterized regressions (Appendix B.3). Finally, I also conduct extensive analyses to ensure the internal validity of the logical model (Appendix B.4).
$ C $
, and minority candidate emergence to generate in-sample ePCPs.Footnote
22 Columns 2–3 show that the logical model has a higher predictive performance than these ad hoc regressions in all subsets of data. This is a remarkable result because these regressions are estimated or trained using actual data while the logical model is not. Moreover, I run both regressions with 34 additional variables that previous research tends to include, finding that the logical model performs as good as and even better than such heavily parameterized regressions (Appendix B.3). Finally, I also conduct extensive analyses to ensure the internal validity of the logical model (Appendix B.4).
Now, one major payoff is that the logical model of minority candidate emergence is also a model of minority electoral success (i.e., $ {P}_{\mathrm{run}}={\hat{P}}_{\mathrm{win}} $
). If the theory behind the model is plausible, the model should also predict the presence of minority winners. Column 4 shows that this is exactly the case. The logical model predicts, on average, about 94% of minority electoral success with consistently high predictive performance in all subsets of data. Columns 5–6 suggest that the logical model, again, performs much better than the two regressions in predicting minority winners. Also, the logical model predicts minority electoral success better than it predicts minority candidate emergence. One explanation for this result is that minority candidates may sometimes emerge in districts with a low chance of winning potentially for noninstrumental reasons or long-term benefits (Hardy-Fanta, Pinderhughes, and Sierra Reference Hardy-Fanta, Pinderhughes and Sierra2016, 161–207). Consistent with this idea, I also find that minority candidates are more likely to emerge in districts with low odds of winning than to retreat from elections with high probabilities of winning (Appendix B.5).
$ {P}_{\mathrm{run}}={\hat{P}}_{\mathrm{win}} $
). If the theory behind the model is plausible, the model should also predict the presence of minority winners. Column 4 shows that this is exactly the case. The logical model predicts, on average, about 94% of minority electoral success with consistently high predictive performance in all subsets of data. Columns 5–6 suggest that the logical model, again, performs much better than the two regressions in predicting minority winners. Also, the logical model predicts minority electoral success better than it predicts minority candidate emergence. One explanation for this result is that minority candidates may sometimes emerge in districts with a low chance of winning potentially for noninstrumental reasons or long-term benefits (Hardy-Fanta, Pinderhughes, and Sierra Reference Hardy-Fanta, Pinderhughes and Sierra2016, 161–207). Consistent with this idea, I also find that minority candidates are more likely to emerge in districts with low odds of winning than to retreat from elections with high probabilities of winning (Appendix B.5).
External Validity
Readers may wonder how generalizable the above findings are to the broader context of American politics. Indeed, Louisiana is a unique state in many aspects: it has a large African American population (about one third of the state population) (Parent Reference Parent2006), is a Deep South state (Hicks et al. Reference Hicks, Klarner, McKee and Smith2018), is formally covered by Section 5 of the VRA (Engstrom et al. Reference Engstrom, Halpin, Hill, Caridas-Butterworth, Davidson and Grofman1994; Shah, Marschall, and Ruhil Reference Shah, Marschall and Anirudh2013), and has “rarely acutely partisan” elections (Engstrom and Kirksey Reference Engstrom, Kirksey and Grofman1998, 244) that gradually became “deep red, yet unpredictable” (Parent and Perry Reference Parent, Perry, Bullock and Rozell2017).
To address this concern, I construct a novel dataset of state legislative general elections in 2012 and 2014. Specifically, I collect data on the vote shares of the top minority and white candidates and the presence of minority winners for 1,281 general elections from 36 states, including Black-white (N = 642), Latino-white (N = 517), and Asian-white (N = 122) biracial elections in single-member districts. I supplement this data with information on minority candidate emergence and CVAP by race compiled by Fraga, Juenke, and Shah (Reference Fraga, Juenke and Shah2020).Footnote 23
Figure 4 provides visual confirmation that the logical model accurately predicts minority electoral success. Here, capitalized state names (e.g., TX) denote districts with minority winners, whereas lower-case state names (e.g., tx) represent elections without minority winner. The graph shows that most elections with minority winners concentrate in the upper-right area (where $ {\hat{P}}_{\mathrm{win}}>0.9 $
) while most elections without minority representative appear in the lower-left region (where
$ {\hat{P}}_{\mathrm{win}}>0.9 $
) while most elections without minority representative appear in the lower-left region (where $ {\hat{P}}_{\mathrm{win}}<0.1 $
).
$ {\hat{P}}_{\mathrm{win}}<0.1 $
).
Model Predictions with Observed Minority Electoral Success
Note: This figure shows the observed minority electoral success in state legislative general elections in 36 states over the model predictions. It illustrates that most elections with minority winners are located in the upper-right region (where $ {\hat{P}}_{\mathrm{win}}>0.9 $
) and most elections without minority winner appear in the lower-left area (where
$ {\hat{P}}_{\mathrm{win}}>0.9 $
) and most elections without minority winner appear in the lower-left area (where $ {\hat{P}}_{\mathrm{win}}<0.1 $
).
$ {\hat{P}}_{\mathrm{win}}<0.1 $
).
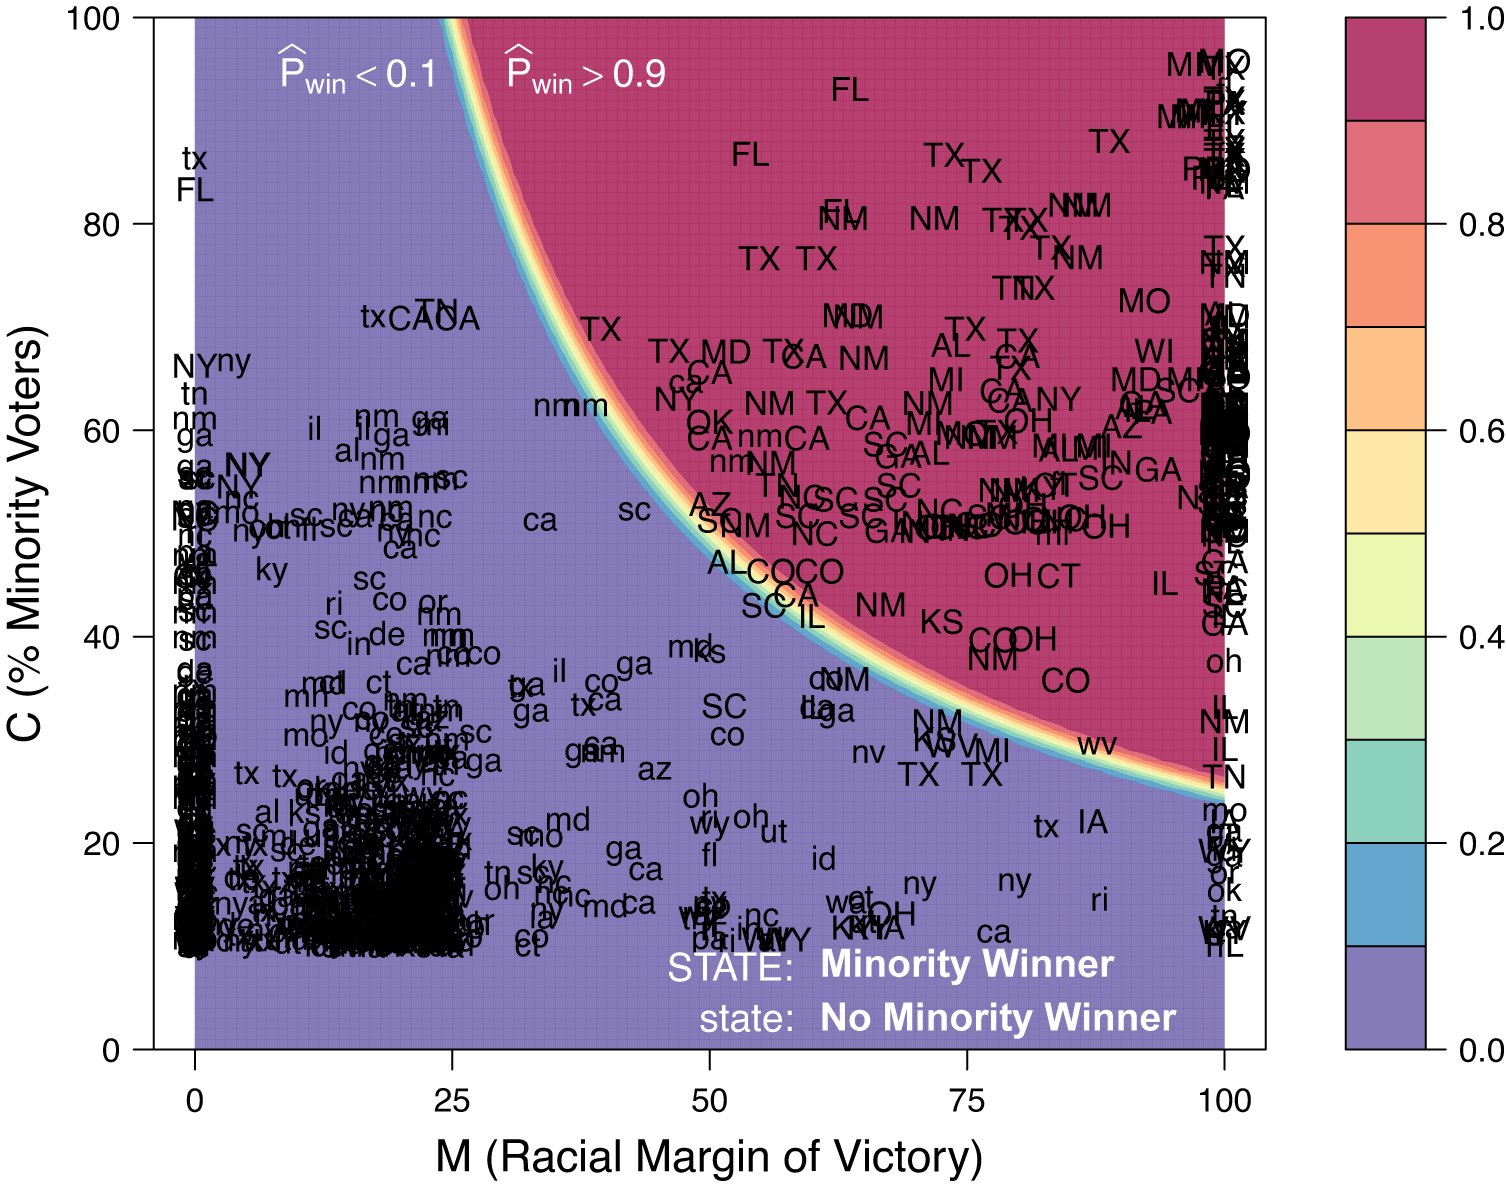
Table 2 reports the predictive performance of the logical model. Columns 1–3 show that the logical model correctly predicts more than 90% of minority (Black, Latino, and Asian) candidate emergence in various electoral contexts. I find that this result holds even after accounting for the degree of biracial elections, levels of $ C $
, types of office, types of elections, regions, and districts’ histories regarding the VRA and redistricting. Columns 4–6 demonstrate that the logical model also predicts more than 95% of minority electoral success regardless of electoral contexts. The results also suggest that the model can predict minority candidates and winners in general elections without accounting for primaries. Finally, Appendix B.6 demonstrates that the model can also predict the number of minority officeholders at the jurisdiction level (e.g., city).
$ C $
, types of office, types of elections, regions, and districts’ histories regarding the VRA and redistricting. Columns 4–6 demonstrate that the logical model also predicts more than 95% of minority electoral success regardless of electoral contexts. The results also suggest that the model can predict minority candidates and winners in general elections without accounting for primaries. Finally, Appendix B.6 demonstrates that the model can also predict the number of minority officeholders at the jurisdiction level (e.g., city).
Predictive Performance of the Logical Model in State Legislative General Elections
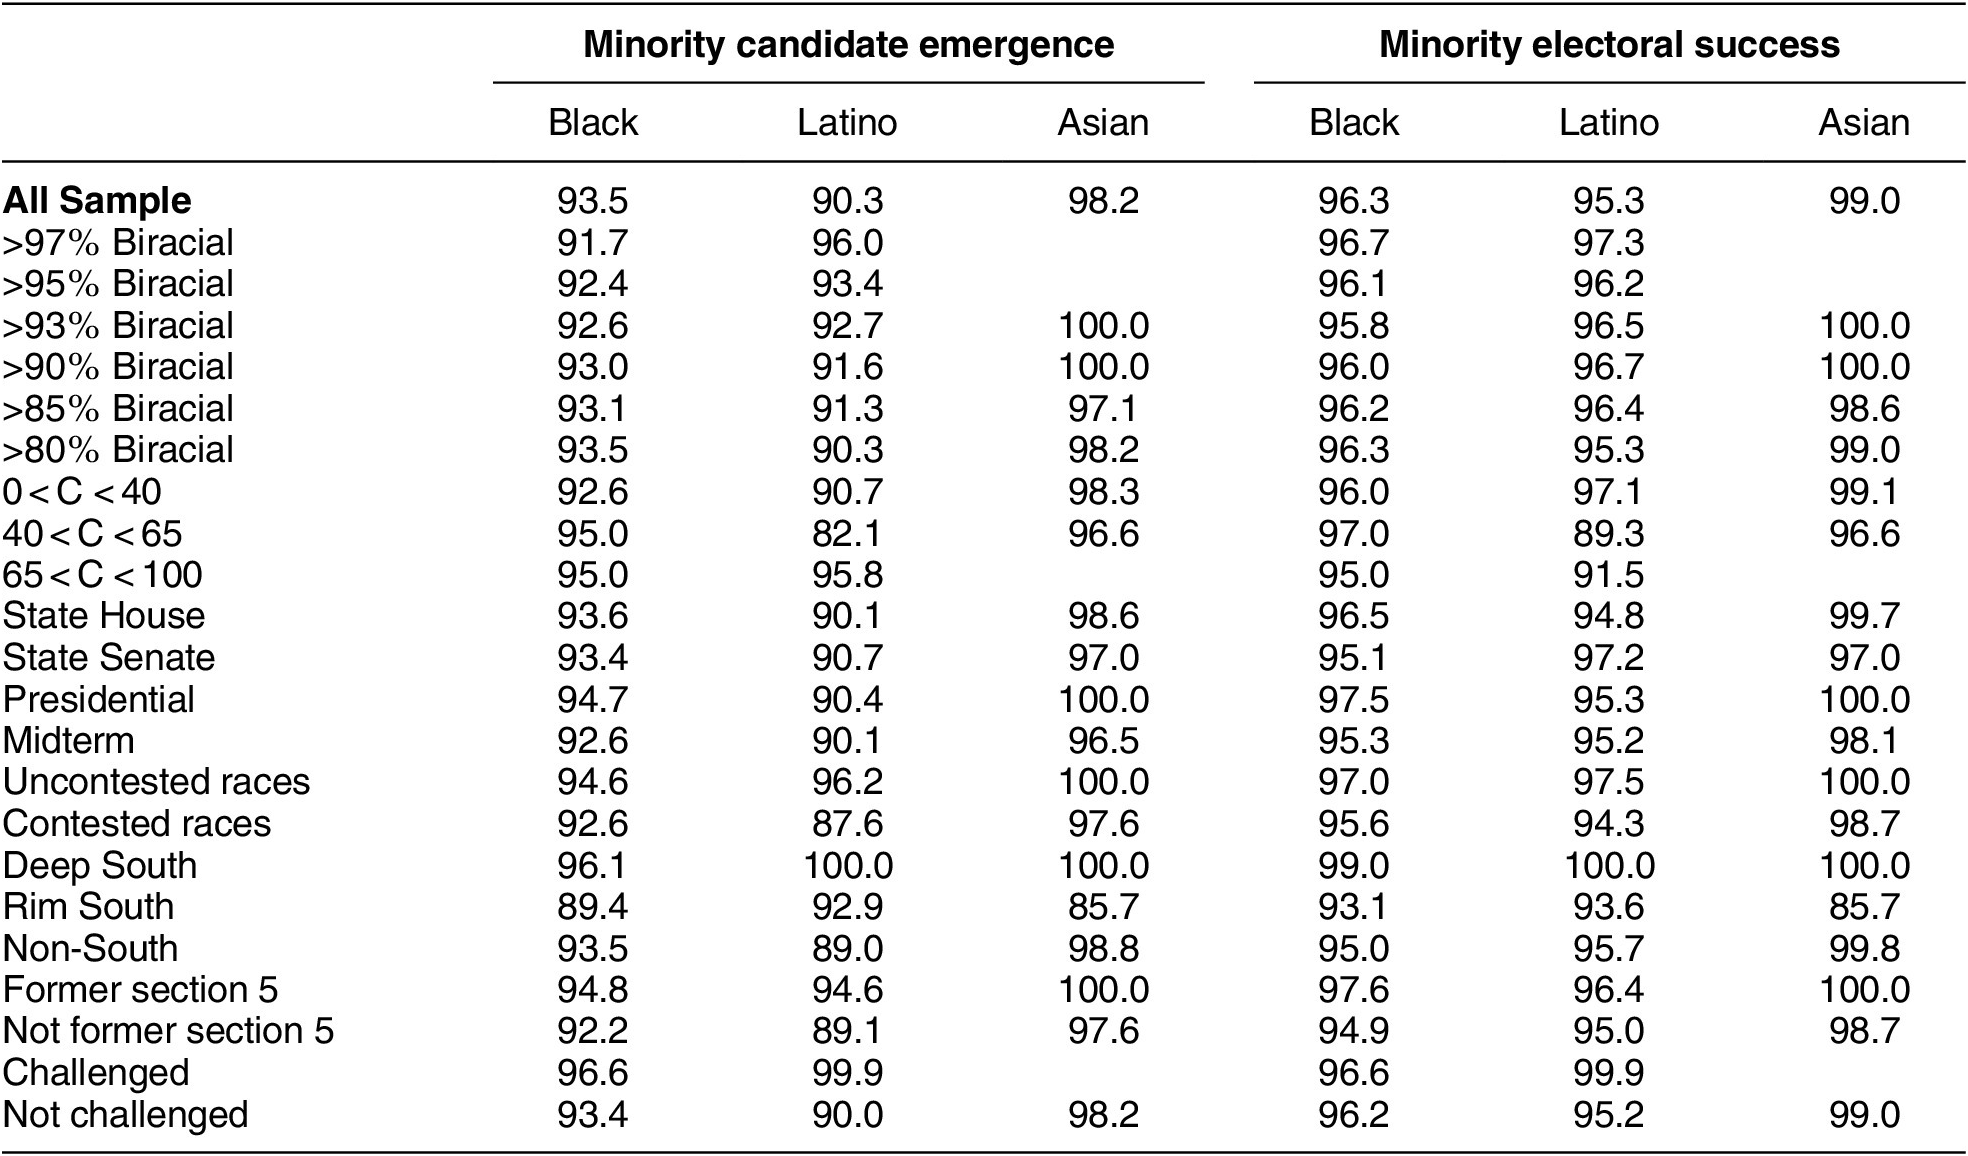
Note: This table reports the predictive performance of the logical model based on ePCP. A district is coded as a former Section 5 district if it is located in one or more counties at the time of the Shelby County v. Holder (2013) decision and coded as challenged if it is mentioned in several major litigation events related to race and voting rights in the 2010 round of redistricting, including Davis v. Perry (2012), Perez v. Perry (2012), Jeffers v. Beebe (2012), Alabama Legislative Black Caucus v. Alabama (2012), Bethune-Hill v. Virginia State Board of Elections (2015), Covington v. North Carolina (2016), and Thomas v. Bryant (2019).
Application to Redistricting and Voting Rights Cases
In redistricting and voting rights cases, researchers and practitioners are interested in how the percentage of minority voters affects the emergence and victory of minority candidates (Handley, Grofman, and Arden Reference Handley, Grofman, Arden and Grofman1998). Do minority voters have a viable chance of electing their candidate of choice in about 35–45% minority districts (Engstrom and Kirksey Reference Engstrom, Kirksey and Grofman1998)? Does changing the percentage of minority voters from A (e.g., less than 50) to B (e.g., over 50) significantly increase the probability that minority candidates win (Hicks et al. Reference Hicks, Klarner, McKee and Smith2018; Lublin Reference Lublin1999; Lublin et al. Reference Lublin, Handley, Brunell and Grofman2019)? What percentage of minority voters is sufficient for a given district to enable minority voters to elect their coethnic candidates (Hicks et al. Reference Hicks, Klarner, McKee and Smith2018, 408)? Where is an electoral “sweet spot”—the point at which the probability of minority electoral success becomes high enough with the minimum percentage of minority voters (Lublin et al. Reference Lublin, Handley, Brunell and Grofman2019)? Does a given district plan have more minority voters than necessary to elect minority candidates, leading to potential vote dilution (Grofman, Handley, and Niemi Reference Grofman, Handley and Niemi1992)? How many minority politicians are likely to win at the jurisdiction level (Grofman, Handley, and Lublin Reference Grofman, Handley and Lublin2001, 1387)?
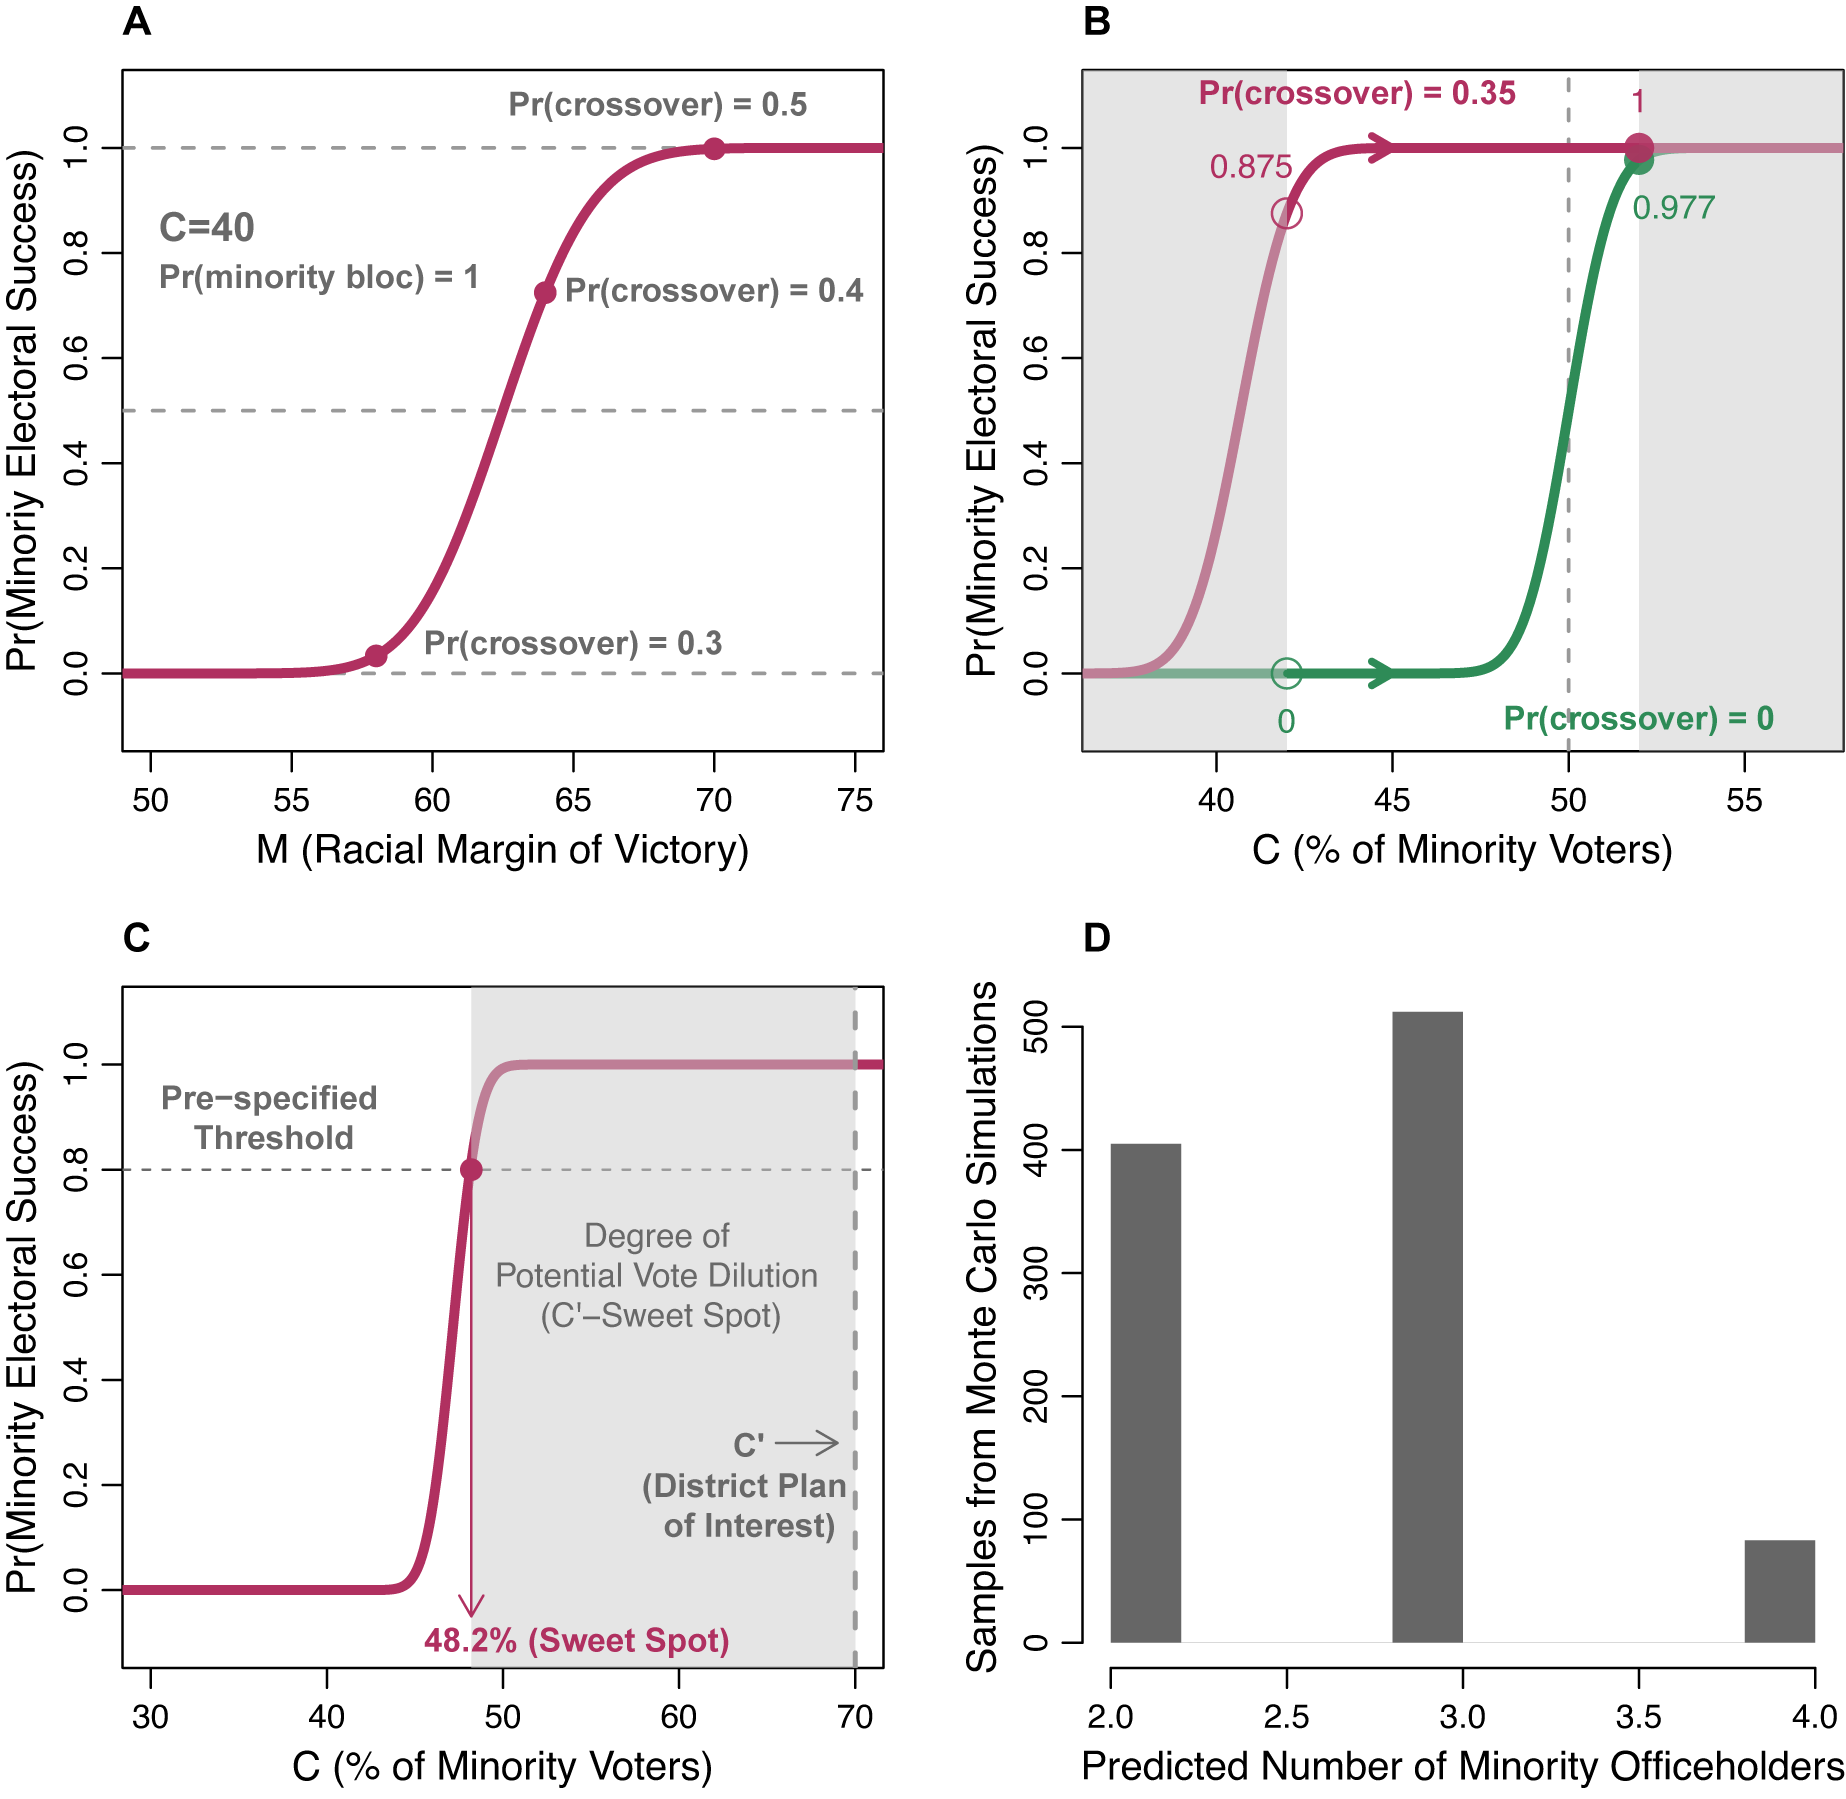
Figure 5 illustrates that the logical model can answer these questions by computing the probability of minority electoral success in given districts with both observed and hypothetical values of $ M $
and
$ M $
and $ C $
. First, the logical model can predict the probability that minority candidates win in districts with specific racial composition. To demonstrate, Panel A shows the probability of minority electoral success in districts with 40% minority voters based on the logical model. It suggests that whether minority candidates win depends highly on the value of
$ C $
. First, the logical model can predict the probability that minority candidates win in districts with specific racial composition. To demonstrate, Panel A shows the probability of minority electoral success in districts with 40% minority voters based on the logical model. It suggests that whether minority candidates win depends highly on the value of $ M $
. When researchers observe
$ M $
. When researchers observe $ M $
, they can then compute the exact probability of interest. When the actual value of
$ M $
, they can then compute the exact probability of interest. When the actual value of $ M $
is not available, they can instead simulate
$ M $
is not available, they can instead simulate $ M $
with their prior knowledge about the level of minority bloc voting and white crossover in each district (see Section A.8). To illustrate, I simulate three Ms by assuming that (I know from a survey, ecological inference estimates, or historical analysis that) the proportion of white voters who crossover is 0.3, 0.4, and 0.5, respectively (while assuming that minority voters vote cohesively). The plotted results suggest that minority candidates have a good chance of winning if they can earn crossover votes from more than 40% of white voters in this hypothetical district.
$ M $
with their prior knowledge about the level of minority bloc voting and white crossover in each district (see Section A.8). To illustrate, I simulate three Ms by assuming that (I know from a survey, ecological inference estimates, or historical analysis that) the proportion of white voters who crossover is 0.3, 0.4, and 0.5, respectively (while assuming that minority voters vote cohesively). The plotted results suggest that minority candidates have a good chance of winning if they can earn crossover votes from more than 40% of white voters in this hypothetical district.
Application of the Logical Model to Redistricting and Voting Rights Cases
Note: This figure illustrates how the logical model can be used to predict the probability of minority electoral success at fixed $ C $
with varying levels of white crossover (Panel A), assess the effect of increasing the percentage of minority voters on minority electoral success (Panel B), discover the sufficient percentages of minority voters to yield a prespecified probability of minority electoral success, the sweet spot of redistricting, and the degree of potential vote dilution via packing (Panel C), and predict the number of minority officeholders in a jurisdiction with multiple districts (Panel D).
$ C $
with varying levels of white crossover (Panel A), assess the effect of increasing the percentage of minority voters on minority electoral success (Panel B), discover the sufficient percentages of minority voters to yield a prespecified probability of minority electoral success, the sweet spot of redistricting, and the degree of potential vote dilution via packing (Panel C), and predict the number of minority officeholders in a jurisdiction with multiple districts (Panel D).
Moreover, the model can also simulate the effect of “redistricting” (i.e., changing $ C $
) on minority descriptive representation. Political scientists and practitioners have been long interested in whether minority voters need to consist of the numerical majority in a district to elect their candidate of choice (Grofman, Handley, and Lublin Reference Grofman, Handley and Lublin2001, 1389). To answer this question, I predict the probability of minority electoral success with varying levels of
$ C $
) on minority descriptive representation. Political scientists and practitioners have been long interested in whether minority voters need to consist of the numerical majority in a district to elect their candidate of choice (Grofman, Handley, and Lublin Reference Grofman, Handley and Lublin2001, 1389). To answer this question, I predict the probability of minority electoral success with varying levels of $ C $
for two hypothetical districts: (1) one with a moderate level of white crossover and (2) another with no white crossover. I also assume that minority voters vote cohesively. Panel B visualizes how much the probability of minority electoral success changes as one increases the percentage of minority voters from 42% to 52% in these districts. The results suggest that while “redistricting” does not have a substantial influence in the first district (i.e., upper curve), which already had a high probability in the first place, it has a dramatic effect on minority representation in the second district (i.e., lower curve).
$ C $
for two hypothetical districts: (1) one with a moderate level of white crossover and (2) another with no white crossover. I also assume that minority voters vote cohesively. Panel B visualizes how much the probability of minority electoral success changes as one increases the percentage of minority voters from 42% to 52% in these districts. The results suggest that while “redistricting” does not have a substantial influence in the first district (i.e., upper curve), which already had a high probability in the first place, it has a dramatic effect on minority representation in the second district (i.e., lower curve).
Additionally, flipping the above question, the logical model can discover the percentage of minority voters that leads to minority electoral success with a specific probability or higher. Such a probability or threshold represents the degree to which minority voters have a viable opportunity to elect a candidate of their choice (Handley, Grofman, and Arden Reference Handley, Grofman, Arden and Grofman1998).Footnote
24 To illustrate, Panel C asks what percentage of minority voters is sufficient to elect a minority politician with the probability of 0.8 or higher (when 90% and 20% of minority and white voters support the minority candidate, respectively). The panel shows that any percentage larger than 48.2% is sufficient to elect minority candidates with the specified probability or higher, while 48.2% is what Lublin et al. (Reference Lublin, Handley, Brunell and Grofman2019) call an electoral sweet spot. Building on this application, the logical model can also quantify the degree of potential vote dilution via “packing,” by which a large number of minority voters are concentrated into a single district beyond the point that they can effectively influence the electoral outcome inside and outside the district (Bullock Reference Bullock2010; Gerken Reference Gerken2001). Panel C shows that one can measure such a degree by subtracting $ C $
at the sweet spot from the percentage of minority voters in a given district plan (e.g.,
$ C $
at the sweet spot from the percentage of minority voters in a given district plan (e.g., $ {C}^{\prime }=70 $
in Panel C).Footnote
25
$ {C}^{\prime }=70 $
in Panel C).Footnote
25
Finally, the model can also predict the number of minority officeholders at the jurisdiction level (e.g., city, county, and state). For example, researchers may wish to know how many minority representatives can be expected in an entire jurisdiction with six districts, where they observe two pieces of information: C = (50, 40, 60, 30, 50, 80) and M = (50, 40, 40, 35, 70, 85). With these values, researchers can then (1) predict the probability of minority electoral success for each district, (2) perform Monte Carlo simulations in which they repeatedly draw samples from a binomial distribution with a vector of the model predictions (i.e., success probabilities), and (3) summarize the results via histogram. Panel D reports the results, suggesting that the jurisdiction is most likely to have three minority representatives.
These examples demonstrate that the logical model can help researchers establish a reasonable benchmark about the relationship between given districts and minority representation before conducting more “case-specific analyses” (Grofman, Handley, and Lublin Reference Grofman, Handley and Lublin2001, 1385). More applications, complex options (e.g., accounting for different turnout rates by race), and motivating examples are discussed in Appendix C.
Concluding Remarks
This article introduced a quantitatively predictive logical model that (1) unifies the two competing theories of minority representation by explicitly theorizing how minority candidates’ strategic entry reflects voter demand, (2) accurately predicts minority candidate emergence and electoral success in the real world, and (3) can assist researchers in answering important questions in redistricting and voting rights cases. Future research must extend the logical model to multiracial elections, where more than two sizable racial groups compete with each other. While I presented evidence that the model can predict minority representation well in less strictly biracial districts, more theoretical and empirical studies are necessary. Additionally, the model must cover other electoral systems (e.g., ranked-choice voting and multiseat elections with unlimited vote) by generalizing $ M $
and
$ M $
and $ C $
. Finally, future research must assess the model predictions in different contexts (e.g., congressional districts and at-large elections). Despite these limitations, the logical model offers a benchmark for developing more general models of minority representation.
$ C $
. Finally, future research must assess the model predictions in different contexts (e.g., congressional districts and at-large elections). Despite these limitations, the logical model offers a benchmark for developing more general models of minority representation.
SUPPLEMENTARY MATERIALS
To view supplementary material for this article, please visit http://dx.doi.org/10.1017/S000305542100054X.
DATA AVAILABILITY STATEMENT
Research documentation and data that support the findings of this study are openly available at the American Political Science Review Dataverse: https://doi.og/10.7910/DVN/F2OX6O. A corresponding R package logical: Computing and Visualizing Quantitative Predictions of Logical Models is available at https://github.com/YukiAtsusaka/logical.
ACKNOWLEDGMENTS
This manuscript was previously circulated as “Unifying Demand and Supply-Side Theories of Minority Representation: A Logical Model.” I would like to thank Melissa Marschall for generously allowing me to use the Louisiana mayoral election data that was collected by the Local Elections in America Project (LEAP) while the author was a research assistant to the project. For helpful comments and valuable feedback, I would like to thank Chano Arreguin-Abarca, Wendy K. Tam Cho, Bernard Fraga, Matthew Hayes, Jonathan Homola, Eric Juenke, Melissa Marschall, Jared Oestman, Tyler Reny, Liana Reyes-Reardon, Kaitlin Senk, Randy Stevenson, Rein Taagepera, Michelle Torres, M.C. Sunny Wong, Marques Zarate, members of the Rice Method Research Group (Gustavo Guajardo, Colin Jones, and Yui Nishimura), participants of the University of Houston EITM Summer Institute 2019, and three anonymous reviewers.
CONFLICTS OF INTEREST
The author declares no ethical issues or conflicts of interest in this research
ETHICAL STANDARDS
The author affirms this research did not involve human subjects.







 Open access


Comments
No Comments have been published for this article.