


Myopia, or nearsightedness, has reached unprecedented levels among youth worldwide, becoming a leading cause of visual impairment and a pressing global public health issue(Reference Guo, Wang and Yang1). In some parts of East Asia, up to 80–90 % of high school students are affected(Reference Ye, Hou and Song2), while recent analyses project that by 2050, myopia will affect nearly 740 million children and adolescents globally, with a prevalence rate approaching 40 %(Reference Liang, Pu and Chen3). Early-onset myopia not only interferes with academic and social development but also significantly increases the risk of high myopia and irreversible ocular complications later in life. While genetic predisposition contributes to susceptibility, the dramatic rise in myopia prevalence within just a few generations points strongly towards environmental and behavioural influences. Established modifiable risk factors include reduced time spent outdoors and increased engagement in near-work activities such as screen use and intensive education(Reference Holden, Fricke and Wilson4). However, these factors alone do not fully account for the current epidemic, leading to increasing interest in other lifestyle determinants, particularly diet. Therefore, exploring the independent contribution of modifiable factors like dietary patterns is crucial for developing comprehensive prevention strategies
Emerging evidence suggests that dietary patterns may influence ocular growth and refractive development through multiple biological mechanisms. High-glycaemic diets rich in refined carbohydrates can induce hyperinsulinemia and elevate insulin-like growth factor 1 levels, which may stimulate excessive axial elongation of the eye(Reference Galvis, López-Jaramillo and Tello5). This ‘carbohydrate–insulin’ hypothesis, initially proposed decades ago, is now supported by studies linking childhood obesity and myopia, indicating that metabolic dysfunction may play a role in refractive error development(Reference Lee, Lee and Lee6). In addition, dietary quality may influence pathways related to inflammation and oxidative stress. Poor-quality, pro-inflammatory diets have been implicated in scleral remodelling and myopia progression(Reference Wei, Kung and Chen7,Reference Ye, Hou and Song8) , whereas nutrient-dense diets rich in antioxidants (e.g. from fruits and vegetables) may preserve ocular integrity by mitigating oxidative stress(Reference Zhang, Wu and Yi9) Moreover, n-3 PUFA – sourced from fish and nuts – have been shown to protect against myopia in animal models by attenuating abnormal eye growth. Observational studies in children have further linked healthier eating patterns with a reduced odds of myopia(Reference Yin, Gan and Xu10). Nevertheless, findings from single-nutrient studies remain inconsistent or contradictory, highlighting the need to evaluate comprehensive dietary patterns rather than isolated nutrients when exploring the dietary determinants of myopia.
Among various dietary models, the Mediterranean diet (MED) has drawn growing attention for its broad health benefits and potential relevance to eye health. The MED is characterised by high consumption of plant-based foods (vegetables, fruits, legumes, nuts and whole grains), regular intake of fish, a predominance of unsaturated fats (mainly from olive oil) and limited intake of red or processed meats and sweets(Reference Trichopoulou, Costacou and Bamia11). It has been consistently associated with reduced risk of cardiovascular, metabolic and neurodegenerative diseases(Reference Mohammadifard, Rahimlou and Amani-Beni12,Reference Niu, Zhang and Zhou13) , and its antioxidant- and anti-inflammatory-rich composition is believed to be beneficial for ocular health(Reference Jang, Choi and Kim14). To quantify MED adherence, we employed the alternate Mediterranean diet (aMED) score(Reference Fung, Rexrode and Mantzoros15), a modified version of the traditional MED score developed for use in non-Mediterranean populations. Although the aMED index is widely used in nutritional epidemiology and has been extensively investigated for cardiometabolic and neurodegenerative outcomes(Reference Zhang, Wu and Liu16–Reference Zhu, Liu and Qu18), its association with visual health remains largely unexplored. While a few studies have examined other dietary patterns(Reference Yin, Gan and Xu10), to our knowledge, no prior study has utilised a large, nationally representative US cohort, such as National Health and Nutrition Examination Survey (NHANES), to investigate the specific association between the aMED score and myopia in American adolescents. This study was designed to address this gap.
In this context, we examined whether higher adherence to the aMED is associated with reduced myopia odds in adolescents. Using nationally representative data and controlling for key demographic and lifestyle covariates, we conducted a cross-sectional analysis to isolate the potential effect of overall dietary pattern on refractive development. While acknowledging the critical role of factors like near-work and outdoor activity, this study focuses on diet as a distinct, potentially modifiable component of myopia prevention, aiming to provide novel insights beyond traditional behavioural risk factors.
Materials and methods
Survey description
The NHANES is conducted biennially to obtain health and nutritional data from a nationally representative sample of the non-institutionalised US civilian population. This survey adopts a complex, multistage probability sampling design to monitor long-term trends across the country. The study protocol was approved by the Ethics Review Board of the National Center for Health Statistics (NCHS), and informed consent was obtained from all participants. All procedures were carried out in accordance with applicable federal regulations and ethical standards.
Study population
This analysis included data from 20 497 NHANES participants surveyed between 2005 and 2008. To ensure data quality and analytical precision, several exclusion criteria were applied. Participants were excluded if they: (1) were younger than 12 or older than 18 years; (2) lacked valid refractive measurement to calculate spherical equivalent (SE); or (3) had incomplete dietary records, defined as having less than 1 d of complete 24-h dietary recall data, which is insufficient for reliable aMED score calculation (Figure 1).
Flow chart of participants’ selection. NHANES, National Health and Nutrition Examination Survey.

Dietary assessment
Trained interviewers collected one 24-h dietary recall data from each participant using the US Department of Agriculture (USDA) Automated Multiple-Pass Method (AMPM). This structured interview process consists of five steps: (1) a ‘Quick List’ allowing the participant an uninterrupted recall of all foods and beverages; (2) a ‘Forgotten Foods’ probe, which uses a standardised list to query for commonly omitted items (e.g. snacks and beverages); (3) a ‘Time and Occasion’ step to organise the recalled items by meal; (4) a ‘Detail Cycle’ to obtain specific descriptions, quantities and preparation methods for each item; and (5) a ‘Final Review’ to read back the complete recall to the participant for verification(Reference Blanton, Moshfegh and Baer19). This multi-pass structure is a validated technique designed to maximise the accuracy and completeness of dietary intake reporting by minimising the underreporting common in simpler recall methods(Reference Conway, Ingwersen and Vinyard20). Participants were asked to recall all food and beverages consumed in the previous 24 h, aided by visual and portion size estimation tools. The dietary data were then linked to the Food Patterns Equivalents Database (FPED), which translates intake into thirty-seven standardised USDA food pattern components based on a comprehensive food composition database. This enabled consistent evaluation of dietary intake across the population.
Calculation of alternate Mediterranean diet and other dietary indices
The aMED score, as adapted by Fung et al.(Reference Fung, Rexrode and Mantzoros15), was calculated using the dietaryindex package(Reference Zhan, Hodge and Dunlop21). It consists of nine components: total fruits (including 100 % fruit juice), total vegetables (excluding potatoes and legumes), whole grains, legumes, nuts, total fish, red and processed meats, the ratio of monounsaturated to saturated fats and alcohol consumption. Each participant received 1 point for intake above the sample median for beneficial components and 0 otherwise. Red and processed meat intake was reverse-scored, with 1 point awarded for consumption below the median. Alcohol intake was scored based on sex-specific guidelines(Reference Snetselaar, de Jesus and DeSilva22): 1 point was assigned if consumption was 5–15 g/d for women or 10–25 g/d for men. The total aMED score ranged from 0 to 9, with higher scores indicating greater adherence to the Mediterranean dietary pattern.
To enable a comprehensive comparison of dietary pattern effects on myopia, all other relevant indices – including the MED, Alternative Healthy Eating Index (AHEI), Dietary Approaches to Stop Hypertension Index (DASHI), Healthy Eating Index-2020 (HEI-2020)(Reference Xu, Zhan and Gao23), Healthy Eating Index-2015 (HEI-2015)(Reference Li, Lyu and Zhang24) and the Dietary Inflammatory Index (DII)(Reference Zhou, Zhang and Li25) – were also calculated using the same standardised dietaryindex R package(Reference Zhan, Hodge and Dunlop21), following the methodology specific to each index’s original citation. These indices assess distinct aspects of diet quality: AHEI and HEI-2020/2015 are indicators of overall diet quality based on adherence to federal dietary guidelines; DASHI is designed to promote foods that lower blood pressure; and DII is a composite index that evaluates the inflammatory potential of an individual’s diet.
Myopia assessment
Refractive error was objectively assessed in participants aged 12 years and older using a non-cycloplegic autorefractor/keratometer as previously described(Reference Chen, Sheng and Wang26). Three readings were obtained per eye, and the mean value was used. SE was calculated as the spherical value plus half the cylindrical value. Due to high inter-eye correlation, only the right eye’s SE was used for analysis. Myopia was defined as SE ≤ −0·50 dioptres (D)(Reference Ye, Hou and Song2,Reference Sandhu, Munoz and Swenor27) , emmetropia as SE > −0·50 D to ≤0·50 D and hyperopia as SE > 0·50 D.
Covariate assessment
To control for potential confounding, we included a range of demographic, socio-economic and health-related variables. Data were collected through standardised family and individual questionnaires and physical examinations. Sociodemographic information, including age, gender, race and education level, was obtained via interview. Race was categorised as Mexican American, Non-Hispanic White, Non-Hispanic Black and Other. Education level was grouped as: <9th grade, 9th–11th grade and high school graduate or above. Socio-economic status was assessed using the poverty income ratio (PIR), calculated by dividing family income by the poverty guidelines specific to the family size, year and state. PIR was stratified into three categories: ≤1·3 (low income), 1·3–3·5 (medium income) and >3·5 (high income).
Anthropometric data were collected by trained health technicians in the Mobile Examination Center (MEC). Standing height was measured using a stadiometer, and body weight was measured using a digital scale. BMI was calculated as weight in kilograms divided by height in metres squared (kg/m2). BMI was classified as <25 kg/m2 (normal), 25–302kg/m2 (overweight) and >30 kg/m2 (obese). Total energy intake was derived from the 24-h dietary recall interview. Age was further categorised into two groups (12–15 and 16–18 years) to account for potential differences in myopia development during early v. later adolescence.
Statistical analysis
Descriptive statistics were used to summarise participant characteristics: continuous variables were reported as means and standard deviations, and categorical variables as frequencies and percentages. aMED scores were divided into quintiles (Q1–Q5), with Q1 serving as the reference. Weighted multivariable logistic regression models were applied to estimate OR and 95 % CI for the association between aMED adherence and myopia odds. Three models were developed: model 1 (unadjusted), model 2 (adjusted for age, sex and race) and model 3 (further adjusted for education, PIR, BMI and energy intake). Non-linear associations were explored using restricted cubic spline regression. Subgroup and interaction analyses were conducted by age, sex, race, education, PIR and BMI. Weighted quantile sum regression was applied to evaluate the contribution of specific nutrients within the aMED framework to the odds of myopia.
To investigate potential biological pathways, mediation analyses were performed with dietary cholesterol (CHOL) and PUFA 20:4 (eicosatetraenoic acid, ETA) as candidate mediators. Sensitivity analyses were also conducted to ensure robustness. These included (1) reanalysis using unweighted models, (2) redefining myopia using SE ≤–1·00 D(Reference Chen, Sheng and Wang26) and (3) restricting analysis to the 2005–2006 NHANES cycle to test temporal consistency.
All analyses were conducted using R software (version 4.4.0), and statistical significance was defined as a two-tailed P-value < 0·05.
Results
Baseline characteristics
A total of 2473 adolescents aged 12 to 18 years were included in the analysis, comprising 1090 participants with myopia and 1383 without, representing weighted population proportions of 41 and 59 %, respectively (Table 1). The median age was 15 years, with no significant difference between the myopic and non-myopic groups (P = 0·235). Sex distribution was nearly balanced (50·54 % male), and no significant sex difference was observed between groups (P = 0·529). Although the racial composition differed slightly, a higher proportion of Non-Hispanic White participants was observed in the non-myopia group (67·81 %) than in the myopia group (60·62 %), though this difference did not reach statistical significance (P = 0·056). Educational attainment, PIR and BMI categories were similarly distributed across groups. Overall, the median aMED score for the entire adolescent population was 3·00 (IQR: 2·00–3·50), indicating a generally low adherence to the Mediterranean-style diet (Table 1). Notably, the myopia group exhibited significantly lower aMED scores (P = 0·004), suggesting a potential dietary disparity.
Baseline characteristics of the study

PIR, poverty income ratio; SE, spherical equivalent; aMED, alternate Mediterranean diet.
* Median (Q1, Q3); n (unweighted) (%).
† Design-based Kruskal–Wallis test; Pearson’s X 2: Rao and Scott adjustment.
Association between alternate Mediterranean diet and myopia
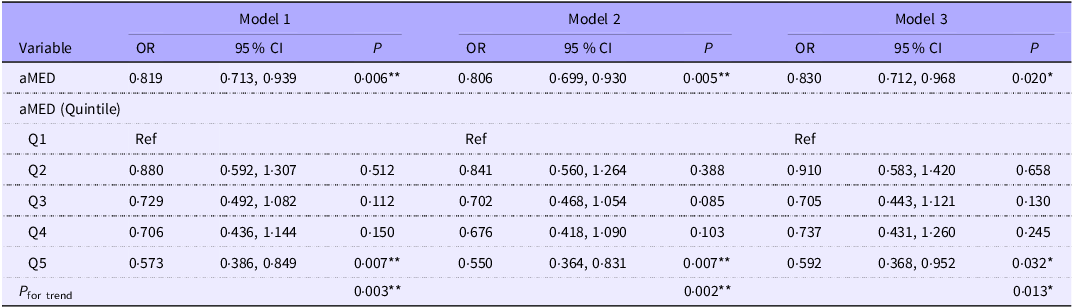
In multivariable logistic regression analysis adjusted for age, sex, race, education level, PIR, BMI and total energy intake (model 3), higher aMED adherence was significantly associated with a lower odds of myopia (OR = 0·830, 95 % CI 0·712–0·968, p = 0·020) (Table 2). Specifically, participants in the highest aMED quintile had a 40·8 % lower odds of myopia compared with those in the lowest quintile (ORQ5 v. Q1 = 0·592, 95 % CI 0·368–0·952, p = 0·032). A significant dose–response trend was also observed across increasing quintiles (p = 0·013). For comparison, the association between myopia and other dietary indices – including the AHEI, DASHI, MED, HEI-2020, HEI-2015 and DII – was also examined (Supplementary Table S1). None of these indices showed a significant association with myopia, suggesting a stronger association with myopia compared with the other dietary indices examined.
The association between aMED and myopia among 2473 adolescents using multivariable logistic regression

aMED, alternate Mediterranean diet; PIR, poverty income ratio.
Model 1, unadjusted; model 2, adjusted for age, sex and race; model 3, adjusted for age, sex, race, education, PIR, BMI and energy intake.
*P < 0.05; **P < 0.01; ***P < 0.001.
Restricted cubic spline and subgroup analyses
To further explore the relationship between aMED and myopia, restricted cubic spline analysis was performed, revealing a significant non-linear association (P for non-linearity = 0·005) (Figure 2), even after adjustment for covariates in model 3. Subsequent stratified analyses examined the association across subgroups based on age, sex, race, education level, PIR and BMI. Significant inverse associations were observed in adolescents aged 16–18 years (p = 0·043), females (p = 0·008), those with a high school education or above (p = 0·019), individuals with normal weight (p = 0·015) and those classified as obese (p = 0·002) (Figure 3). No significant interaction effects were detected, indicating that the association between aMED and reduced myopia odds was generally consistent across subgroups. Similar trends were observed when aMED was analysed in quintile format (Supplementary Figures S1–S3).
Restricted cubic spline analysis between aMED and myopia. aMED, alternate Mediterranean diet.

Subgroup analysis of association between aMED and myopia. ‘*’, p < 0·05; ‘**’, p < 0·01; ‘***’, p < 0·001. aMED, alternate Mediterranean diet.

Weighted quantile sum and mediation analyses
Weighted quantile sum regression identified a significant inverse association between the weighted quantile sum index and myopia odds (OR = 0·193, 95 % CI 0·053–0·704, p = 0·013). Among dietary components, the ratio of monounsaturated to saturated fat was the most influential contributor to reduced myopia odds (weight = 0·212), followed by fruit intake (weight = 0·110). Alcohol, nuts, fish and legumes contributed comparably, each with weights about 0·103 (Figure 4), suggesting these components may play a significant role in the observed association.
Weighted quantile sum analysis of aMED components and myopia. aMED, alternate Mediterranean diet.

Mediation analyses were conducted to explore whether CHOL and ETA (PUFA 20:4) mediated the aMED–myopia association. Higher aMED scores were significantly associated with lower CHOL (estimate = –17·324, 95 % CI –24·271 to –9·806, p < 0·001) and lower ETA (estimate = –0·011, 95 % CI –0·015 to –0·006, p < 0·001) levels (Figure 5). CHOL and ETA accounted for 23·22 and 12·37 % of the total effect of aMED on myopia odds, respectively. Comparable mediation results were observed when aMED was categorised by quintiles (Supplementary Figure. S4), reinforcing their roles in the proposed pathway.
Median analyses of CHOL (a) and ETA (b) in the relationship between aMED and myopia. CHOL, dietary cholesterol; ETA, eicosatetraenoic acid; aMED, alternate Mediterranean diet.

Sensitivity analyses
Multiple sensitivity analyses were performed to assess the robustness of the findings. First, analyses based on unweighted models confirmed a significant inverse relationship between aMED and myopia (OR = 0·921, 95 % CI 0·850–0·997, p = 0·043; model 3; Supplementary Table S2). Quintile-based analysis yielded consistent results (ORQ5 v. Q1 = 0·746, 95 % CI 0·572–0·972, p = 0·030). Second, redefining myopia using a more stringent cut-off (SE ≤ –1·00 D) still produced a significant association with aMED (OR = 0·831, 95 % CI 0·710–0·973, p = 0·024; Supplementary Table S2), with similar findings observed under quintile classification (ORQ5 v. Q1 = 0·640, 95 % CI 0·412–0·995, p = 0·048), further supporting the consistency of the observed relationship. Finally, the inverse association remained significant in the 2005–2006 NHANES cycle (OR = 0·794, 95 % CI 0·645–0·976, p = 0·038; model 3; Supplementary Table S2). Although further quintile-based analysis was limited by smaller sample size, the consistency of results across all sensitivity analyses supports the robustness of our primary findings.
Discussion
In this nationally representative sample of US adolescents, we identified a robust and significant inverse association between adherence to the aMED and the odds of myopia. Even after adjusting for major demographic and lifestyle confounders available within the dataset, participants with the highest aMED scores were notably less likely to have myopia compared with those with the lowest adherence. This inverse association suggests that a Mediterranean-style dietary pattern may confer cross-sectional link with protective factors for ocular health during adolescence – a critical period for refractive development. While the aetiology of myopia is multifactorial, with near-work and outdoor time being established risk factors, our study provides compelling evidence that diet quality represents an important and potentially independent area for preventive strategies.
The biological plausibility of this association is strong and supported by multiple mechanistic pathways. The protective effect of the Mediterranean diet is likely not due to a single nutrient, but rather the synergistic action of its components. First, the n-3 fatty acid pathway offers structural protection: the high content of long-chain n-3s (DHA and EPA)(Reference Nettleton28) may help maintain scleral integrity by improving choroidal blood flow and suppressing the expression of hypoxia-inducible factor-1α in the sclera(Reference Chen, Ikeda and Yang29–Reference Pan, Zhao and Xie31). This anti-inflammatory and vascular-supportive action is essential for resisting the pathological changes associated with myopic eye growth(Reference Zhou, Zhang and Zhang30). Second, the antioxidant and anti-inflammatory properties of the diet provide a key neuroprotective mechanism. The abundant intake of carotenoids (lutein and zeaxanthin) from fruits and vegetables mitigates oxidative stress in the retina, which is highly vulnerable to damage(Reference Kalt, Hanneken and Milbury32–Reference Junghans, Sies and Stahl35). This ‘internal sunglasses’ effect shields photoreceptors and supports the visual feedback loop essential for emmetropisation(Reference Roberts and Dennison36,Reference Marcos37) These two pathways – vascular/structural support and retinal neuroprotection – function synergistically to preserve ocular integrity.
A key contribution of this study is the mediation analysis, which sheds light on potential biological pathways linking diet quality and myopia. We identified CHOL and ETA as significant partial mediators in the association between aMED adherence and myopia odds. Higher adherence to the aMED was associated with lower levels of both CHOL and ETA, which in turn were independently linked to reduced myopia odds. These mediators accounted for 23·2 and 12·4 % of the total effect in our study, respectively, indicating that improvements in lipid metabolism and fatty acid profiles may partly explain the protective influence of the Mediterranean diet(Reference Frank, Pala and Gualtieri38,Reference Moțățăianu, Ion and Dumitreasă39) . The finding that ETA (an n-6 fatty acid) is a mediator is particularly noteworthy. The Mediterranean diet is known to improve the n-6 to n-3 ratio, shifting the balance away from pro-inflammatory eicosanoids derived from n-6s towards anti-inflammatory ones derived from n-3s(Reference Xue, Li and Dong40). Therefore, lower levels of ETA in those with high aMED scores may reflect a less pro-inflammatory systemic environment, which is consistent with the proposed protective mechanisms. While CHOL and ETA contributed significantly, their partial mediation suggests that other biological pathways – such as the direct antioxidant effects or enhanced ocular circulation discussed above – are also likely involved.
Further context for our findings comes from the subgroup and dietary index comparison analyses. The observation that the protective association was more pronounced in older adolescents (16–18 years) could suggest a cumulative effect; the benefits of a high-quality diet may become more apparent over time(Reference Herman, Nguyen and Sturm41). In contrast, the rapid ocular growth and stronger genetic influences in early age might temporarily overshadow dietary effects(Reference Sánchez-Tena, Martinez-Perez and Villa-Collar42,Reference Tedja, Wojciechowski and Hysi43) . Furthermore, the aMED score emerged as a more robust predictor of myopia odds compared with other common diet quality indices. This suggests that the specific components emphasised in the aMED – such as high n-3 intake from fish, abundant antioxidants from specific plant sources, and a favourable fatty acid profile – are particularly relevant to the biological mechanisms of ocular health(Reference Zhang, Sui and Yin44–Reference Zhang, Xiao and Zhao46). More generalised indices, such as AHEI and HEI-2020, by not capturing these specific food groups(Reference Poursalehi, Bahrami and Mirzaei47,Reference Chen, Diao and Zhang48) , may dilute the true association between diet and myopia, highlighting the value of using targeted dietary indices like aMED for investigating nutrition-related eye outcomes.
Our study offers several methodological and scope advantages that contribute to the nutritional epidemiology of myopia compared with previous research. Prior research often adopted a reductionist approach, focusing on isolated nutrients (e.g. n-3 PUFA, saturated fat and cholesterol)(Reference Zhang, Zhang and Zhang49,Reference Ai, Zhu and Yang50) , which critically fails to capture the powerful, synergistic protection of a whole diet. Our study, conversely, utilised the validated and standardised aMED scoring system to demonstrate a superior, pattern-specific inverse association with myopia odds. Furthermore, much foundational adverse diet data stems from East Asian cohorts (China and Korea)(Reference Xu51), where region-specific high Na/carbohydrate consumption limits global applicability. Our use of a large, nationally representative and well-characterised US adolescent population significantly enhances the generalisability of the aMED’s protective effect, overcoming this regional bias. Moreover, most existing reports use less precise FFQ, which are highly susceptible to measurement error(Reference Xu51). We overcame this methodological weakness by using objectively measured refractive error data and dietary intake rigorously assessed via the standardised, validated AMPM 24-h recall, ensuring high data quality and reliability. Finally, where prior large reports establish a broad statistical association without defining the underlying mechanism(Reference Ye, Hou and Song2,Reference Berticat, Venturini and Daien52) , our work provided mechanistic human evidence via mediation analysis, confirming that lower dietary CHOL and ETA partially mediate the aMED’s protective effect.
However, several limitations must be acknowledged. The primary limitation is the cross-sectional design, which precludes causal inference; we cannot confirm temporal directionality. Second, we were unable to control for key, established environmental risk factors for myopia, namely time spent in near-work activities (including screen time), time spent outdoors and physical activity. Our detailed review of the NHANES data confirmed that ‘time spent outdoors’ data was non-existent in the 2005–2008 cycles, while ‘near-work activity’ data was not collected for adolescents and methodologically inconsistent (measuring ‘total sedentary time’) in the cycle of 2007–2008. Likewise, we could not adjust for physical activity due to similar methodological constraints: the activity definition shifted between cycles (general activity v. recreational activity only), making harmonisation unreliable, and the available quantitative data from 2007 to 2008 alone would have reduced the sample size to a highly biased and statistically insufficient. These data limitations precluded our ability to conduct a reliable sensitivity analysis. Finally, dietary intake was self-reported via a single 24-h recall, which may not capture long-term habits and is subject to recall bias. This introduces a risk of measurement error, which, while likely non-differential and biasing the results towards the null, remains a significant limitation. Future longitudinal cohort studies that are specifically designed to collect concurrent, detailed data on diet, near-work and outdoor time are essential to disentangle these complex interrelationships and establish causality.
Conclusion
In conclusion, this study provides important observational evidence that greater adherence to a Mediterranean-style diet is cross-sectionally associated with lower odds of myopia in a nationally representative sample of US adolescents. This association is supported by plausible biological pathways involving lipid metabolism and fatty acid profiles. While the findings must be interpreted with caution due to the cross-sectional design and the inability to establish causality or control for key environmental confounders, they suggest that diet quality is a relevant factor in ocular health. Future longitudinal cohort studies are urgently needed to establish the temporal directionality of this association, while randomised controlled trials are imperative to definitively determine whether adopting a Mediterranean-style diet can serve as an effective intervention to prevent myopia onset or retard its progression.
Supplementary material
For supplementary material/s referred to in this article, please visit https://doi.org/10.1017/S0007114525106223
Acknowledgements
The authors sincerely thank all the staff members who contributed to this study.
This work was supported by from General Project of the Zhejiang Provincial Medical and Health Science and Technology Program (grant no. 2025HY1021).
X.H. carried out the studies, participated in collecting data and drafted the manuscript. Y.Y. performed the statistical analysis and participated in its design. X.J. participated in acquisition, analysis or interpretation of data and draft the manuscript. All authors read and approved the final manuscript.
The authors declare that there are no conflicts of interest.


 Open access