


1. Introduction
Prediction-based processing is such a fundamental cognitive mechanism that it has been stated that brains are essentially prediction machines (Clark, Reference Clark2013). Language processing is one of the domains in which context-sensitive prediction plays an important role. Predictions are generated through associative activation of relevant mental representations. Prediction-based processing can thus yield insight into mental representations of language. This understanding can be deepened by paying attention to variation across speakers. As yet, most investigations in this field of research suffer from a lack of attention to such variation. We will show why this is an important limitation and how it can be remedied.
A variety of studies indicate that people generate expectations about upcoming linguistic elements and that this affects the effort it takes to process the subsequent input (see Huettig, Reference Huettig2015; Kuperberg & Jaeger, Reference Kuperberg and Jaeger2016; Kutas, DeLong, & Smith, Reference Kutas, DeLong, Smith and Bar2011, for recent overviews). One of the types of knowledge that can be used to generate expectations is knowledge about the patterns of co-occurrence of words, which is mainly based on prior experiences with these words. To date, word predictability has been expressed as surprisal based on co-occurrence frequencies in corpus data, or as cloze probability based on completion task data. Predictive language processing, then, is usually demonstrated by relating surprisal or cloze probability to an experimental measure of processing effort, such as reaction times. If a word’s predictability is determined by the given context and stored probabilistic knowledge resulting from cumulative exposure, surprisal or cloze probability can be used to predict ease of processing.
Crucially, in nearly all studies to date, the datasets providing word predictability measures come from different people than the datasets indicating performance in processing tasks, and that is a serious shortcoming. Predictability will vary across language users, since people differ from each other in their linguistic experiences. The corpora that are commonly used are at best a rough approximation of the participants’ individual experiences. Whenever cloze probabilities from a completion task are related to reaction time data, the experiments are conducted with different groups of participants. The studies conducted so far offer little insight into the degrees of individual variation and task-dependent differences, and they adopt a coarse-grained approach to the investigation of prediction-based processing.
The main goal of this paper is to reveal to what extent differences in experience result in different expectations and responses to experimental stimuli, thus pointing to differences in mental representations of language. This advances our understanding of the theoretical status of individual variation and its methodological Implications. We use two domains of language use and three groups of speakers that can reasonably be expected to differ in experience with one of these domains. First, we examine the variation within and between groups in the predictions participants generate in a completion task. Subsequently, we investigate to what extent a participant’s own expectations affect processing speed. If both the responses in a completion task and the time it takes to process subsequent input are reflections of prediction-based processing, then an individual’s performance on the processing task should correlate with his or her performance on the completion task. Moreover, given individual variation in experiences and expectations, a participant’s own responses in the completion task may prove to be a better predictor than surprisal estimates based on data from other people.
To investigate this, we conducted two experiments with the same participants who belonged to one of three groups: recruiters, job-seekers, and people not (yet) looking for a job. These groups can be expected to differ in experience with word sequences that typically occur in the domain of job hunting (e.g., goede contactuele eigenschappen ‘good communication skills’, werving en selectie ‘recruitment and selection’). The groups are not expected to differ systematically in experience with word sequences that are characteristic of news reports (e.g., de Tweede Kamer ‘the House of Representatives’, op een gegeven moment ‘at a certain point’). For each of these two registers, we selected 35 word sequences and used these as stimuli in two experiments that yield insight into participants’ linguistic representations and processing: a Completion task and a Voice Onset Time experiment.
In the following section, we discuss the concept of predictive processing in more detail. We describe how prediction in language processing is commonly investigated, focusing on the research design of those studies and the limitations. We then report on the outcomes of our study into variation in predictions and processing speed. The results show that there are meaningful differences to be detected between groups of speakers, and that a small collection of data elicited from the participants themselves can be more informative than general corpus data. The prediction-based effects we observe are shown to be clearly influenced by differences in experience. On the basis of these findings, we argue that it is worthwhile to go beyond amalgamated data whenever prior experiences form a predictor in models of language processing and representation.
1.1. prediction-based processing in language
Context-sensitive prediction is taken to be a fundamental principle of human information processing (Bar, Reference Bar2007; Clark, Reference Clark2013). As Bar (2007, p. 281) puts it, “the brain is continually engaged in generating predictions”. These processes have been observed in numerous domains, ranging from the formation of first impressions when meeting a new person (Bar, Neta, & Linz, Reference Bar, Neta and Linz2006), to the gustatory cortices that become active not just when tasting actual food, but also while looking at pictures of food (Simmons, Martin, & Barsalou, Reference Simmons, Martin and Barsalou2005), and the somatosensory cortex that becomes activated in anticipation of tickling, similar to the activation during the actual sensory stimulation (Carlsson, Petrovic, Skare, Petersoon, & Ingvar, Reference Carlsson, Petrovic, Skare, Petersoon and Ingvar2000).
In order to generate predictions, the brain “constantly accesses information in memory” (Bar, Reference Bar2007, p. 288), as predictions rely on associative activation. We extract repeating patterns and statistical regularities from our environment and store them in long-term memory as associations. Whenever we receive new input (from the senses or driven by thought), we seek correspondence between the input and existing representations in memory. We thus activate associated, contextually relevant representations that translate into predictions. So, by generating a prediction, specific regions in the brain that are responsible for processing the type of information that is likely to be encountered are activated. The analogical process can thus assist in the interpretation of subsequent input. Furthermore, it can strengthen and augment the existing representations.
Expectation-based activation comes into play in a wide variety of domains that involve visual and auditory processing (see Bar, Reference Bar2007; Clark, Reference Clark2013). Language processing is no exception in this respect (see, for example, Kuperberg & Jaeger, Reference Kuperberg and Jaeger2016). This is in line with the cognitive linguistic framework, which holds that the capacity to acquire and process language is closely linked with fundamental cognitive abilities. In the domain of language processing, prediction entails that language comprehension is dynamic and actively generative. Kuperberg and Jaeger list an impressive body of studies that provide evidence that readers and listeners anticipate structure and/or semantic information prior to encountering new bottom-up information. People can use multiple types of information – ranging from syntactic, semantic, to phonological, orthographic, and perceptual – within their representation of a given context to predictively pre-activate information and facilitate the processing of new bottom-up inputs.
There are several factors that influence the degree and representational levels to which we predictively pre-activate information (Brothers, Swaab, & Traxler, Reference Brothers, Swaab and Traxler2017; Kuperberg & Jaeger, Reference Kuperberg and Jaeger2016). The extent to which a context is constraining matters (e.g., a context like “The day was breezy so the boy went outside to fly a …” will pre-activate a specific word such as ‘kite’ to a higher degree than “It was an ordinary day and the boy went outside and saw a …”). Contexts may also differ in the types of representations they constrain for (e.g., they could evoke a specific lexical item, or a semantic schema, like a restaurant script). In addition to that, the comprehender’s goal and the instructions and task demands play a role. Whether you quickly scan, read for pleasure, or carefully process, a text may affect the extent to which you generate predictions. Also, the speed at which bottom-up information unfolds is of influence: the faster the rate at which the input is presented, the less opportunity there is to pre-activate information.
The contextually relevant associations that are evoked seem to be pre-activated in a graded manner, through probabilistic prediction. On this account, the mental representations for expected units are activated more than those of less expected items (Roland, Yun, Koenig, & Mauner, Reference Roland, Yun, Koenig and Mauner2012). The expected elements, then, are easier to recognize and process when they appear in subsequent input. When the actual input does not match the expectations, it is more surprising and processing requires more effort.
As Kuperberg and Jaeger (Reference Kuperberg and Jaeger2016) observe, most empirical work has focused on effects of lexical constraint on processing. These studies indicate that a word’s probability in a given context affects processing as reflected in reading times (Fernandez Monsalve, Frank, & Vigliocco, 2012; McDonald & Shillcock, Reference McDonald and Shillcock2003; Roland et al., Reference Roland, Yun, Koenig and Mauner2012; Smith & Levy, Reference Smith and Levy2013), reaction times (Arnon & Snider, Reference Arnon and Snider2010; Traxler & Foss, Reference Traxler and Foss2000), and N400 effects (Brothers, Swaab, & Traxler, Reference Brothers, Swaab and Traxler2015; DeLong, Urbach, & Kutas, Reference DeLong, Urbach and Kutas2005; Frank, Otten, Galli, & Vigliocco, Reference Frank, Otten, Galli and Vigliocco2015; Van Berkum, Brown, Zwitserlood, Kooijman, & Hagoort, Reference Van Berkum, Brown, Zwitserlood, Kooijman and Hagoort2005). A word’s probability is commonly expressed as cloze probability or surprisal. The former is obtained by presenting participants with a short text fragment and asking them to fill in the blank, naming the most likely word (i.e., a completion task or cloze procedure; Taylor, Reference Taylor1953). The cloze probability of a particular word in the given context is expressed as the percentage of individuals that complemented the cue with that word (DeLong et al., Reference DeLong, Urbach and Kutas2005, p. 1117). A word’s surprisal is inversely related, through a logarithmic function, to the conditional probability of a word given the sentence so far, as estimated by language models trained on text corpora (Levy, Reference Levy2008). Surprisal thus expresses the extent to which an incoming word deviates from what was predicted.
1.2. usage-based variation in prediction-based processing
The measures that quantify a word’s predictability in studies to date – cloze probabilities and surprisal estimates – are coarse-grained approximations of participants’ experiences. The rationale behind relating processing effort to these scores is that they gauge people’s experiences and resulting predictions. The responses in a completion task are taken to reflect people’s knowledge resulting from prior experiences; the corpora that are used to calculate surprisal are supposed to represent such experiences. However, the cloze probabilities and surprisal estimates are based on amalgamations of data of various speakers, and they are compared to processing data from yet other people. Given that people differ from each other in their experiences, this matter should not be treated light-heartedly. Language acquisition studies have convincingly shown children’s language production to be closely linked to their own prior experiences (e.g., Borensztajn, Zuidema, & Bod, Reference Borensztajn, Zuidema and Bod2009; Dąbrowska & Lieven, Reference Dąbrowska and Lieven2005; Lieven, Salomo, & Tomasello, Reference Lieven, Salomo and Tomasello2009). In adults, individual variation in the representation and processing of language has received much less attention.
If we assume that prediction-based processing is strongly informed by people’s past experiences, the best way to model processing ease and speed would require a database with all of someone’s linguistic experiences. Unfortunately, linguists do not have such databases at their disposal. One way to investigate the relationship between experiences, expectations, and ease of processing is to use groups of speakers who are known to differ in experience with a particular register, and to compare the variation between and within the groups. This can then be contrasted with a register with which the groups’ experiences do not differ systematically. Having participants take part in both a task that uncovers their predictions and a task that measures processing speed makes it possible to relate reaction times to participants’ own expectations.
A comparison of groups of speakers to reveal usage-based variation appears to be a fruitful approach. Various studies indicate that people with different occupations (Dąbrowska, Reference Dąbrowska2008; Gardner, Rothkopf, Lapan, & Lafferty, Reference Gardner, Rothkopf, Lapan and Lafferty1987; Street & Dąbrowska, Reference Street and Dąbrowska2010, 2014), from different social groups (Balota, Cortese, Sergent-Marshall, Spieler, & Yap, Reference Balota, Cortese, Sergent-Marshall, Spieler and Yap2004; Caldwell-Harris, Berant, & Edelman, Reference Caldwell-Harris, Berant, Edelman, Divjak and Gries2012), or with different amounts of training (Wells, Christiansen, Race, Acheson, & MacDonald, Reference Wells, Christiansen, Race, Acheson and MacDonald2009) vary in the way they process particular words, phrases, or (partially) schematic constructions with which they can be expected to have different amounts of experience. To give an example, Caldwell-Harris and colleagues (2012) compared two groups with different prayer habits: Orthodox Jews and secular Jews. They administered a perceptual identification task in which phrases were briefly flashed on a computer screen, one word immediately after the other. Participants were asked to report the words they saw, in the order in which they saw them. As expected, the two groups did not differ from each other in performance regarding the non-religious stimuli. On the religious phrases, by contrast, Orthodox Jews were found to be more accurate and to show stronger frequency effects than secular Jews. The participants who had greater experience with specific phrases could more easily match the brief, degraded input to a representation in long-term memory, recognize, and report it. Note, however, that these studies do not relate the performance on the experimental tasks to any other data from the participants themselves, and, with the exception of Street and Dąbrowska (Reference Street and Dąbrowska2010, 2014), the researchers pay little attention to the degree of variation within each of the groups of participants.
While we would expect individual differences in experience to affect prediction-based processing, as those predictions are built on prior experience, very little research to date has looked into this. To draw conclusions about the strength of the relationship between predictions and processing effort, and the underlying mental representations, we ought to pay attention to variation across language users. This will, in turn, advance our understanding of the role of experience in language processing and representation and the theoretical status of individual variation.
2. Outline of the present research
In this paper, we examine variation between and within three groups of speakers, and we relate the participants’ processing data to their own responses on a task that reveals their context-sensitive predictions. Our first research question is: To what extent do differences in amount of experience with a particular register manifest themselves in different expectations about upcoming linguistic elements when faced with word sequences that are characteristic of that register? Our second research question is: To what extent do a participant’s own responses in a completion task predict processing speed over and above word predictability measures based on data from other people?
To investigate this, we had three groups of participants – recruiters, job-seekers, and people not (yet) looking for a job – perform two tasks: a Completion task and a Voice Onset Time (VOT) task. In both tasks, we used two sets of stimuli: word sequences that typically occur in the domain of job hunting and word sequences that are characteristic of news reports. In the Completion task, the participants had to finish a given incomplete phrase (e.g., goede contactuele … ‘good communication …’), listing all things that came to mind. In the VOT task, the participants were presented with the same cues, followed by a specific target word (e.g., eigenschappen ‘skills’), which they had to read aloud as quickly as possible. The voice onset times for this target word indicate how quickly it is processed in the given context.
The cue is taken to activate knowledge about the words’ co-occurrence patterns based on one’s prior experiences. Upon reading the cue, participants thus generate predictions about upcoming linguistic elements. In the Completion task, the participants were asked to list these predictions. The purpose of the VOT task is to measure the time it takes to process the target word, in order to examine the extent to which processing is facilitated by the word’s predictability. According to prediction-based processing models, the target will be easier to recognize and process when it consists of a word that the participant expected than when it consists of an unexpected word.
As the three groups differ in experience in the domain of job hunting, participants’ experiences with these collocations resemble their fellow group members’ experiences more than those of the other groups. Consequently, we expect to see on the job ad stimuli that the variation across groups in expectations is larger than the variation within groups. As the groups do not differ systematically in experience with word sequences characteristic of news reports, we expect variation across participants on these stimuli, but no systematic differences between the groups.
Subsequently, we examine to what extent processing speed in the VOT task correlates with participants’ expectations as expressed in the Completion task. The VOT task yields insight into the degree to which the recognition and pronunciation of the final word of a collocation is influenced not only by the word’s own characteristics (i.e., word length and word frequency), but also by the preceding words and the expectations they evoke. By relating the voice onset times to the participant’s responses on the Completion task, we can investigate, for each participant individually, how a word’s contextual expectedness affects processing load. Various studies indicate that word predictability has an effect on reading times, above and beyond the effect of word frequency, possibly even prevailing over word frequency effects (Dambacher, Kliegl, Hofmann, & Jacobs, Reference Dambacher, Kliegl, Hofmann and Jacobs2006; Fernandez Monsalve et al., 2012; Rayner, Ashby, Pollatsek, & Reichle, Reference Rayner, Ashby, Pollatsek and Reichle2004; Roland et al., Reference Roland, Yun, Koenig and Mauner2012). In these studies, predictability was calculated on the basis of data from people other than the actual participants. As we determine word predictability for each participant individually, we expect our measure to be a significant predictor of processing times, over and above measures based on data from other people.
2.1. participants
122 native speakers of Dutch took part in this study. All of them had completed higher vocational or university education or were in the process of doing so. The participants belong to one of three groups. The first group, labeled Recruiters, consists of 40 people (23 female, 17 male) who were working as a recruiter, intermediary, or HR adviser at the time of the experiment. Their ages range from 22 to 64, mean age 36.0 (SD = 10.0).
The second group, Job-seekers, consists of 40 people (23 female, 17 male) who were selected on the basis of reporting to have read at least three to five job advertisements per week in the three months prior to the experiment, and who never had a job in which they had to read and/or write such ads. Their ages range from 19 to 50, mean age 33.8 (SD = 8.6).
The third group, labeled Inexperienced, consists of 42 students of Communication and Information Sciences at Tilburg University (28 female, 14 male) who participated for course credit. They were selected on the basis of reporting to have read either no job ads in the past three months, or a few but less than one per week. Furthermore, in the past three years there was not a single month in which they had read 25 job ads or more, and they never had a job in which they had to read and/or write such ads. These participants’ ages range from 18 to 26, mean age 20.2 (SD = 2.1).
2.2. stimuli
The stimuli consist of 35 word sequences characteristic of job advertisements and 35 word sequences characteristic of news reports. These word sequences were identified by using a Job ad corpus and the Twente News Corpus, and computing log-likelihood following the frequency profiling method of Rayson and Garside (Reference Rayson and Garside2000). The Job ad corpus was composed by Textkernel, a company specializing in information extraction, web mining and semantic searching and matching in the Human Resources sector. All the job ads retrieved in the year 2011 (slightly over 1.36 million) were compiled, yielding a corpus of 488.41 million tokens. The Twente News Corpus (TwNC) is a corpus of comparable size (460.34 million tokens), comprising a number of national Dutch newspapers, teletext subtitling and autocues of broadcast news shows, and news data downloaded from the Internet (University of Twente, Human Media Interaction n.d.).Footnote 1 By means of the frequency profiling method we identified n-grams, ranging in length from three to ten words, whose occurrence frequency is statistically higher in one corpus than another, thus appearing to be characteristic of the former (see Kilgarriff, Reference Kilgarriff2001). In order to bypass an enormous amount of irrelevant sequences such as Contract Soort Contract and _ _ _ _ _ , which occur in the headers of the job ads, we applied the criterion that a sequence had to occur at least ten times in one corpus and two times in the other.
We selected sequences that met a number of additional requirements. A string had to end in a noun and it had to be comprehensible out of context. We only included n-grams that constitute a phrase, with clear syntactic boundaries. Sequences were also chosen in such a way that in the final set of stimuli all content words occur only once.Footnote 2 Furthermore, the selected sequences were to cover a range of values on two types of corpus-based measures: sequence frequency and surprisal of the final word in the sequence. With respect to the former, we took into account the frequency with which the sequence occurs in the specialized corpus (i.e., either the Job ad corpus or the News report corpus) as well as a corpus containing generic data, meant to reflect Dutch readers’ overall experience, rather than one genre. We used a subset of the Dutch web corpus NLCOW14 (Schäfer & Bildhauer, Reference Schäfer and Bildhauer2012) as a generic corpus. The subset consisted of a random sample of 8 million sentences from NLCOW14, comprising in total 148 million words.
To obtain corpus-based surprisal estimates for the final word in the sequences, language models were trained on the generic corpus. These models were then used to determine the surprisal of the last word of the sequence (henceforth target word). Surprisal was estimated using a 7-gram modified Kneser–Ney algorithm as implemented in SRILM.Footnote 3
The resulting set of stimuli and their frequency and surprisal estimates can be found in Appendices I and II. The length of the target words, measured in number of letters, ranges from 3 to 17 (News report items M = 7.1, SD = 3.0; Job ad items M = 8.6, SD = 3.6). Word length and frequency will be included as factors in the analyses of the VOT data, as they are known to affect processing times.
2.3. procedure
The study consisted of a battery of tasks, administered in one session. Participants were tested individually in a quiet room. At the start of the session they were informed that the purpose of the study was to gain insight into forms of communication in job ads and news reports and that they would be asked to read, complement, and judge short text fragments.
First, participants took part in the Completion task in which they had to complete the stimuli of which the final word had been omitted (see Section 3.1). After that, they filled out a questionnaire regarding demographic variables (age, gender, language background) and two short attention-demanding, arithmetic distractor tasks created using the Qualtrics software program. These tasks distracted participants from the word sequences that they had encountered in the Completion task and were about to see again in the Voice Onset Time experiment. After that, the VOT experiment started. In this task, participants were shown an incomplete stimulus (i.e., the last word was omitted), and then they saw the final word. They read aloud this target word as quickly as possible (see Section 4.1 for more details).
The Completion task and the VOT task were administered using E-Prime 2.0 (Psychology Software Tools Inc., Pittsburgh, PA), running on a Windows computer. To record participants’ responses, they were fitted with a head-mounted microphone.
3. Experiment 1: completion task
3.1. method
3.1.1. Materials
The set of stimulus materials comprised 70 cues, divided over two Itemtypes: 35 Job ad cues (see Appendix III) and 35 News report cues (see Appendix IV). A cue consists of a test item in which the last word is replaced with three dots (e.g., goede contactuele … ‘good communication …’). The stimuli were presented in a random order that was the same for all participants, to ensure that any differences between participants’ responses are not caused by differences in stimulus order.
3.1.2. Procedure
Participants were informed that they were about to see a series of short text fragments. They were instructed to read them out loud and complete them by naming all appropriate complements that immediately come to mind. For this, they were given five seconds per trial. It was emphasized that there is no one correct answer. In order to reduce the risk of chaining (i.e., responding with associations based on a previous response rather than responding to the cue; see De Deyne & Storms, Reference De Deyne and Storms2008; McEvoy & Nelson, Reference McEvoy and Nelson1982), participants were shown three examples in which the cue was repeated in every response (e.g., cue: een kopje … ‘a cup of …’, responses: een kopje koffie, een kopje thee, een kopje suiker ‘a cup of coffee, a cup of tea, a cup of sugar’). In this way, we prompted participants to repeat the cue every time, thus minimizing the risk of chaining.
Participants practiced with five cues that ranged in the degree to which they typically select for a particular complement. They consisted of words unrelated to the experimental items (e.g., een geruite … ‘a checkered …’). The experimenter stayed in the testing room while the participant completed the practice trials, to make sure the cue was read aloud. The experimenter then left the room for the remainder of the task, which took approximately six minutes.
The first trial was initiated by a button press from the participant. The cues then appeared successively, each cue being shown for 5000 ms in the center of the screen. On each trial, the software recorded a .wav file with a five-second duration, beginning simultaneously with the presentation of the cue.
3.1.3. Scoring of responses
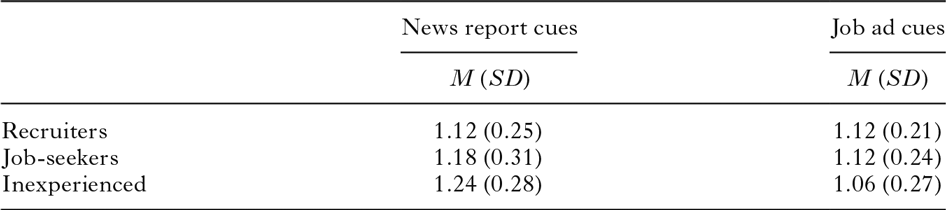
All responses were transcribed. The number of responses per cue ranged from zero to four, and varied across items and across participants. Table 1 shows the mean number of responses on the two types of stimuli for each of the groups. Mixed ANOVA shows that there is no effect of Group (F(2,119) = 0.18, p = .83), meaning that if you consider both item-types together, there are no significant differences across groups in mean number of responses. There is a main effect of Itemtype on the average number of responses (F(1,119) = 38.89, p < .001), and an interaction effect between Itemtype and Group (F(2,119) = 16.27, p < .001). Pairwise comparisons (using a Šidák adjustment for multiple comparisons) revealed that there is no significant difference between the mean number of responses on the two types of items for Recruiters (p = .951), while there is for Job-seekers (p < .01) and for Inexperienced participants (p < .001). The fact that the latter two groups listed more complements on news report items than they did on job ad items is in line with the fact that these two groups have less experience with Job ad phrases than with News report phrases. Note, however, that a higher number of responses per cue does not necessarily imply a higher degree of similarity to the complements that occur in the specialized corpora: a participant may provide multiple complements that do not occur in the corpus.
Mean number of responses participants gave per cue; standard deviations between parentheses
By means of stereotypy points (see Fitzpatrick, Playfoot, Wray, & Wright, Reference Fitzpatrick, Playfoot, Wray and Wright2015) we quantified how similar each participant’s responses are to the complements observed in the specialized corpora. The nominal complements that occurred in the corpus in question were assigned percentages that reflect the relative frequency.Footnote 4 The sequence 40 uur per ‘40 hours per’, for example, was always followed by the word week ‘week’ in the Job ad corpus. Therefore, the response week was awarded 100 points; all other responses received zero points. In contrast, the sequence kennis en ‘knowledge and’ took seventy-three different nouns as continuations, a few of them occurring relatively often, and most occurring just a couple of times. Each response thus received a corresponding amount of points. For each stimulus, the points obtained by a participant were summed, yielding a stereotypy score ranging from 0 to 100.Footnote 5
3.1.4. Statistical analyses
By means of a mixed-effects logistic regression model (Jaeger, Reference Jaeger2008), we investigated whether there are significant differences across groups of participants and sets of stimuli in the proportion of responses that correspond to a complement observed in the specialized corpora. Mixed-models obviate the necessity of prior averaging over participants and/or items, enabling the researcher to model random subject and item effects (Jaeger Reference Jaeger2008). Appendix V describes our implementation of this statistical technique.
3.2. results
For each stimulus, participants obtained a stereotypy score that quantifies how similar their responses are to the complements observed in the specialized corpora. Table 2 presents the average scores of each of the groups on the two types of stimuli.
Mean stereotypy scores (on a 0–100 scale); standard deviations between parentheses
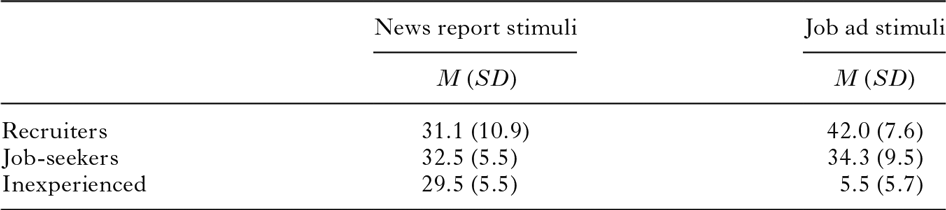
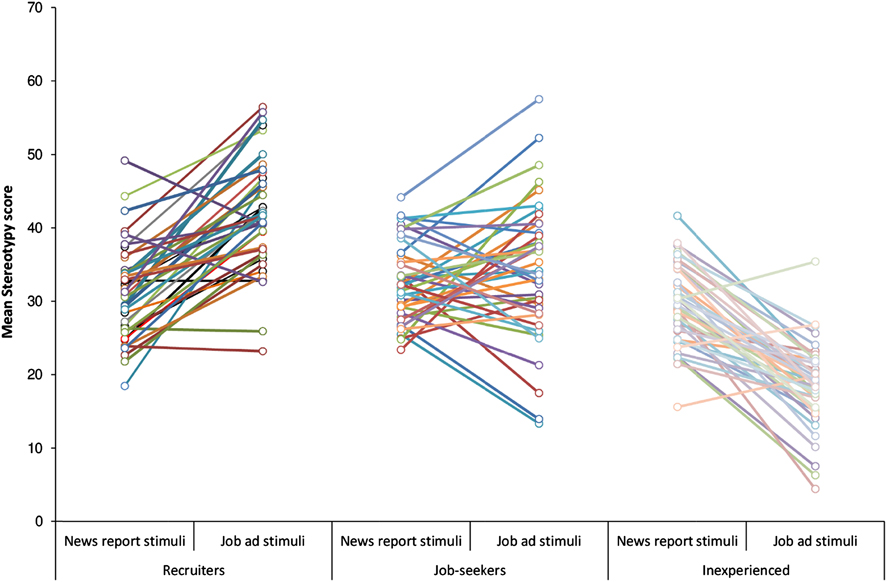
The average scores in Table 2 mask variation across participants within each of the groups (as indicated by the standard deviations) and variation across items within each of the two sets of stimuli. Figure 1 visualizes for each participant the mean stereotypy score on News report items and the mean stereotypy score on Job ad items. It thus sketches the extent to which scores on the two item types differ, as well as the extent to which participants within a group differ from each other. Figure 2 portrays these differences in another manner; it visualizes for each participant the difference in stereotypy scores on the two types of stimuli. The majority of the Recruiters obtained a higher stereotypy score on Job ad stimuli than on News report stimuli, as evidenced by the Recruiters’ marks above the zero line. For the vast majority of the Inexperienced participants it is exactly the other way around: their marks are predominantly located below zero. The Job-seekers show a more varied pattern, with some participants scoring higher on Job ad items, some scoring higher on News report items, and some showing hardly any difference between their scores on the two sets of items.
Mean stereotypy score on the two types of stimuli for each individual participant.
The difference between the mean stereotypy score on Job ad stimuli and the mean stereotypy score on News report stimuli for each individual participant; black bars show each group’s mean difference. A circle below zero indicates that that participant obtained higher stereotypy scores on News report stimuli than on Job ad stimuli.

What the figures do not show is the degree of variation across items within each of the two sets of stimuli. The majority of the Recruiters obtained a higher mean stereotypy score on Job ad items than on News report items. Nevertheless, there are several Job ad items on which nearly all Recruiters scored zero (see Appendix III; a group’s average stereotypy score of < 10.0 indicates that most group members received zero points on that item) and News report items on which nearly all of them scored 100 (see Appendix IV; Recruiters’ average scores > 90.0).
By means of a mixed logit-model, we investigated whether there are significant differences between groups and/or item types in the proportion of responses that correspond to a complement observed in the specialized corpora, while taking into account variation across items and participants. The model (summarized in Appendix V) yielded four main findings.
First, we compared the groups’ performance on News report stimuli. The model showed that there are no significant differences between groups in the proportion of responses that correspond to a complement in the Twente News Corpus. On the Job ad stimuli, by contrast, all groups differ significantly from each other. The Recruiters have a significantly higher proportion of responses to the Job ad stimuli that match a complement in the Job ad corpus than the Jobseekers (β = –0.69, SE = 0.17, 99% CI: [–0.11, –0.26]). The Job-seekers, in turn, have a significantly higher proportion of responses to the Job ad stimuli that correspond to a complement in the Job ad corpus than the Inexperienced participants (β = –1.69, SE = 0.25, 99% CI: [–2.34, –1.04]).
Subsequently, we examined whether participants’ performance on the Job ad stimuli differed from their performance on the News report stimuli. The mixed logit-model revealed that when variation across items and variation across participants are taken into account, the difference in performance on the two types of items does not prove to be significant for any group. However, there were significant interactions. For the Recruiters, the proportion of responses that correspond to a complement in the specialized corpus is slightly higher on the Job ad items than on the News report items, while for the Job-seekers it is the other way around. In this respect, these two groups differ significantly from each other (β = 0.91, SE = 0.21, 99% CI: [0.36, 1.46]). For the Inexperienced participants, the proportion of responses that correspond to a complement in the specialized corpus is much higher on the News report items than on the Job ad items. As such, the Inexperienced participants differ significantly from both the Job-seekers (β = 1.23, SE = 0.32, 99% CI: [0.38, 2.07]) and the Recruiters (β = 2.14, SE = 0.38, 99% CI: [1.15, 3.09]).
3.3. discussion
In this Completion task, we investigated participants’ knowledge of various multiword units that typically occur in either news reports or job ads. Participants named the complements that came to mind when reading a cue, and we analyzed to what extent their expectations correspond to the words’ co-occurrence patterns in corpus data.
In all three groups, and in both stimulus sets, there is variation across participants and across items in the extent to which responses correspond to corpus data. Still, there is a clear pattern to be observed. On the News Report items, the groups do not differ significantly from each other in the proportion of responses that correspond to a complement observed in the Twente News Corpus. On the Job ad stimuli, by contrast, all groups differ significantly. The Recruiters’ responses correspond significantly more often to complements observed in the Job ad corpus than the Job-seekers’ responses. The Job-seekers’ responses, in turn, correspond significantly more often to a complement in the Job ad corpus than the responses of the Inexperienced participants.
The results indicate that there are differences in participants’ knowledge of multiword units which are related to their degree of experience with these word sequences. This knowledge is the basis for prediction-based processing. Participants’ expectations about upcoming linguistic elements, expressed by them in the Completion task, are said to affect the effort it takes to process the subsequent input. That is, the subsequent input will be easier to recognize and process when it consists of a word that the participant expected than when it consists of an unexpected word. We investigated whether the data on individual participants’ expectations, gathered in the Completion task, are a good predictor of processing speed. In a follow-up Voice Onset Time experiment, we presented the cues once again, together with a complement selected by us. Participants were asked to read aloud this target word as quickly as possible. In some cases, this target word had been mentioned by them in the Completion task; in other cases, it had not. Participants were expected to process the target word faster – as evidenced by faster voice onset times – if they had mentioned it themselves than if they had not mentioned it.
4. Experiment 2: Voice Onset Time task
4.1. method
4.1.1. Materials
The set of stimuli comprised the same 70 experimental items as the Completion task (35 Job ad word sequences and 35 News report word sequences, described in Section 2.2) plus 17 filler items. The fillers were of the same type as the experimental items (i.e., (preposition) (article) adjective noun) and consisted of words unrelated to these items (e.g., het prachtige uitzicht ‘the beautiful view’). The stimuli were randomized once. The presentation order was the same for all participants, to ensure that any differences between participants’ responses are not caused by differences in stimulus order.
4.1.2. Procedure
Each trial began with a fixation mark presented in the center of the screen for a duration ranging from 1200 to 3200 ms (the duration was varied to prevent participants from getting into a fixed rhythm). Then the cue words appeared at the center of the monitor for 1400 ms. A blank screen followed for 750 ms. Subsequently, the target word was presented in blue font in the center of the screen for 1500 ms. Participants were instructed to pronounce the blue word as quickly and accurately as possible. 1500 ms after onset of the target word, a fixation point appeared, marking the start of a new trial.
Participants practiced with eight items meant to range in the degree to which the cue typically selects for a particular complement and in the surprisal of the target word. The practice items consisted of words unrelated to the experimental items (e.g., cue: een hart van ‘a heart of’, target: steen ‘stone’). The experimenter remained in the testing room while the participant completed the practice trials, to make sure the cue words were not read aloud, as the pronunciation might overlap with the presentation of the target word. The experimenter then left the room for the remainder of the task, which took approximately nine minutes.
The first trial was initiated by a button press from the participant. The stimuli then appeared in succession. After 43 items there was a short break. The very first trial and the one following the break were filler items. On each trial, the software recorded a .wav file with a 1500 ms duration, beginning simultaneously with the presentation of the target word.
All participants performed the task individually in a quiet room. The Inexperienced group was made up of students who were tested in sound-attenuated booths at the university. The Recruiters and Job-seekers were tested in rooms that were quiet, but not as free from distractions as the booths. This appears to have influenced reaction times: the Inexperienced participants responded considerably faster than the other groups (see Section 4.2). A by-subject random intercept in the mixed-effects models accounts for structural differences across participants in reaction times.
4.1.3. Data preparation and statistical analyses
Mispronunciations were discarded (e.g., stuttering re- revolutie, naming part of the cue in addition to the target word per week, pronouncing loge ‘box’ as logé ‘guest’ or lodge ‘lodge’). This resulted in loss of 0.59% of the Job ad data and 1.48% of the News report data. Speech onsets were determined by analyzing the waveforms in Praat (Boersma & Weenink, Reference Boersma and Weenink2015; Kaiser, Reference Kaiser, Podesva and Sharma2013, p. 144).
Using linear mixed-effects models (Baayen, Davidson, & Bates, Reference Baayen, Davidson and Bates2008), we examined whether there are significant differences in VOTs across groups of participants and sets of stimuli, analogous to the analyses of the Completion task data. We then investigated to what extent the voice onset times can be predicted by characteristics of the individual items and participants. Our main interest is to examine the relationship between VOTs and three different measures of word predictability. In order to assess this relationship properly, we should take into account possible effects of word length, word frequency, and presentation order, since these factors may influence VOTs. Therefore, we included three sets of factors. The first set concerns features of the target word, regardless of the cue, that are known to affect naming times: the length of the target word and its lemma frequency. The second set relates to artifacts of our experimental design: presentation order and block. The third set consists of the factors of interest to our research question: three different operationalizations of word predictability. The predictor variables are discussed in more detail successively. The details of the modeling procedure are described in Appendix VI.
Wordlength Longer words take longer to read (e.g., Balota et al., Reference Balota, Cortese, Sergent-Marshall, Spieler and Yap2004; Kliegl, Grabner, Rolfs, & Engbert, Reference Kliegl, Grabner, Rolfs and Engbert2004). Performance on naming tasks has been shown to correlate more with numbers of letters than number of phonemes (Ferrand et al., Reference Ferrand, Brysbaert, Keuleers, New, Bonin, Méot, Augustinova and Pallier2011) or number of syllables (Forster & Chambers, Reference Forster and Chambers1973). Therefore, we included length in letters of the target word as a predictor.
rLogFreq Word frequency has been shown to affect reading and naming times (Connine, Mullennix, Shernoff, & Yelen, Reference Connine, Mullennix, Shernoff and Yelen1990; Forster & Chambers, Reference Forster and Chambers1973; Kirsner, Reference Kirsner and Ellis1994; McDonald & Shillcock, Reference McDonald and Shillcock2003; Roland et al., Reference Roland, Yun, Koenig and Mauner2012). It is a proxy for a word’s familiarity and probability of occurrence without regard to context. We determined the frequency with which the target words (lemma search) occur in the generic corpus. This corpus comprised a wide range of texts, so as to reflect Dutch readers’ overall experience, rather than one genre. The frequency counts were log-transformed. Word length and word frequency were correlated (r = –0.46), as was to be expected. Frequent words tend to have shorter linguistic forms (Zipf, Reference Zipf1935). We residualized word frequency against word length, thus removing the collinearity from the model. The resulting predictor rLogFreq can be used to trace the influence of word frequency on VOTs once word length is taken into account.
PresentationOrder As was reported in the Materials section, the stimuli were presented in a fixed order, the same for all participants. We examined whether there were effects of presentation order (e.g., shorter response times in the course of the experiment because of familiarization with the procedure, or longer response times because of fatigue or boredom), and whether any of the other predictors entered into interaction with PresentationOrder.
Block The experiment consisted of two blocks of stimuli. Between the blocks there was a short break. We checked whether there was an effect of Block.
Various studies indicate that word predictability has an effect on reading and naming times (Fernandez Monsalve et al., Reference Fernandez Monsalve, Frank and Vigliocco2012; McDonald & Shillcock, Reference McDonald and Shillcock2003; Rayner et al., Reference Rayner, Ashby, Pollatsek and Reichle2004; Roland et al., Reference Roland, Yun, Koenig and Mauner2012; Traxler & Foss, Reference Traxler and Foss2000). Word predictability is commonly expressed by means of corpus-based surprisal estimates or cloze probabilities, using amalgamated data from different people; hardly ever is it determined for participants individually. In our analyses, we compare the following three operationalizations:
GenericSurprisal The surprisal of the target word given the cue, estimated by language models trained on the generic corpus meant to reflect Dutch readers’ overall experience (see Section 2.2 for more details).Footnote 6
ClozeProbability The percentage of participants who complemented the cue in the Completion task preceding the VOT task with the target word. We allowed for small variations, provided that the words shared their morphological stem with the target (e.g., info – informatie).
TargetMentioned A binary variable that expresses for each participant individually whether or not a target word was expected to occur. For each stimulus, we assessed whether the target had been mentioned by a participant in the Completion task. Again, we allowed for small variations, provided that the words shared their stem with the target.
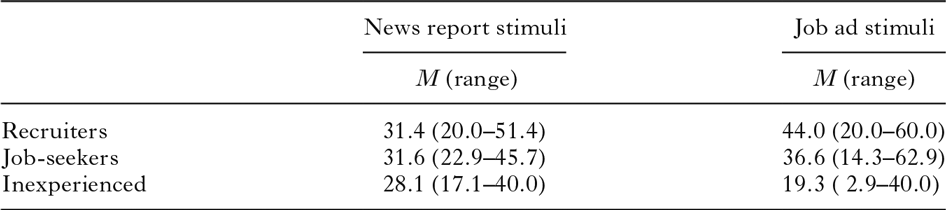
To give an idea of the number of times the target words were listed in the Completion task, Table 3 presents the mean percentage of target words mentioned by the participants in each of the groups.
Mean percentage of targets words that had been mentioned by the participants in the Completion task; range between parentheses
Finally, we included interactions between rLogFreq and measures of word predictability, as the frequency effect may be weakened, or even absent, when the target is more predictable (Roland et al., Reference Roland, Yun, Koenig and Mauner2012).
4.2. results
Table 4 presents for each group the mean voice onset time per item type. The Inexperienced participants were generally faster than the other groups, on both types of stimuli. This is likely due to factors irrelevant to our research questions: differences in experimental setting, in experience with participating in experiments, and in age. By-subject random intercepts account for such differences.Footnote 7 Of interest to us is the way the VOTs on the two types of items relate to each other, and the extent to which the VOTs can be predicted by measures of word predictability. These topics are discussed successively.
Mean Voice Onset Times in seconds; standard deviations between parentheses
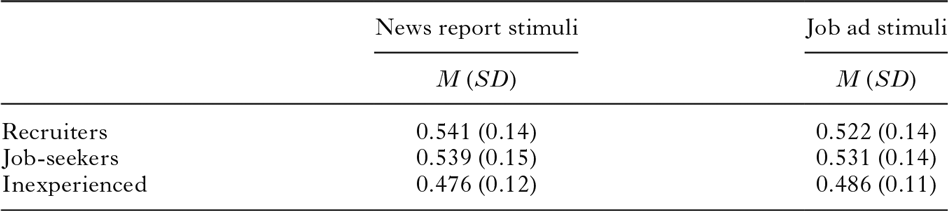
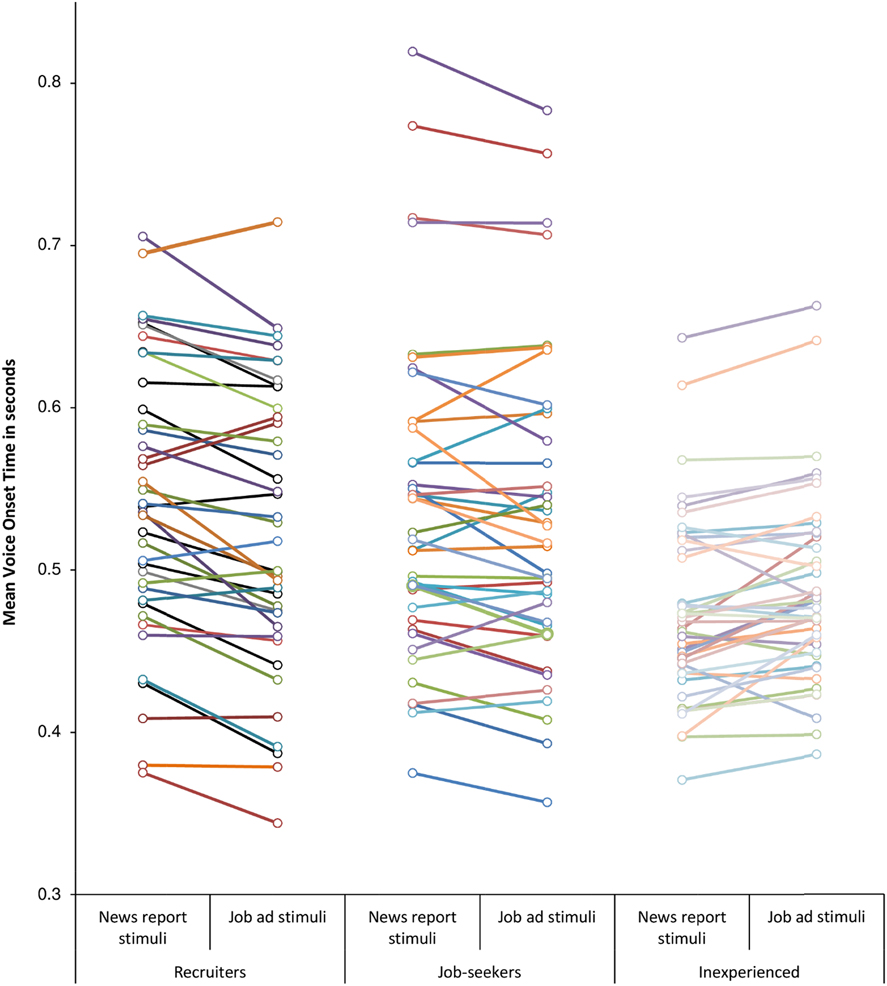
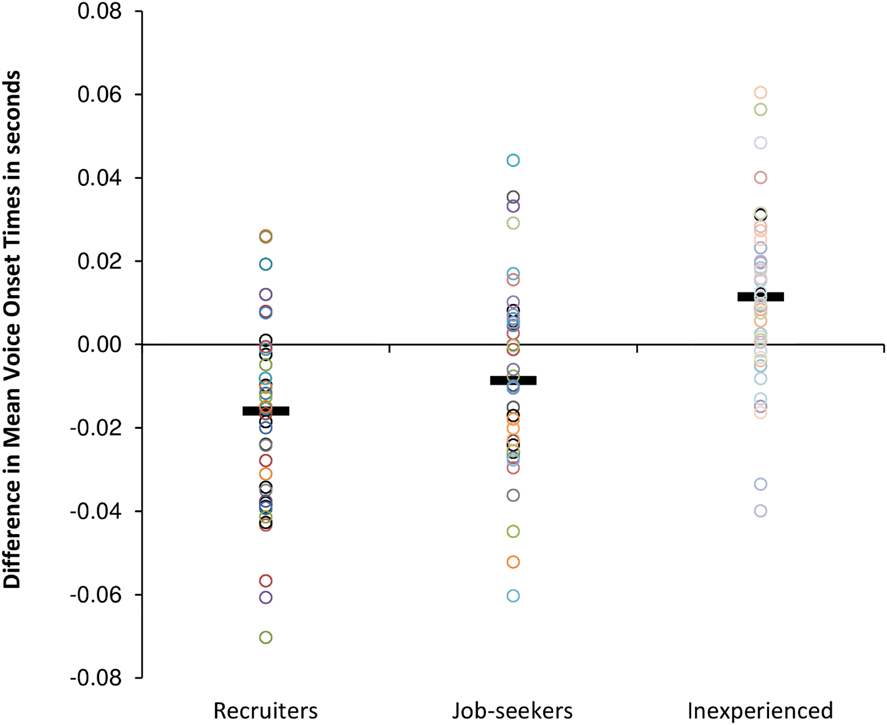
Table 4 shows that, on average, the Inexperienced participants responded faster to the News report stimuli than to the Job ad stimuli, while for the other groups it is just the other way around. Figures 3 and 4 visualize the pattern between the VOTs on the two types of items for each participant individually. For 80% of the Recruiters, the difference in mean VOTs on the two types of stimuli is negative, meaning that they were slightly faster to respond to Job ad stimuli than to News report stimuli. For 62.5% of the Job-seekers and 23.8% of the Inexperienced participants the difference score is below zero. Mixed-effects models fitted to the voice onset times (summarized in Table 4 and in Figures 3 and 4) revealed that the Inexperienced participants’ data pattern is significantly different from the Recruiters’ (β = –0.030, SE = 0.007, 99% CI: [–0.048, –0.011]) and the Job-seekers’ (β = –0.019, SE = 0.005, 99% CI: [–0.034, –0.004]). That is, the fact that the Inexperienced participants tended to be faster on the News report items than on the Job ad items makes them differ significantly from both the Recruiters and the Job-seekers (see Appendix VI for more details).
Mean Voice Onset Time on the two types of stimuli for each individual participant.
The difference between the mean VOT on Job ad stimuli and the mean VOT on News report stimuli for each individual participant; black bars show each group’s mean difference. A circle below zero indicates that that participant responded faster on Job ad stimuli than on News report stimuli.
What Figures 3 and 4 do not show is the degree of variation in VOTs across items within each of the two sets of stimuli. Every mark in Figure 3 averages over 35 items that differ from each other in word length, word frequency, and word predictability. By means of mixed-effects models, we examined to what extent these variables predict voice onset times, and whether there are effects of presentation order and block. We incrementally added predictors and assessed by means of likelihood ratio tests whether or not they significantly contributed to explaining variance in voice onset times. A detailed description of this model selection procedure can be found in Appendix VI. The main outcomes are that the experimental design variable block and the interaction term PresentationOrder x block did not contribute to the fit of the model. The stimulus-related variables Wordlength and rLogFreq did contribute. As for the word predictability measures, GenericSurprisal did not improve model fit, but ClozeProbability and TargetMentioned did. While the interaction between rLogFreq and ClozeProbability did not contribute to the fit of the model, the interaction between rLogFreq and TargetMentioned did. None of the interactions of PresentationOrder and the other variables was found to improve goodness-of-fit. The resulting model is summarized in Table 5. The variance explained by this model is 60% (R2m = .15, R2c = .60).Footnote 8
Generalized linear mixed-effects model (family: Gaussian) fitted to the voice onset times, using ‘Target not mentioned’ as the reference condition
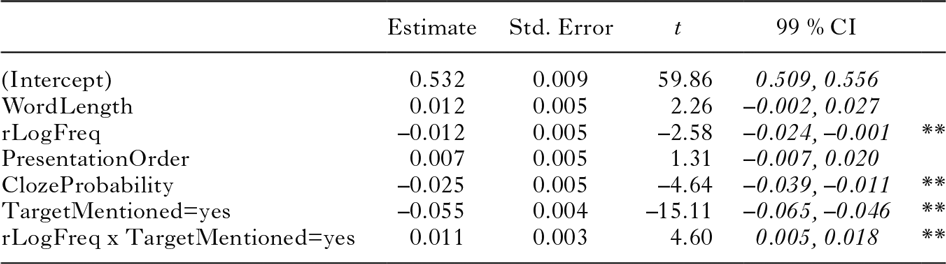
note: significance code: 0.01 ‘**’.
Table 5 presents the outcomes when Target not mentioned is used as the reference condition. The intercept here represents the mean voice onset time when the target had not been mentioned by participants and all of the other predictors take their average value. A predictor’s estimated coefficient indicates the change in voice onset times associated with every unit increase in that predictor. The estimated coefficient of rLogFreq, for instance, indicates that, when the target had not been mentioned and all other predictors take their average value, for every unit increase in residualized log frequency, voice onset times are 12 milliseconds faster.
The model shows that ClozeProbability significantly predicted voice onset times: target words with higher cloze probabilities were named faster. In addition to that, there is an effect of TargetMentioned. When participants had mentioned the target word themselves in the Completion task, they responded significantly faster than when they had not mentioned the target word (i.e., –0.055).
Lemma frequency (rLogFreq) proved to have an effect when the targets had not been mentioned. When participants had not mentioned the target words in the Completion task, higher-frequency words elicited faster responses than lower-frequency words. When the targets had been mentioned, by contrast, word frequency had no effect on VOTs (B = –0.001; SE = 0.005; t = –0.13; 99% CI = –0.014, 0.012).
Finally, the model shows that while longer words took a bit longer to read, the influence of word length was not pronounced enough to be significant. Presentation order did not have an effect either, indicating that there are no systematic effects of habituation or boredom on response times.
The effects of word frequency (rLogFreq) and TargetMentioned, and the interaction, are visualized in Figure 5. All along the frequency range, VOTs were significantly faster when the target had been mentioned by the participants in the preceding Completion task. The effect of TargetMentioned is more pronounced for lower-frequency items (the distance between the ‘Target not mentioned’ and the ‘Target mentioned’ line being larger on the left side than on the right side).
Scatterplot of the log-transformed corpus frequency of the target word (lemma), residualized against word length, and the Voice Onset Times, split up according to whether or not the target word had been mentioned by a participant in the preceding Completion task. Each circle represents one observation; the lines represent linear regression lines with a 95% confidence interval around it.
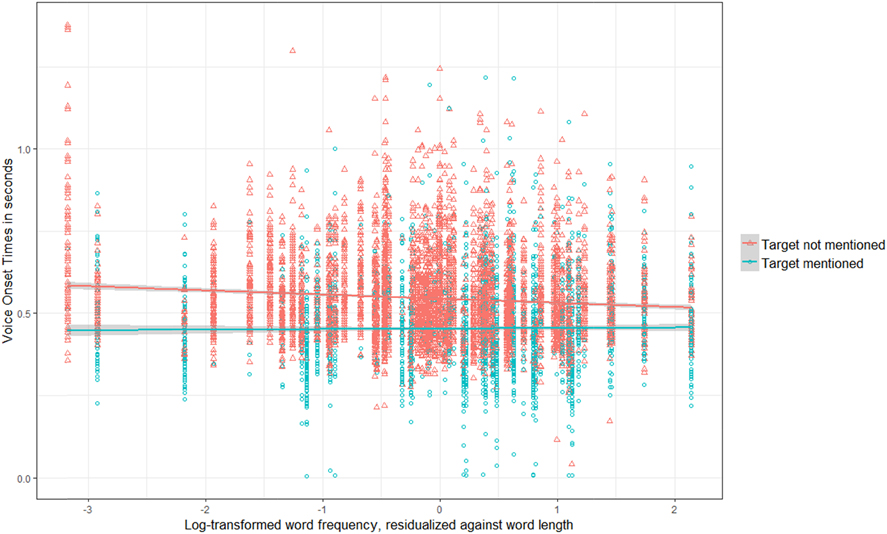
When the targets had not been mentioned, lemma frequency has an effect on VOTs, with more frequent words being responded to faster, as indicated by the descending ‘Target not mentioned’ line. The effect of frequency is significantly different when the target had been mentioned by participants. In those cases, frequency had no impact.
4.3. discussion
By means of the Voice Onset Time task, we measured the speed with which participants processed a target word following a given cue. Our analyses revealed that the Inexperienced participants’ data pattern was significantly different from the Recruiters’ and the Job-seekers’: the majority of the Recruiters and the Job-seekers responded faster to the Job ad items than to the News report items, while it was exactly the other way around for the vast majority of the Inexperienced participants.
In all three groups, and in both stimulus sets, there was variation across participants and across items in voice onset times. We examined to what extent this variance could be explained by different measures of word predictability, while accounting for characteristics of the target words (i.e., word length and word frequency) and the experimental design (i.e., presentation order and block). This resulted in five main findings.
First of all, GenericSurprisal, which is the surprisal of the target word given the cue estimated by language models trained on the generic corpus, did not contribute to the fit of the model. In other words, the mental lexicons of our participants could not be adequately assessed by the generic corpus data. It is quite possible that the use of another type of corpus – one that is more representative of the participants’ experiences with the word sequences at hand – could result in surprisal estimates that do prove to be a significant predictor of voice onset times. It was not our goal to assess the representativeness of different types of corpora. Studies by Fernandez Monsalve et al. (2012), Frank (Reference Frank2013), and Willems, Frank, Nijhof, Hagoort, and van den Bosch (Reference Willems, Frank, Nijhof, Hagoort and van den Bosch2016) offer insight into the ways in which corpus size and composition affect the accuracy of the language models and, consequently, the explanatory power of the surprisal estimates. Still, there may be substantial and systematic differences between corpus-based word probabilities and cloze probabilities, as Smith and Levy (Reference Smith and Levy2011) report, and cloze probabilities may be a better predictor of processing effort.
The second finding is that ClozeProbability – a measure of word predictability based on the Completion task data of all 122 participants together – significantly predicted voice onset times. Target words with higher cloze probabilities were named faster. Combined, the first and the second finding indicate that general corpus data are too coarse an information source for individual entrenchment, and that the total set of responses in a completion task from the participants themselves forms a better source of information.
Third, our variable TargetMentioned had an effect on voice onset times over and above the effect of ClozeProbability. TargetMentioned is a measure of the predictability of a target for a given participant: if a participant had mentioned this word in the Completion task, this person was known to expect it through context-sensitive prediction. Participants were significantly faster to name the target if they had mentioned it themselves in the Completion task. This operationalization of predictability differs from those in other studies in that it was determined for each participant individually, instead of being based on amalgamated data from other people. It also differs from priming effects (McNamara, Reference McNamara2005; Pickering & Ferreira, Reference Pickering and Ferreira2008), which tend to be viewed as non-targeted and rapidly decaying. In our study, participants mentioned various complements in the Completion task. Five to fifteen minutes later (depending on a stimulus’s order of presentation in each of the two tasks), the target words were presented in the VOT task. These targets were identical, related, or unrelated to the complements named by a participant. The effects of Completion task responses on target word processing in a reaction time task are usually not viewed as priming effects, given the relatively long time frame and the conscious and strategic nature of the activation of the words given as a response (see the discussion in Kuperberg & Jaeger, Reference Kuperberg and Jaeger2016, p. 40; also see Otten & Van Berkum’s (2008) distinction between discourse-dependent lexical anticipation and priming).
Both ClozeProbability and TargetMentioned are operationalizations of word predictability. They were found to have complementary explanatory power. ClozeProbability proved to have an effect when the target had not been mentioned by a participant, as well as when the target had been mentioned. In both cases, higher cloze probabilities yielded faster VOTs. This taps into the fact that there are differences in the degree to which the targets presented in the VOT task are expected to occur. A higher degree of expectancy will contribute to faster naming times. The binary variable TargetMentioned does not account for such gradient differences. ClozeProbability, on the other hand, may be a proxy for this; it is likely that targets with higher cloze probabilities are words that are considered more probable than targets with lower cloze probabilities.
Conversely, TargetMentioned explains variance that ClozeProbability does not account for. That is, participants were significantly faster to name the target if they had come up with this word to complete the phrase themselves approximately ten minutes earlier in the Completion task. This finding points to actual individual differences and highlights the merits of going beyond amalgamated data. The fact that a measure of a participant’s own predictions is a significant predictor of processing speed, over and above word predictability measures based on amalgamated data, had not yet been shown in lexical predictive processing research. It does fit in, more generally, with recent studies into the processing of schematic constructions in which individuals’ scores from one experiment were found to correlate with their performance on another task (e.g., Misyak & Christiansen, Reference Misyak and Christiansen2012; Misyak, Christiansen, & Tomblin, Reference Misyak, Christiansen and Tomblin2010).
The fourth main finding is that the effect of TargetMentioned on voice onset times was stronger for lower-frequency than for higher-frequency items (the distance between the ‘Target not mentioned’ and the ‘Target mentioned’ line in Figure 5 being larger on the left side than on the right side). The high-frequency target words may be so familiar to the participants that they can process them quickly, regardless of whether or not they had pre-activated them. The processing of low-frequency items, on the other hand, clearly benefits from predictive pre-activation.
Fifth, corpus-based word frequency had no effect on VOTs when the target had been mentioned in the Completion task (i.e., t = 0.13 for rLogFreq; the ‘Target mentioned’ line in Figure 5 is virtually flat). In other words, predictive pre-activation facilitates processing to such an extent that word frequency no longer affects naming latency. When participants had not mentioned the target words in the Completion task, higher-frequency words elicited faster responses than lower-frequency words (in Table 5 rLogFreq is significant (t = –2.58); the ‘Target not mentioned’ line in Figure 5 descends).
5. General discussion
Our findings lead to three conclusions. First, there is usage-based variation in the predictions people generate: differences in experiences with a particular register result in different expectations regarding word sequences characteristic of that register, thus pointing to differences in mental representations of language. Second, it is advisable to derive predictability estimates from data obtained from language users closely related to the people participating in the reaction time experiment (i.e., using data from either the participants themselves, or a representative sample of the population in question). Such estimates form a more accurate predictor of processing times than predictability measures based on generic data. Third, we have shown that it is worthwhile to zoom in at the level of individual participants, as an individual’s responses in a completion task form a significant predictor of processing times over and above group-based cloze probabilities.
These findings point to a continuity with respect to observations in language acquisition research: the significance of individual differences and the merits of going beyond amalgamated data that have been shown in child language processing, are also observed in adults. Furthermore, our findings are fully in line with theories on context-sensitive prediction in language processing, which hold that predictions are based on one’s own prior experiences. Yet in practice, work on predictive processing has paid little attention to variation across speakers in experiences and expectations. Studies investigating the relationship between word predictability and processing speed have always operationalized predictability by means of corpus data or experimental data from people other than those taking part in the reaction time experiments. We empirically demonstrated that such predictability estimates cannot be truly representative for those participants, since people differ from each other in their linguistic experiences and, consequently, in the predictions they generate. While usage-based principles of variation are endorsed more and more (e.g., Barlow & Kemmer, Reference Barlow and Kemmer2000; Bybee, Reference Bybee2010; Croft, Reference Croft2000; Goldberg, Reference Goldberg2006; Kristiansen & Dirven, Reference Kristiansen and Dirven2008; Schmid, Reference Schmid2015; Tomasello, Reference Tomasello2003), often the methodological implications of a usage-based approach are not fully put into practice. In this paper, we show that there is meaningful variation to be detected in prediction and processing, and we demonstrate that it is both feasible and worthwhile to attend to such variation.
We examined variation in experience, predictions, and processing speed by making use of two sets of stimuli, three groups of speakers, and two experimental tasks. Our stimuli consisted of word sequences that typically occur in the domain of job hunting, and word sequences that are characteristic of news reports. The three groups of speakers – viz. recruiters, job-seekers, and people not (yet) looking for a job – differed in experience in the domain of job hunting, while they did not differ systematically in experience with the news report register. All participants took part in two tasks that tap into prediction-based processing. The Completion task yielded insight into what participants expect to occur given a particular sequence of words and their previous experiences with such elements. In the Voice Onset Time task we measured the speed with which a specific complement was processed, and we examined the extent to which this is influenced by its predictability for a given participant.
The data from the Completion task confirmed our hypotheses regarding the variation within and across groups in the predictions participants generate. On the News Report items, the groups did not differ significantly from each other in how likely participants were to name responses that correspond to the complements observed in the Twente News Corpus. On the Job ad stimuli, by contrast, all groups differed significantly from each other. The Recruiters’ responses corresponded significantly more often to complements observed in the Job ad corpus than the Job-seekers’ responses. The Job-seekers’ responses, in turn, corresponded significantly more often to a complement in the Job ad corpus than the responses of the Inexperienced participants. The responses thus reveal differences in participants’ knowledge of multiword units which are related to their degree of experience with these word sequences.
We then investigated to what extent a participant’s own expectations influence the speed with which a specific complement is processed. If the responses in the Completion task are an accurate reflection of participants’ expectations, and if prediction-based processing models are correct in stating that expectations affect the effort it takes to process subsequent input, then it should take participants less time to process words they had mentioned themselves than words they had not listed. Indeed, whether or not participants had mentioned the target significantly affected voice onset times. What is more, this predictive pre-activation, as captured by the variable TargetMentioned, was found to facilitate processing to such an extent that word frequency could not exert any additional accelerating influence. When participants had mentioned the target word in the Completion task, there was no effect of word frequency. This demonstrates the impact of context-sensitive prediction on subsequent processing.
The facilitating effect of expectation-based preparatory activation was strongest for lower-frequency items. This has been observed before, not just with respect to the processing of lexical items (Dambacher et al., Reference Dambacher, Kliegl, Hofmann and Jacobs2006; Rayner et al., Reference Rayner, Ashby, Pollatsek and Reichle2004), but also for other types of constructions (e.g., Wells et al., Reference Wells, Christiansen, Race, Acheson and MacDonald2009). It shows that we cannot make general claims about the strength of the effect of predictability on processing speed, as it is modulated by frequency.
Perhaps even more interesting is that the variable TargetMentioned had an effect on voice onset times over and above the effect of ClozeProbability. Participants were significantly faster to name the target if they had mentioned it themselves in the Completion task. This shows the importance of going beyond amalgamated data. While this may not come across as surprising, it is seldomly shown or exploited in research on prediction-based processing. Even with a simple binary measure like TargetMentioned, we see that data elicited from an individual participant constitute a powerful predictor for that person’s reaction times. If one were to develop it into a measure that captures gradient differences in word predictability for each participant individually, it might be even more powerful.
Our study has focused on the processing of multiword units. Few linguists will deny there is individual variation in vocabulary inventories. In a usage-based approach to language learning and processing, there is no reason to assume that individual differences are restricted to concrete chunks such as words and phrases. One interesting next step, then, is to investigate to what extent similar differences can be observed for partially schematic or abstract patterns. Some of these constructions (e.g., highly frequent patterns such as transitives) might be expected to show smaller differences, as exposure differs less substantially from person to person. However, recent studies point to individual differences in representations and processing of constructions that were commonly assumed to be shared by all adult native speakers of English (see Kemp, Mitchell, and Bryant, Reference Kemp, Mitchell and Bryant2017, on the use of spelling rules for plural nouns and third-person singular present verbs in pseudo-words; Street and Dąbrowska, Reference Street and Dąbrowska2010, 2014, on passives and quantifiers). Our experimental set-up, which includes multiples tasks executed by the same participants, can also be used to investigate individual variation in processing abstract patterns and constructions.
In conclusion, the results of this study demonstrate the importance of paying attention to usage-based variation in research design and analyses – a methodological refinement that follows from theoretical underpinnings and, in turn, will contribute to a better understanding of language processing and linguistic representations. Not only do groups of speakers differ significantly in their behavior, an individual’s performance in one experiment is shown to have unique additional explanatory power regarding performance in another experiment. This is in line with a conceptualization of language and linguistic representations as inherently dynamic. Variation is ubiquitous, but, crucially, not random. The task that we face when we want to arrive at accurate theories of linguistic representation and processing is to define the factors that determine the degrees of variation between individuals, and this requires going beyond amalgamated data.
Appendix I
Job ad word sequences and corpus-based frequencies and surprisal estimates
The Job ad word sequences; base-10 logarithm of the frequency of occurrence per million words in the Job ad corpus and the NLCOW14-subset for the phrase as a whole and for the final word (lemma search); the surprisal of the final word based on data in NLCOW14-subset.

Appendix II
News report word sequences and corpus-based frequencies and surprisal estimates
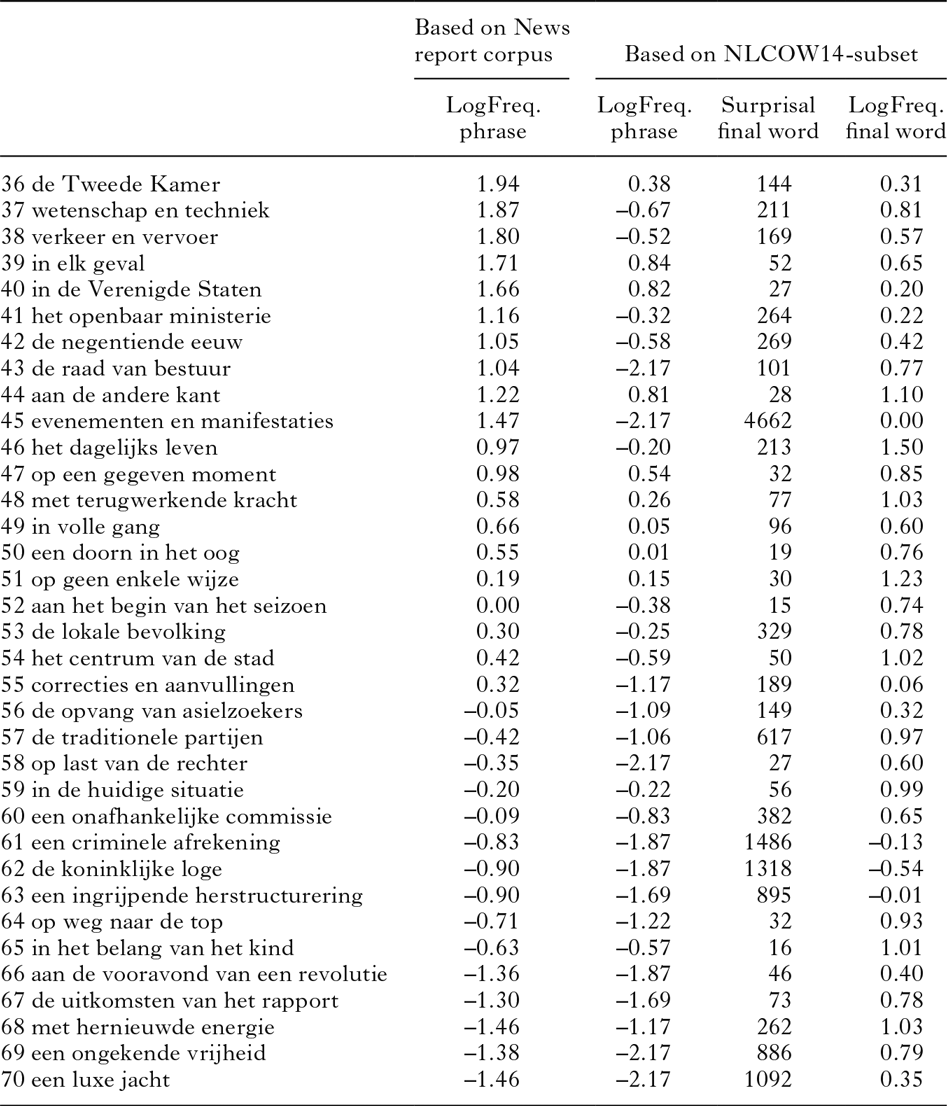
The News report word sequences; base-10 logarithm of the frequency of occurrence per million words in the Twente News Corpus and the NLCOW14-subset for the phrase as a whole and for the final word (lemma search); the surprisal of the final word based on data in NLCOW14-subset.
Appendix III
Average Stereotypy Scores for the Job ad stimuli

Appendix IV
Average Stereotypy Scores for the News report stimuli

Appendix V
Mixed-effects logistic regression model fitted to the Completion task data
The stereotypy scores were not normally distributed. Therefore, it was not justified to fit a linear mixed-effects model. We used a mixed-effects logistic regression model (Jaeger, Reference Jaeger2008) instead. Per response, we indicated whether or not it corresponded to a complement observed in the specialized corpora. By means of a mixed logit-model, we investigated whether there are significant differences across groups of participants and/or sets of stimuli in the proportion of responses that correspond to a complement in the specialized corpora. We fitted this model using the LMER function from the lme4 package in R (version 3.3.3; CRAN project; R Core Team, 2017). Group, Itemtype, and their interaction were included as fixed effects, and participants and items as random effects. The fixed effects were standardized. Random intercepts and random slopes for participants and items were included to account for between-subject and between-item variation.Footnote 9
A model with a full random effect structure was constructed following Barr, Levy, Scheepers, and Tily (Reference Barr, Levy, Scheepers and Tily2013). A comparison with the intercept-only model proved that the inclusion of the by-item random slope for Group and the by-participant random slope for Itemtype was justified by the data (χ2(7) = 174.83, p < .001). Confidence intervals were estimated via parametric bootstrapping over 1,000 iterations (Bates, Mächler, Bolker, & Walker, Reference Bates, Mächler, Bolker and Walker2015).
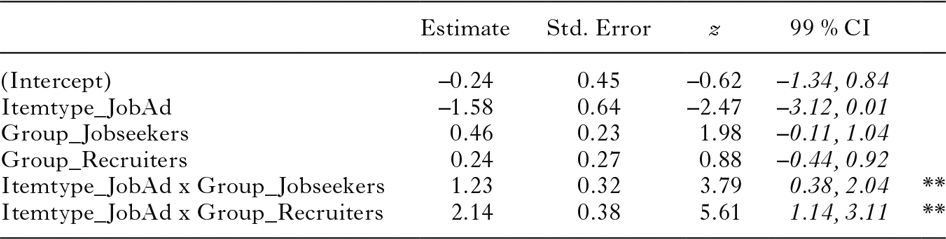
In order to obtain all relevant comparisons of the three groups and the two types of stimuli, we ran the model with different coding schemes and we report 99% confidence intervals (as opposed to the more common 95%) to correct for multiple comparisons. Since the groups were not expected to differ systematically in experience with News report word sequences, none of the groups forms a natural baseline in this respect. As for the Job ad stimuli, from a usage-based perspective, differences between Recruiters and Job-seekers are as interesting as differences between Job-seekers and Inexperienced participants, or Recruiters and Inexperienced participants. Therefore, we treatment-coded the factors, first using ‘Recruiters’ as the reference group for Group and ‘Job ad stimuli’ as the reference group for Itemtype. The resulting model is summarized in Table 6. The intercept represents the proportion of the Recruiters’ responses to the Job ad stimuli that correspond to a complement in the Job ad corpus. This proportion does not differ significantly from the proportion of their responses to the News report items that correspond to a complement in the Twente News Corpus.
Mixed-effects logistic regression model (family: binomial) fitted to the responses to the Completion task (0 = does not correspond to a complement in the specialized corpus; 1 = corresponds to a complement in the specialized corpus), using ‘Recruiters–Job ad stimuli’ as the reference condition
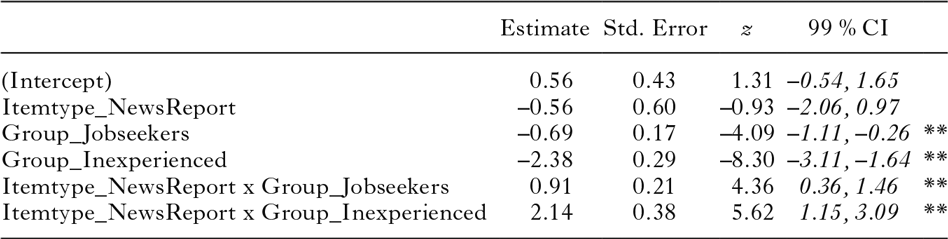
There are significant differences between the groups of participants on the Job ad stimuli. Both the Inexperienced participants and the Job-seekers have significantly lower proportions of responses to the Job ad stimuli that match a complement in the Job ad corpus than the Recruiters. The model also reveals that the difference between the proportions on the two types of stimuli is significantly different across groups.
To examine the remaining differences, we then used ‘Job-seekers–Job ad stimuli’ as the reference condition. The outcomes are summarized in Table 7. The proportion of the Job-seekers’ responses to the Job ad items that correspond to a complement in the Job ad corpus does not differ significantly from the proportion of their responses to the News report items that match a complement in the Twente News Corpus. Furthermore, the outcomes show that the Job-seekers’ responses to the Job ad stimuli were significantly more likely to correspond to a complement in the Job ad corpus than the responses of the Inexperienced participants. In addition, the model reveals that the difference between the proportions on the two types of stimuli is significantly different for the Inexperienced participants compared to the Job-seekers.
Mixed-effects logistic regression model (family: binomial) fitted to the responses to the Completion task (0 = does not correspond to a complement in the specialized corpus; 1 = corresponds to a complement in the specialized corpus), using ‘Job-seekers–Job ad stimuli’ as the reference condition
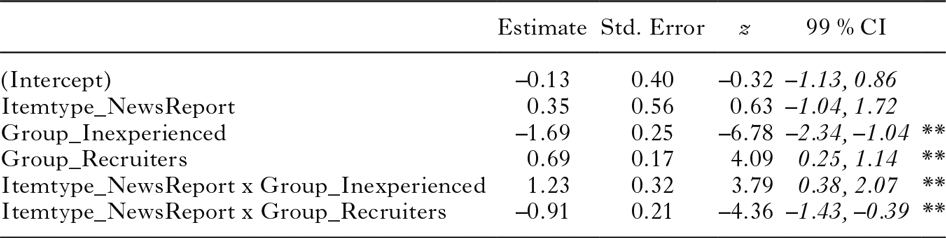
Finally, we used ‘Inexperienced-News report stimuli’ as the reference condition. The outcomes, summarized in Table 8, show that the proportion of the Inexperienced participants’ responses to the Job ad items that correspond to a complement in the specialized corpus is not significantly different from the proportion of their responses to the News report items that match a complement in the specialized corpus. They also reveal that the three groups do not differ significantly from each other in the proportion of responses to the News report stimuli that match a complement in the specialized corpus.
Mixed-effects logistic regression model (family: binomial) fitted to the responses to the Completion task (0 = does not correspond to a complement in the specialized corpus; 1 = corresponds to a complement in the specialized corpus), using ‘Inexperienced–News report stimuli’ as the reference condition
Appendix VI
Linear mixed-effects models fitted to the voice onset times (VOT task)
We fitted linear mixed-effects models (Baayen et al., Reference Baayen, Davidson and Bates2008), using the LMER function from the lme4 package in R (version 3.3.2; CRAN project; R Core Team, 2017), to the Voice Onset Times. First, we investigated whether there are significant differences in VOTs across groups of participants and/or sets of stimuli, similar to our analysis of the stereotypy scores. Subsequently, we examined to what extent the VOTs can be predicted by word length, corpus-based word frequency, presentation order, and different measures of word predictability.
In the first analysis, Group, Itemtype, and their interaction were included as fixed effects, and participants and items as random effects. The fixed effects were standardized. We included random intercepts and slopes for participants and items to account for between-subject and between-item variation.Footnote 10
A model with a full random effect structure was constructed following Barr et al. (Reference Barr, Levy, Scheepers and Tily2013). A comparison with the intercept-only model proved that the inclusion of the by-item random slope for Group and the by-participant random slope for Itemtype was justified by the data (χ 2(7) = 34.34, p < .001). The variance explained by this model is 59% (R2m = .04, R2c = .59).Footnote 11 Confidence intervals were estimated via parametric bootstrapping over 1,000 iterations (Bates et al., Reference Bates, Mächler, Bolker and Walker2015).
In order to obtain all relevant comparisons of the three groups and the two types of stimuli, we ran the model with different coding schemes and we report 99% confidence intervals to correct for multiple comparisons. We treatment-coded the factors, first using ‘Recruiters’ as the reference group for Group and ‘Job ad stimuli’ as the reference group for Itemtype. The resulting model is summarized in Table 9. The intercept represents the mean VOT of the Recruiters on the Job ad stimuli. Subsequently, we used ‘Job-seekers–Job ad stimuli’ as the reference condition (Table 10), and finally ‘Inexperienced–News report stimuli’ (Table 11).
Generalized linear mixed-effects model (family: Gaussian) fitted to the voice onset times, using ‘Recruiters–Job ad stimuli’ as the reference condition
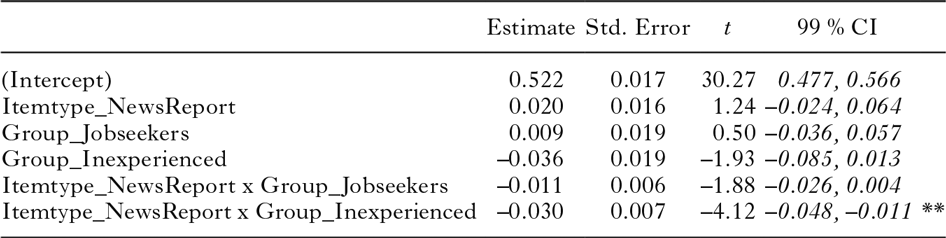
Generalized linear mixed-effects model (family: Gaussian) fitted to the voice onset times, using ‘Job-seekers–Job ad stimuli’ as the reference condition
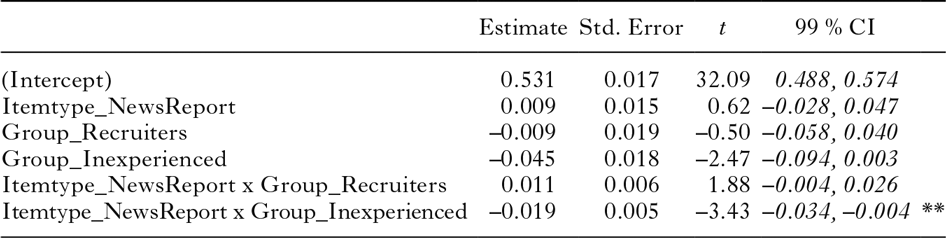
Generalized linear mixed-effects model (family: Gaussian) fitted to the voice onset times, using ‘Inexperienced–News report stimuli’ as the reference condition
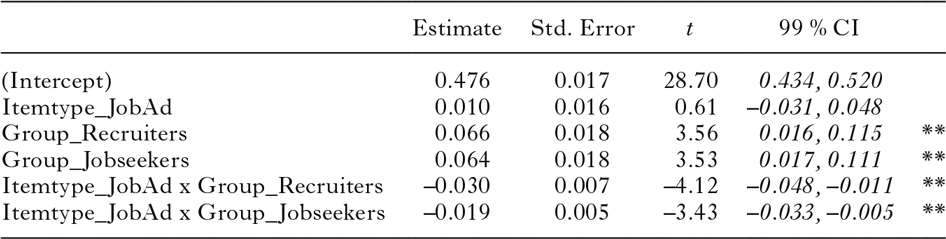
The models reveal that none of the groups shows a significant difference between VOTs on the News report items and VOTs on the Job ad items. The Inexperienced do differ significantly from the Recruiters and Job-seekers in the relationship between the two sets of items. The majority of the Recruiters and the Job-seekers responded faster to the Job ad items than to the News report items (as evidenced by the Recruiters’ and Job-seekers’ marks below the zero line in Figure 4). For the vast majority of the Inexperienced participants it is just the other way around: they were faster on the News report stimuli compared to the Job add stimuli. The mixed-effects models indicate that the Inexperienced participants’ data pattern is significantly different from the Recruiters’ and the Job-seekers’.
In the second analysis, we investigated to what extent the VOTs can be predicted by various characteristics of the target words. We included the length of the target word in letters (WordLength), and its lemma-frequency, residualized against word length (rLogFreq), as they are known to affect naming times. In addition, we examined possible effects of PresentationOrder and block, as artifacts of our experimental design. Furthermore, we investigated three different operationalizations of word predictability. GenericSurprisal is the surprisal of the target word given the cue, estimated by language models trained on the generic corpus meant to reflect Dutch readers’ overall experience. ClozeProbability amounts to the percentage of participants that complemented the cue with the target word in the Completion task preceding the VOT task. The binary variable TargetMentioned indicates whether or not the target word had been mentioned by a given participant in the Completion task. The fixed factors were standardized to reduce collinearity between predictors. Participants and items were included as random effects. We incorporated a random intercept for both items and participants to account for between-item and between-participant variation. We then added fixed effects one by one and assessed by means of likelihood ratio tests whether or not they significantly contributed to explaining variance in voice onset times.
We started with WordLength (χ 2(1) = 13.73, p < .001), followed by rLogFreq (χ 2(1) = 4.78, p < .05), and PresentationOrder (χ 2(1) = 3.97, p < .05). After that, we added block (χ 2(1) = 2.10, p = .15) and the interaction term PresentationOrder x block (χ 2(1) = 0.01, p = .93). Given that neither of the latter two improved model fit, we left out these predictors. We then proceeded with the predictability measures, starting with the most general one: GenericSurprisal. This predictor did not contribute to the fit of the model (χ 2(1) = 2.54, p = .11) and therefore we omitted it. ClozeProbability did improve model fit (χ 2(1) = 49.22, p < .001), as did TargetMentioned (χ 2(1) = 309.37, p < .001). We then included the interaction term rLogFreq x ClozeProbability, which did not contribute to the fit of the model fit (χ 2(1) = 3.60, p = .06). rLogFreq x TargetMentioned did explain a significant portion of variance (χ 2(1) = 16.75, p < .001). Finally, none of the two-way interactions of PresentationOrder and the other predictors in the model was found to improve model fit (PresentationOrder x TargetMentioned (χ 2(1) = 0.57, p = .45); PresentationOrder x ClozeProbability (χ 2(1) = 0.65, p = .42); PresentationOrder x rLogFreq (χ 2(1) = 0.21, p = .65); PresentationOrder x WordLength (χ 2(1) = 2.58, p = .11)). The model selection procedure thus resulted in a model comprising WordLength, rLogFreq, PresentationOrder, ClozeProbability, TargetMentioned, and rLogFreq x TargetMentioned.
We then added random slopes for participants. There are no by-item random slopes, because each item has only one lemma frequency, one cloze probability, one corpus-based surprisal estimate, one length, and a fixed position in the presentation order. Furthermore, there are items no one had mentioned in the Completion task, thus prohibiting by-item random slopes for TargetMentioned. Within these limits, a model with a full random effect structure was constructed following Barr et al. (Reference Barr, Levy, Scheepers and Tily2013). Subsequently, we excluded random slopes with the lowest variance step by step until a further reduction would imply a significant loss in the goodness of fit of the model (Matuschek, Kliegl, Vasishth, Baayen, & Bates, Reference Matuschek, Kliegl, Vasishth, Baayen and Bates2017). Model comparisons indicated that the inclusion of the by-participant random slopes for WordLength, PresentationOrder, ClozeProbability, and TargetMentioned was justified by the data (χ2(5) = 53.00, p < .001). Then, confidence intervals were estimated via parametric bootstrapping over 1,000 iterations (Bates et al., Reference Bates, Mächler, Bolker and Walker2015). We first ran the model using ‘Target not mentioned’ as the reference condition and then ‘Target mentioned’. The outcomes are presented in Table 5 in Section 4.2.


 Open access

