


Introduction
Archosauria (the “ruling reptiles”) is a diverse, long-lived (~250 Myr) saurian clade that dominated terrestrial, aquatic, and aerial ecosystems throughout the Mesozoic Era, and persists to the present day in the form of about 23 crocodylian and 10,000 bird species (Oaks Reference Oaks2011; Jetz et al. Reference Jetz, Thomas, Joy, Hartmann and Mooers2012). Throughout their history, archosaurs have displayed disparate body plans and divergent locomotor habits, including obligate bipedal and quadrupedal species, as well as volant, semiaquatic, and marine forms (Fig. 1). The majority of archosaurs were land dwelling, and it is well known that many important innovations related to terrestrial locomotion evolved throughout archosaur history (Bakker Reference Bakker1971; Charig Reference Charig, Joysey and Kemp1972; Parrish Reference Parrish1986; Hutchinson and Gatesy Reference Hutchinson and Gatesy2000; Hutchinson Reference Hutchinson2006; Sullivan Reference Sullivan, Dial, Shubin and Brainerd2015). Terrestrial locomotor evolution in archosaurs is also characterized by repeated instances of morphological and functional convergence, involving members of both the ornithodiran (bird-line) and pseudosuchian (crocodile-line) lineages (Walker Reference Walker1964; Parrish Reference Parrish1986; Sereno Reference Sereno1991; Carrano Reference Carrano2000; Nesbitt and Norell Reference Nesbitt and Norell2006; Bates and Schachner Reference Bates and Schachner2012; Bates et al. Reference Bates, Maidment, Allen and Barrett2012; Kubo and Kubo Reference Kubo and Kubo2012; Maidment and Barrett Reference Maidment and Barrett2012; Grinham et al. Reference Grinham, VanBuren and Norman2019).
Simplified phylogeny of Archosauria based on current consensus of interrelationships (e.g., Nesbitt Reference Nesbitt2011; Ezcurra Reference Ezcurra2016), illustrating the diversity of body forms and locomotor habits across the group. Major clades are also indicated.

Given their long evolutionary history and diverse array of body sizes and shapes, terrestrial archosaurs provide a good case study for investigating how size and gross body proportions may relate to each other and locomotor behavior. Yet extant archosaur species occupy a very select subset of the total range of observed archosaur postcranial morphologies, and concomitantly exhibit disparate locomotor patterns that almost certainly do not capture the full range of historical diversity in archosaur locomotor behavior (Hutchinson and Gatesy Reference Hutchinson and Gatesy2000; Hutchinson Reference Hutchinson2006). There is no archosaur—indeed, any animal—alive today that is of a comparable size and shape to extinct taxa like Postosuchus or Iguanodon. Although extant species may be highly useful for the development of “lower-level inferences” such as soft tissue anatomy, their utility can become increasingly uncertain for “higher-level inferences” such as locomotor function and behavior (Witmer Reference Witmer and Thomason1995; Hutchinson Reference Hutchinson2006; Bates and Falkingham Reference Bates and Falkingham2018). Thus, the usefulness of extant archosaur species as a basis for deriving broad inferences (grounded in homology or analogy) of locomotion for all extinct archosaurs is uncertain. Understanding locomotor habit in extinct archosaurs has therefore frequently relied on interpreting bony anatomy or footprints preserved in the fossil record. For instance, hoof-shaped manual unguals suggest at least some use of a quadrupedal stance (Maidment and Barrett Reference Maidment and Barrett2014), and narrow-gauge footprints left by a single pair of feet may indicate at least intermittent parasagittal bipedalism (Thulborn Reference Thulborn1990). The insights afforded by these lines of evidence can be important, but they are limited by the incompleteness of the fossil record (i.e., such evidence is only preserved for some species, and even then footprints can rarely be assigned to a known species), and perhaps more critically, they often cannot be generalized across large clades of disparate body plans.
An alternative approach to investigating locomotor patterns across a clade as morphologically diverse as Archosauria is one based on phenomena that affect all species in a universal fashion. For example, the manner of stance and gait of all archosaur species are (or were) fundamentally dictated by Newtonian mechanics, insofar as the size and proportions of any terrestrial animal greatly influence its ability to support and move its body on land. Body mass is paramount, as the mass that an animal must support against gravity increases more quickly with respect to size (e.g., length) than the cross-sectional area of supportive tissues such as muscle and bone (Alexander Reference Alexander, Hildebrand, Bramble, Liem and Wake1985; Biewener Reference Biewener1990; Vogel Reference Vogel2003; Campione and Evans Reference Campione and Evans2012). Limb size, as well as intra- and inter-limb proportions, will dictate the range of possible kinematics such as stride length and patterns of inter-limb coordination (Alexander and Jayes Reference Alexander and Jayes1983; Gatesy and Biewener Reference Gatesy and Biewener1991; Sellers et al. Reference Sellers, Manning, Lyson, Stevens and Margetts2009; Gatesy and Pollard Reference Gatesy and Pollard2011), as well as potential locomotor performance (Garland and Janis Reference Garland and Janis1993; Carrano Reference Carrano1999). The location of the whole-body center of mass (COM), which represents the collective distribution of mass throughout the body, will also exert a strong influence on posture and movements. To maintain stability, an animal must keep its COM over the “polygon of support” formed by its feet (however many) when standing (Alexander Reference Alexander2006; Winter Reference Winter2009), and this principle can be extended to dynamically stable locomotion as well (Herr and Popovic Reference Herr and Popovic2008).
Many previous studies have estimated body mass or COM in extinct archosaurs through a variety of approaches, yet these have seldom been used in a comparative context to address broad questions concerning locomotor disparity or evolution (Henderson and Snively Reference Henderson and Snively2003; Allen et al. Reference Allen, Bates, Li and Hutchinson2013; Bates et al. Reference Bates, Mannion, Falkingham, Brusatte, Hutchinson, Otero, Sellers, Sullivan, Stevens and Allen2016). Here, previously published estimates of terrestrial archosaur mass properties and body proportions are synthesized with new computational models for additional taxa, spanning five orders of magnitude in mass and almost 250 Myr of evolution. The aims of the present study were twofold: first, to investigate how different aspects of body shape and size may or may not statistically relate to each other and gross locomotor habit (here taken to mean bipedal vs. quadrupedal stance) in terrestrial Archosauria; and second, to develop a generalized and quantitative predictive framework that can be used to help assess locomotor habit in uncertain or enigmatic taxa.
Material and Methods
Computational Modeling
With the exception of the models of Rapetosaurus (Bates et al. Reference Bates, Mannion, Falkingham, Brusatte, Hutchinson, Otero, Sellers, Sullivan, Stevens and Allen2016) and Dreadnoughtus (Lacovara et al. Reference Lacovara, Lamanna, Ibiricu, Poole, Schroeter, Ullman, Voegele, Boles, Carter, Fowler, Egerton, Moyer, Coughenour, Schein, Harris, Martínez and Novas2014), it was assumed here that the models used in the core component of the present study were of adult (or near-adult) animals. Determining the ontogenetic status of many extinct archosaurs is not straightforward (Hone et al. Reference Hone, Farke and Wedel2016), but the models used consistently fell at or near the upper end of the known size range for each of the taxa studied and were therefore assumed to represent “adult” morphology. In terms of the anatomical parameters investigated (see “Parameters Investigated”) and broad comparative approach of the study, it was felt that this assumption was justified, although the extremely limited number of known specimens for some taxa renders it difficult to test.
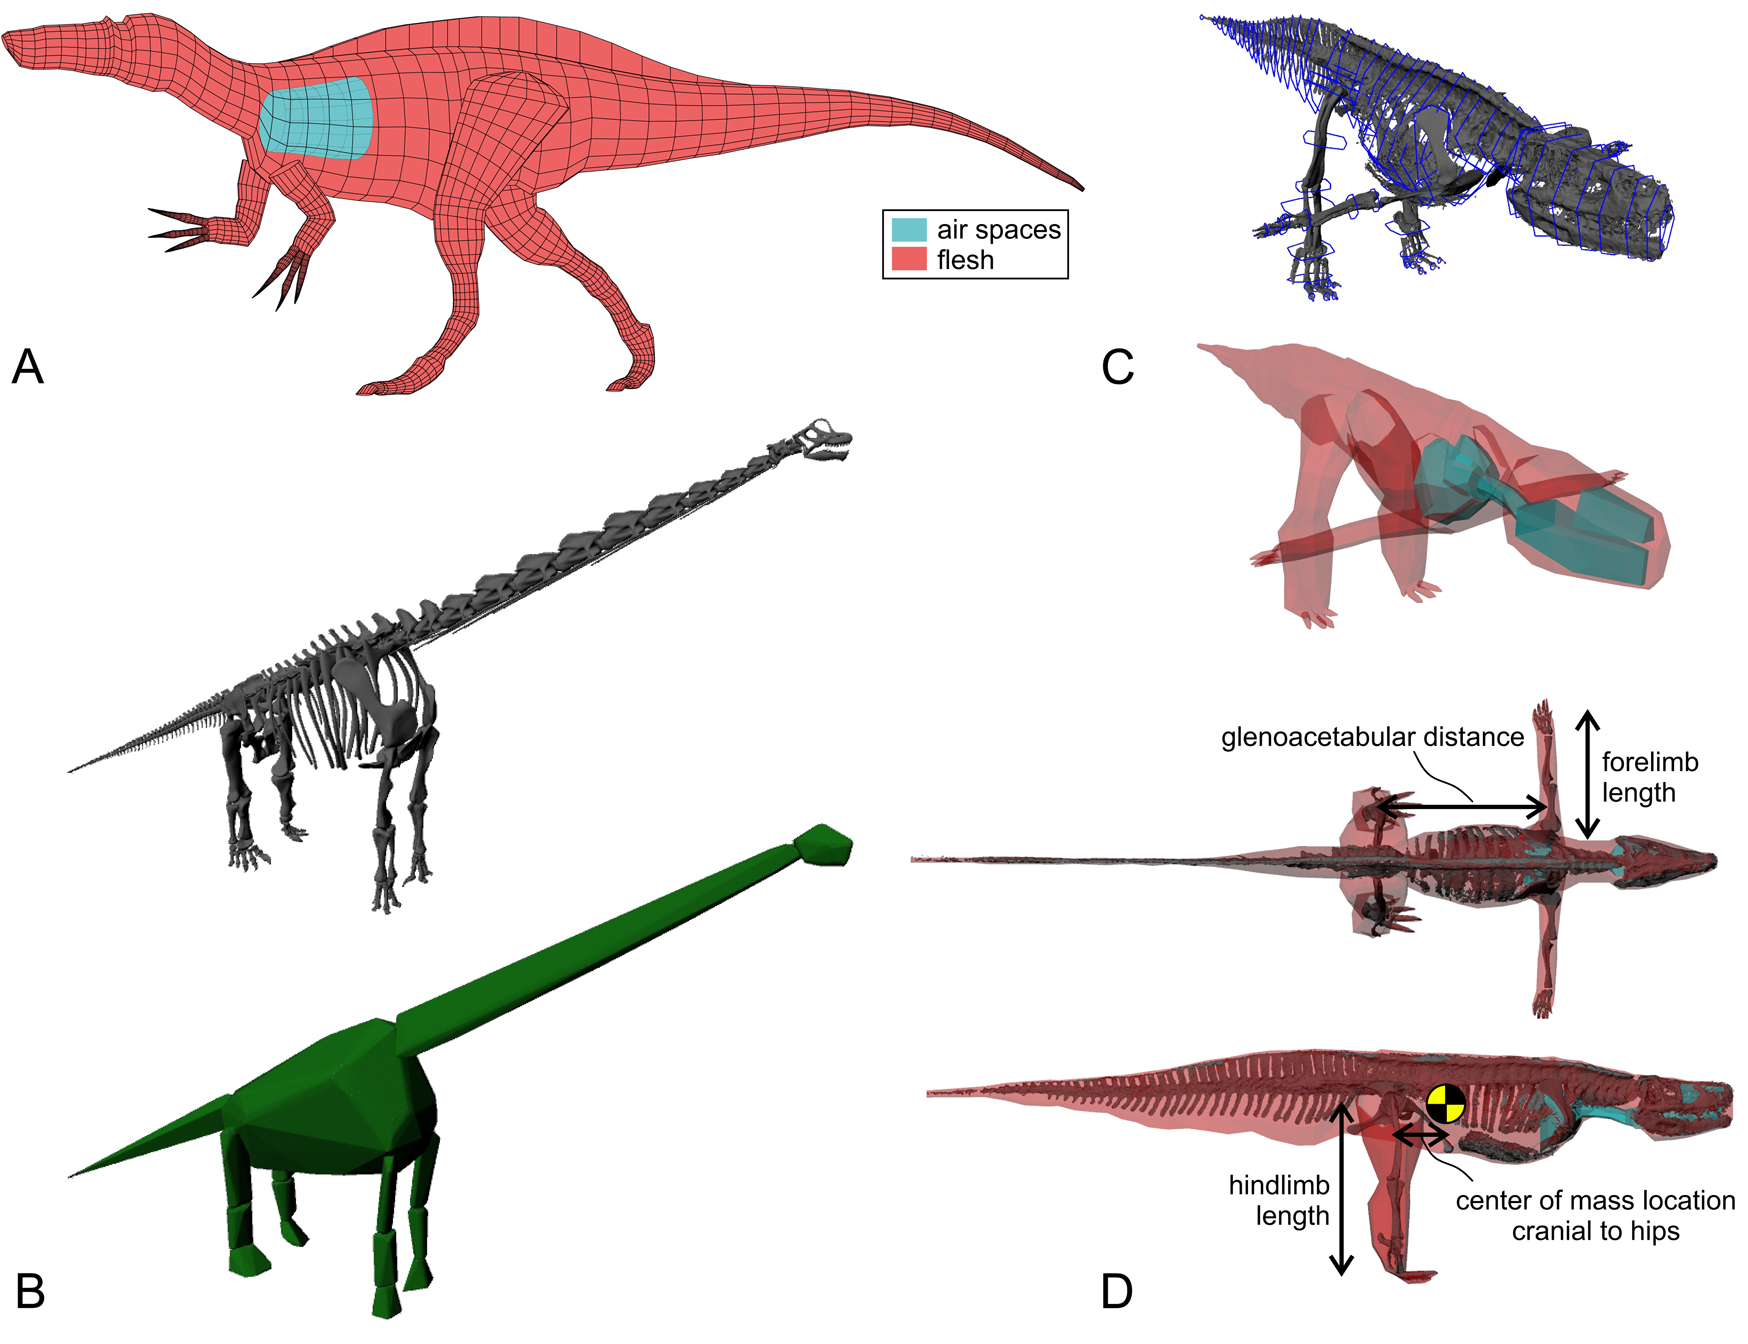
Previously published three-dimensional (3D) digital volumetric models for 72 taxa were used (see Supplementary Material, Supplementary Table S1), which includes 2 non-archosaur archosauriforms, 6 pseudosuchians (including two extant taxa), 1 non-dinosaur dinosauromorph, 15 ornithischians, 29 theropods (including five extant taxa), and 19 sauropodomorphs. These data were synthesized with new models for an additional eight taxa (one extant, seven extinct). For all the extinct taxa, and some of the extant taxa, digital volumetric models were produced using one of three established protocols (Fig. 2): a 3D slicing method that discretizes the body into a series of elliptical frusta (Henderson Reference Henderson1999); a convex hull–based method whereby convex hulls are fit around each major body segment (Sellers et al. Reference Sellers, Hepworth-Bell, Falkingham, Bates, Brassey, Egerton and Manning2012; Bates et al. Reference Bates, Mannion, Falkingham, Brusatte, Hutchinson, Otero, Sellers, Sullivan, Stevens and Allen2016); and a spline- or hoop-based method whereby a series of polygonal hoops are fit around each body segment and then lofted together (Allen et al. Reference Allen, Paxton and Hutchinson2009, Reference Allen, Bates, Li and Hutchinson2013). All three methods have been previously demonstrated to produce accurate results for a variety of extant tetrapod taxa (for which, admittedly, the approximate body geometry is already known).
Digital modeling of extinct archosaurs. A, 3D slicing method, here with the theropod Suchomimus. B, Convex-hull method, here with the sauropod Giraffatitan. C, Spline- or hoop-based method, here with the rauisuchian Batrachotomus (new analysis). Whereas 3D slicing is based on 2D illustrations in different views, the other methods are based on mounted skeletal material. D, Anatomical parameters extracted from each model used in the analyses. Glenoacetabular distance was measured parallel to the sagittal plane, and forelimb and hindlimb lengths were the sum of the lengths of the respective propdia, zeugopodia, and metapodia (or their corresponding flesh segments).
Models for three extant avian taxa (Gallus, Anas, and Buteo) were generated directly from computed tomographic scanning of whole carcasses (Gallus: Allen et al. Reference Allen, Bates, Li and Hutchinson2013; Anas and Buteo: Macaulay et al. Reference Macaulay, Hutchinson and Bates2017), and the values for mass and COM location used for these models were taken from the “best guess” results; see Allen et al. (Reference Allen, Bates, Li and Hutchinson2013) and Macaulay et al. (Reference Macaulay, Hutchinson and Bates2017) for details on density assignment. The same approach was also used to generate the new model of Crocodylus moreletii (machine tube voltage 120 kV, tube current 233 mA, exposure 750 ms, pixel resolution 0.977 mm, slice thickness 1.5 mm; scan segmentation in Mimics 19.0 [Materialize NV, Leuven, Belgium]), with density assignments following “best guess” values of Allen et al. (Reference Allen, Bates, Li and Hutchinson2013) and Macaulay et al. (Reference Macaulay, Hutchinson and Bates2017). For most other models, the values for mass and COM in all other models were taken directly from the original, published results. Two exceptions to this were as follows:
1. For the theropod models of Allen et al. (Reference Allen, Bates, Li and Hutchinson2013), a “best guess” model did not exist, but rather there were end-member extremes used to delimit the plausible ranges of mass and COM in the original study. In the present study, the mass used was the average of the “maximal mass” and “minimal mass” models, and the COM location used was the average of the “maximally cranial” and “maximally caudal” models.
2. For the sauropodomorph models of Bates et al. (Reference Bates, Mannion, Falkingham, Brusatte, Hutchinson, Otero, Sellers, Sullivan, Stevens and Allen2016), mass and COM were determined following an approach that differed slightly from the original study. Low-density (e.g., lung) volumes were ignored, and rather the “+21%” convex-hull models for all segments were used to calculate segment mass properties directly, assuming a density of 1000 kg/m3 for the tail and limbs and a density of 850 kg/m3 for the trunk, neck, and head. The purpose of this alternative protocol was to enable total consistency with new models that were generated in this study via the convex-hull technique.
Seven new extinct taxa were added to the present study, and were generated as follows. Tenontosaurus, Trilophosaurus, Stenaulorhynchus, and Protoceratops were modeled using the convex-hull method, as described earlier for the sauropodomorphs of Bates et al. (Reference Bates, Mannion, Falkingham, Brusatte, Hutchinson, Otero, Sellers, Sullivan, Stevens and Allen2016), based on digital skeletal geometries previously published by Clauss et al. (Reference Clauss, Nurutdinova, Meloro, Gunga, Jiang, Koller, Herkner, Sander and Hellwich2017). Edmontonia was also modeled using the same convex-hull method, but this was based on a digital skeletal sculpt based on fossil material (Sellers Reference Sellers2016). Batrachotomus and Muttaburrasaurus were modeled using the spline-based method, and were based on digital skeletons generated from photogrammetry of mounted skeletons (Batrachotomus: Staatliches Museum für Naturkunde, Stuttgart; Muttaburrasaurus: Queensland Museum, Brisbane), using the software Agisoft Photoscan 1.04 (Agisoft LLC, Russia). The lungs of both taxa were modeled as filling the cranial portion (cranial half in the “maximally caudal” model, cranial quarter in the “maximally cranial” model) of the thoracic cavity (Allen et al. Reference Allen, Paxton and Hutchinson2009, Reference Allen, Bates, Li and Hutchinson2013); no abdominal or other air sacs were modeled owing to the paucity of evidence for postcranial skeletal pneumaticity in pseudosuchians and ornithischians (Butler et al. Reference Butler, Barrett and Gower2012).
Comparison of Modeling Methods
Previous studies that have used digital volumetric modeling of extinct taxa have typically employed only a single modeling protocol, whereas the current study draws upon data from three. In addition to technical details concerning model generation and density assignment, there are at least three important differences between the methods involved:
1. Whereas the convex-hull and spline-based methods are based on 3D digital skeletal reconstructions, the 3D slicing method is based on two-dimensional reconstructions (lateral and dorsal views).
2. Both the convex-hull and spline-based methods create models in a standard posture, with the forelimbs held out either directly laterally or ventrally from the body, and the hindlimbs directed downward (Fig. 2C); often the vertebral column is also held in a straightened fashion for at least part of its length. In contrast, models generated using the 3D slicing method have a more natural, lifelike pose, but one that is not necessarily standardized across models.
3. Both the 3D slicing and spline-based methods involve a significant element of manual investigator input in the generation of (albeit more natural) flesh contours, whereas the convex-hull method is almost entirely automated. Nonetheless, in the spline-based method of Allen et al. (Reference Allen, Paxton and Hutchinson2009), the contours are based on empirically derived scaling factors, regarding how “inflated” contour cross sections are with respect to the underlying skeleton; it hence lies between the 3D slicing and convex-hull methods in terms of objectivity.
The collective differences between the three approaches raise the possibility that there may exist one or more systematic differences in estimates of mass or COM location between the modeling methods.
As the comparability of different protocols’ results has yet to be formally examined, an attempt was made here to assess method consistency. This assessment was unfortunately restricted by the strong historical bias between methodology and locomotor habit in the current dataset (chi-square test for association, χ2 = 30.5, p < 0.001; Supplementary Table S1); for instance, of the taxa with “known” locomotor habit (see “Statistical Analyses”), only one quadruped was modeled using the spline method. Moreover, there was also strong bias between methodology and clade (χ2 = 56.2, p < 0.001; Supplementary Table S1). Such bias not only limits the ability to distinguish systematic differences between modeling methods from genuine differences due to locomotor habit or clade, but it also limits the ability to delimit the true nature of any such difference between methods and thence apply appropriate corrections to the dataset (e.g., corrections may be disproportionately applied to some locomotor habits or clades). Here, estimates for mass and COM location for 27 taxa that had been modeled using multiple protocols were compiled, using both previously published results and new models generated here via 3D slicing or convex hulling (see Supplementary Material, Supplementary Table S2). Generation of convex-hull models followed the same protocol as outlined earlier. Not all 27 taxa were modeled using all three methods, but in each case at least two had been used. As different-sized skeletons were often used as the basis upon which these models were built, the attempt was made to first remove the effect of size by normalizing the estimates of mass and COM location (distance cranial to the hips) by glenoacetabular distance (GA):
 $${\rm mass}^\ast{ = } \displaystyle{{\root 3 \of {{\rm mass}} } \over {{\rm GA}}}\comma \;$$
 $${\rm COM}^\ast{ = } \displaystyle{{{\rm COM}} \over {{\rm GA}}}.$$
While the normalization expressed in equation 1 assumes isometry, it is important to recognize that the normalized values were only compared vis-à-vis for (at worst) slightly different-sized models of the same taxon. They were not compared across models (taxa) of widely varying sizes or proportions, for which the assumption of isometry is clearly untenable. Given that within a taxon there would be relatively little scope for size differences to begin with (indeed, in some cases, the same underlying skeleton was used for multiple methods), the assumption of isometry being violated here was considered negligible.
For a given pair of methods, normalized values of mass and COM location were compared using the smatr package (v. 3.4-3; Warton et al. Reference Warton, Duursma, Falster and Taskinen2012) in R v. 3.5.2 (R Core Team 2012). A major axis (MA) regression forced through the origin was fit to the data and then tested for whether its slope was statistically different from 1.0 (significance level set at 0.05); if there was a difference, this suggested that one method tended to systematically under- or overestimate a given parameter compared with the other. The use of a zero-intercept MA regression here was simply to test the congruence between a given pair of methods, such that the MA slope gives a measure of systematic deviation. This assumed that if there was a systematic difference in one method compared with another, that difference would be proportional to the magnitude of the quantity being compared; given the manner in which the digital models were constructed, it was considered implausible that a negative-slope (or nonzero intercept) relationship could occur between two methods.
Regression indicated that some systematic differences did indeed exist, as far as can be determined with the current sample (Table 1). The convex-hull method gave different estimates from the spline method in terms of both COM and mass, and from the 3D slicing method in terms of COM; yet there was no detectable difference between 3D slicing and spline methods. Assuming that these differences also extended to the main dataset, values for mass and COM derived from the convex-hull method in the main dataset were “normalized” with respect to the spline method (Supplementary Table S1), using the MA regression slopes as correction factors:
 $${\rm mass}_{{\rm spline}\hbox{-}{\rm corrected}}^{} {\rm} = \displaystyle{{{\rm mass}_{{\rm convex}\;{\rm hull}}^{} } \over { 0 .9071 7^ 3}}$$
 $${\rm COM}_{{\rm spline}\hbox{-}{\rm corrected}}^{} {\rm} = \displaystyle{{{\rm COM}_{{\rm convex}\;{\rm hull}}^{} } \over { 1 .5434}}$$
Results for comparison between different modeling approaches for size-normalized estimates of mass and center of mass (mass* and COM*, respectively; see eqs. 1 and 2), using major axis regression forced through the origin. Statistically significant results are noted in boldface, indicating systematic bias between modeling approaches; daggers (†) indicate that a significant difference was removed following correction as described in the text. Approaches are listed as ordinate versus abscissa in the regressions.

This restricted analysis of, and correction for, systematic differences between modeling methods is admittedly weak, and consequently in all remaining analyses statistical significance was conservatively identified with an alpha level of 0.01. Evidently, the issue deserves a more thorough and rigorous investigation in the future, which will first require the generation of many more models to reduce the aforementioned distribution biases. Until such detailed investigation is undertaken, it is prudent that future studies that focus on a single taxon should employ multiple methods (e.g., Otero et al. Reference Otero, Cuff, Allen, Sumner-Rooney, Pol and Hutchinson2019) as a way of assessing the sensitivity of the results to the modeling method used.
Parameters Investigated
For each model, four anatomical parameters were determined, in addition to GA (Fig. 2D): body mass (BM), COM location cranial to the hips (COMX), hindlimb length (HL), and forelimb length (FL). The use of these four relatively simple parameters is justified on the basis that each has direct physical relevance to terrestrial locomotor biomechanics (see “Introduction”). It is worth reiterating here that only volumetric models were used in this study, as they give internally consistent and mechanistically based estimates of both BM and COMX, in contrast to other methods that compute BM only, such as those based on propodial minimal circumferences (e.g., Campione et al. Reference Campione, Evans, Brown and Carrano2014). Such mechanistic estimates can in turn be more lucidly related to other aspects of locomotor biomechanics.
Due to the vast range in absolute size across the taxa sampled, the raw values for each parameter were corrected to account for differences in size. For BM, the base-10 logarithm was taken, which also helped reduce the sample distribution's skewness. For the linear metrics of COMX, HL, and FL, a linear regression of each metric against GA was computed in R and residuals were extracted; to account for suspected differences in allometric trajectories between GA and the different metrics, the base-10 logarithm of each metric was taken first before computing the regressions. This use of residuals was favored over the computation of basic ratios (e.g., HL/GA), as it reduces heteroscedasticity and nonlinearity in the resulting dataset.
In the original dataset, the archosauromorph Trilophosaurus had a negative COMX position (Supplementary Table S1), caused at least in part by its long and proximally deep tail, which is incompatible with the above approach of computing logarithms. The long tail would presumably have been dragged on the ground in life for some of its length (Gregory Reference Gregory1945), and this would have shifted the COM of that part of the body supported by the limbs to lying cranial to the hips by some amount. As such, COM of this taxon was nominally set as 1 cm cranial to the hips. Given that Trilophosaurus is the most stemward taxon in the current dataset, this was judged as an acceptable modification to facilitate statistical analysis.
Statistical Analyses
Phylogenetically informed statistical analyses of the size-corrected anatomical variables were conducted in R using a fully resolved, time-calibrated phylogenetic tree of the study taxa, which follows the “traditional” hypothesis of dinosaur interrelationships (see Supplementary Fig. S1). The topology of the tree was based on Nesbitt (Reference Nesbitt2011) and Ezcurra (Reference Ezcurra2016) for Archosauromorpha and Pseudosuchia; Carrano and Sampson (Reference Carrano and Sampson2008), Carrano et al. (Reference Carrano, Benson and Sampson2012), Jetz et al. (Reference Jetz, Thomas, Joy, Hartmann and Mooers2012), Allen et al. (Reference Allen, Bates, Li and Hutchinson2013), and Loewen et al. (Reference Loewen, Irmis, Sertich, Currie and Sampson2013) for Theropoda; Nair and Salisbury (Reference Nair and Salisbury2012), Otero and Pol (Reference Otero and Pol2013), Tschopp et al. (Reference Tschopp, Mateus and Benson2015), and Bates et al. (Reference Bates, Mannion, Falkingham, Brusatte, Hutchinson, Otero, Sellers, Sullivan, Stevens and Allen2016) for Sauropodomorpha; and Butler et al. (Reference Butler, Smith and Norman2007, Reference Butler, Liyong, Jun and Godefroit2011), Prieto-Márquez (Reference Prieto-Márquez2010), McDonald (Reference McDonald2012), and Farke et al. (Reference Farke, Maxwell, Cifelli and Wedel2014) for Ornithischia. The ages used for terminal taxa and internal nodes for this tree are reported in Supplementary Tables S3 and S4, respectively. Analyses were also conducted using a second tree of markedly different topology, based on the “Ornithoscelida hypothesis” of dinosaur interrelationships (Baron et al. Reference Baron, Norman and Barrett2017; see Supplementary Fig. S2); the ages of terminal taxa remained identical to those of the first tree, whereas the ages used for the internal nodes are reported in Supplementary Table S5.
Phylogenetic principal components analysis (pPCA; Revell Reference Revell2009) was used to explore how morphological variation related to locomotor habit, using the phytools package for R (v. 0.6; Revell Reference Revell2012), where the evolutionary correlation matrix was derived assuming a Brownian model of trait evolution. To assess the influence of phylogeny, the K statistic (and associated p-value) of Blomberg et al. (Reference Blomberg, Garland and Ives2003) was also determined in phytools. In this study, the locomotor habit of each taxon was classified a priori based on current consensus (see also Thulborn Reference Thulborn1990; Maidment and Barrett Reference Maidment and Barrett2014; Grinham et al. Reference Grinham, VanBuren and Norman2019 and references cited therein), as either obligate biped (n = 33), obligate quadruped (n = 34), or “other” (n = 13), where the last category contained taxa hypothesized to be facultatively bipedal or taxa whose habits are controversial or previously not assessed in detail. Locomotor mode is here defined as the stance adopted during straight-line, level, quasi-steady walking.
The pPCA served primarily as an aid to qualitatively assess broad patterns. The distinction between bipedal and quadrupedal principal component (PC) scores was quantitatively tested with a one-way, nonparametric, multivariate analysis of variance (PERMANOVA) in the vegan package for R (v. 2.5-6; Oksanen et al. Reference Oksanen, Blanchet, Friendly, Kindt, Legendre, McGlinn, Minchin, O'Hara, Simpson, Solymos, Stevens, Szoecs and Wagner2019). Disparity in PC scores was estimated for bipeds and quadrupeds using Procrustes distance regression in the geomorph package in R (v. 3.1.1; Adams et al. Reference Adams, Collyer and Kaliontzopoulou2018). To investigate how the size-corrected anatomical parameters themselves related to each other and locomotor habit, three analyses were undertaken. First, a phylogenetic multivariate analysis of variance (pMANOVA) was conducted, using phylogenetic Procrustes distance regression, to test whether there was an overall difference between bipeds and quadrupeds considering all four parameters together. Second, a phylogenetic analysis of variance (pANOVA) was conducted, using the phytools package, to test whether there was a difference between bipeds and quadrupeds considering each parameter independently. Finally, pairwise comparisons between parameters were conducted for bipeds and quadrupeds via MA regression, using the smatr package. This involved correcting the values for each parameter for phylogenetic signal, using phylogenetic generalized least squares in the caper package in R (v. 0.5.2; Orme et al. Reference Orme, Freckleton, Thomas, Petzoldt, Fritz, Isaac and Pearse2015), the residuals from which were then used in the regressions. The slopes for a given pairwise MA fit were compared between bipedal and quadrupedal taxa using the smatr package.
Predictive Framework
Linear discriminant analysis (LDA) was used to produce a predictive framework for archosaur locomotor mode based on the original (size-corrected) anatomical parameters, using the MASS package for R (v. 7.3-50; Venables and Ripley Reference Venables and Ripley2002). Instead of deriving a single predictive model, 11 variants were tested here, which differed in the combination of anatomical variables (two, three, or all four) used in the training dataset. In addition, as birds were found to occupy a distinct position in morphospace (see “Results”), two variants of the training dataset were also tested: one with all “known” taxa (i.e., 33 bipeds and 33 quadrupeds) and one excluding birds (i.e., 25 bipeds and 33 quadrupeds); as Trilophosaurus was found to be a morphological outlier (see “Results”), it was excluded from both training datasets. Hence, a total of 22 different training datasets were tested to identify which resulted in predictions most consistent with the postures assigned to “known” bipeds and quadrupeds (see Supplementary Table S6). The consistency of each LDA with predefined assignments for “known” taxa was assessed using leave-one-out testing (jackknifing) of the training dataset and computing the total success rate. Subsequently, each LDA was then used to predict locomotor habit for the “other” taxa, for which locomotor habit is currently uncertain or controversial. It is worth noting that LDA will always classify a given subject into one of the available categories, regardless of how congruous it actually is with other data in the same category.
Initial analyses with additional models suggested that LDA may produce spurious results for immature specimens with morphologies (or even stance) that are qualitatively different from those of adults. As such, in addition to the original 13 “other” taxa used in the statistical analysis, two previously published models were included to explore the relevance of the LDA for assessing ontogenetic effects on locomotor mode: a juvenile Alligator (Bates et al. Reference Bates, Mannion, Falkingham, Brusatte, Hutchinson, Otero, Sellers, Sullivan, Stevens and Allen2016) and a hatchling Mussaurus (Otero et al. Reference Otero, Cuff, Allen, Sumner-Rooney, Pol and Hutchinson2019).
Monte Carlo Simulation
Two of the primary variables used in this study, BM and COMX, are estimates derived from computational volumetric models; as estimates they may therefore carry an attendant level of error from the “true” value (were it ever able to be known). In turn, error in the baseline dataset may affect the results obtained and the conclusions drawn from them. To explore the effect of error in BM and COMX estimates, a Monte Carlo simulation was performed with 1000 replicates, wherein BM and COMX were allowed to randomly vary up to a prescribed amount, and the pPCA and LDA were recomputed. Based on the results of Henderson (Reference Henderson1999) and Allen et al. (Reference Allen, Paxton and Hutchinson2009), both BM and COMX were allowed to vary by up to ±15% of their original values.
Results
Patterns of Anatomical Variation
The results of pPCA differed only marginally between the two phylogenies used (traditional vs. Ornithoscelida hypotheses of dinosaur interrelationships). Comparison of the PC scores between the two trees using symmetric Procrustes superimposition in the vegan package showed that the score sets were not significantly different (multivariate correlation coefficient = 0.999, p < 0.001). Moreover, the relative difference between PC scores for a given taxon between the two phylogenetic hypotheses was on average 0.015% for PC 1, 0.357% for PC 2, 0.148% for PC 3, and 0.370% for PC 4; that is, the score a given taxon received on average differed by <1% between the two phylogenies used. Therefore, only the results derived from using the traditional phylogeny are presented herein. Despite the minimal difference in pPCA results between the two tree topologies, three of the four anatomical parameters showed a low to modest influence of phylogeny (BM: K = 0.57, p = 0.001; HL: K = 1.11, p = 0.001; FL: K = 0.39, p = 0.001). This indicated that the phylogenetic effect originated from at least one crownward part of the tree; because the difference between the two trees used occurred very deep within the phylogeny, the scope for phylogenetic effects in more crownward parts remained unaltered.
Each PC was loaded moderately to strongly by at least two anatomical parameters (Table 2); PC 1 accounted for 47.47% of the total data variance, PC 2 accounted for 25.61%, PC 3 accounted for 19.4%, and PC 4 accounted for 7.52% of the total variance. There was a very strong distinction between bipedal and quadrupedal taxa in PC space, both visually (Fig. 3, Supplementary Movie S1) and as indicated by PERMANOVA (F 1,65 = 16.25, p < 0.001). Some of the 13 “other” taxa tended to bridge between the bipedal and quadrupedal morphospaces in PC space, often plotting near the region of overlap between the two morphospaces, whereas others plotted either within one particular morphospace or outside both (Fig. 3, Supplementary Movie S1). Birds (except the giant, flightless Struthio) occupied their own distinct region of the bipedal morphospace, characterized by the lowest (most negative) PC 3 values; comparably low values were not present in any quadruped. Trilophosaurus was an outlier for the quadrupedal morphospace, its position in PC space—closer to bipeds than quadrupeds—being driven heavily by its caudal COMX position (Fig. 3, Supplementary Movie S1).
3D plot of the first three principal component (PC) scores for each taxon, which collectively accounted for 92.5% of the variation in the dataset. The regions of space occupied by bipedal and quadrupedal taxa are delimited by convex hulls (generated using Meshlab 1.3.3; Cignoni et al. Reference Cignoni, Callieri, Corsini, Dellepiane, Ganovelli and Ranzuglia2008), for visualization purposes only; the convex hull for quadrupeds was generated excluding the outlier Trilophosaurus. Also plotted are the loading vectors for each anatomical parameter, and silhouettes that illustrate body shapes at the extremes of the bipedal and quadrupedal morphospaces. The enigmatic taxa Euparkeria (E), Postosuchus (P) and Marasuchus (M) are also labeled. COM, center of mass.

Loadings of each anatomical parameter on the principal components resulting from phylogenetic principal components analysis (pPCA). BM, body mass; COMX, center of mass location cranial to the hips; HL, hindlimb length; FL, forelimb length.

Procrustes disparity of the bipedal morphospace of PC scores was not significantly different from that of the quadrupeds (108.7 vs. 92.2, respectively; p = 0.49), a result that remained unaltered when Trilophosaurus was excluded from consideration. Distilling this down to each PC, however, it was apparent that there were marked differences between bipeds and quadrupeds (Table 3). Quadrupeds showed more than double the variation in PC 1 than bipeds, a result that appears to have been driven in large part by ornithischians. Conversely, bipeds showed more than six times the variation in PC 3 than quadrupeds, a result that probably stemmed in large part from the high variance in theropods (including birds), given that theropods comprise the majority of bipeds in the current sample. Indeed, PC 3 was loaded most strongly by BM and COMX (Table 2), two parameters for which phylogenetically directed trends within Theropoda have been previously noted (Turner et al. Reference Turner, Pol, Clarke, Erickson and Norell2007; Allen et al. Reference Allen, Bates, Li and Hutchinson2013; Lee et al. Reference Lee, Cau, Naish and Dyke2014; Benson et al. Reference Benson, Hunt, Carrano and Campione2018). Bipedal and quadrupedal morphospaces were well (but not completely) separated along the PC 2 axis (Fig. 3, Supplementary Movie S1), which was mostly loaded by COMX and hindlimb length (Table 2); this suggests that, broadly speaking, bipedal archosaurs have longer hindlimbs and a COMX located closer to the hips.
Means (μ) and variances (σ2) for each principal component (PC) score, parsed by both locomotor category and major clade.

In terms of the anatomical parameters themselves, pANOVA indicated that bipeds and quadrupeds were statistically indistinct when each parameter was considered separately (cf. Table 4). However, more holistically, pMANOVA of the anatomical parameters showed that bipeds were distinct from quadrupeds (F 1,65 = 44.74, r 2 = 0.41, p < 0.001), and were almost twice as disparate morphologically than quadrupeds (Procrustes variances of 2.38 and 1.22, respectively; p = 0.005). Bipeds displayed more than double the variance in BM than quadrupeds, a result again strongly driven by theropods (Table 4), whose range in absolute values of BM in the current dataset spans more than five orders of magnitude (compared with a little over three orders of magnitude across all quadrupeds).
Means and variances for each anatomical parameter, parsed by both locomotor category and major clade. Note that for center of mass location cranial to the hips (COMX), hindlimb length (HL), and forelimb length (FL), these are the residuals derived from normalizing to body size (glenoacetabular distance).

The results for all pairwise comparisons of phylogenetically corrected anatomical values are reported in Table 5, and pairwise plots of phylogenetically reduced residuals are presented in Figure 4. In both bipeds and quadrupeds, FL was significantly and positively correlated with HL, although the relationships were statistically indistinguishable between the two groups; furthermore, it cannot be discounted that these results are not partly driven by spurious correlation with GA, as both variables were normalized with respect to this distance in deriving residuals. In addition, FL was significantly and positively correlated to COMX in bipeds; that is, a relatively more cranial COM location was tied to relatively longer forelimbs (cf. Allen et al. Reference Allen, Bates, Li and Hutchinson2013). Unconventionally, COMX and BM were found to be positively correlated in bipeds, but the significance of this trend was driven solely by the outlying residuals for Heterodontosaurus (Fig. 4).
Results for pairwise comparison of the phylogenetically corrected values for each anatomical parameter by major axis regression. Statistically significant results are noted in boldface. *When Heterodontosaurus is removed from consideration, the correlation degenerates to becoming nonsignificant (cf. Fig. 4). COMX, center of mass location cranial to the hips; BM, body mass; HL, hindlimb length; FL, forelimb length.

Pairwise comparisons of phylogenetically corrected anatomical parameters for both bipeds (solid circles) and quadrupeds (open circles). Where a statistically significant correlation was identified (via major axis regression), the regression line is also plotted; solid line for bipeds; dashed line for quadrupeds. Note that the significant correlation identified between mass and center of mass location cranial to the hips (COMX) for bipeds is driven by the residuals for Heterodontosaurus (indicated by “H”). BM, body mass; HL, hindlimb length; FL, forelimb length.

Linear Discriminant Analysis
Of the 22 variants in LDA tested, three of the four best-performing variants excluded birds from the training dataset and had success rates exceeding 98% (Supplementary Table S6). Indeed, excluding birds from the training dataset almost always resulted in an improvement in classification success rate. The single best LDA used COMX + HL + FL (“model 21”) as the combination of anatomical variables in the training dataset, with a classification success rate of 100% (Supplementary Table S6). Typically, the assignment of the training dataset taxa into bipedal or quadrupedal categories was relatively unambiguous; for instance, in model 21, more than 80% of the training taxa had posterior probabilities exceeding 0.95. These results further affirmed the strong distinction between bipeds and quadrupeds in the current sample. The most frequently misclassified training dataset taxa were the pseudosuchian Riojasuchus (misclassified as bipedal, 12 out of 22 times) and the sauropod Neuquensaurus (misclassified as bipedal, 11 out of 22 times), which had COMX residuals among the lowest, if not the lowest, values for their respective clades (i.e., caudal COMX location), potentially explaining their relatively frequent misclassifications. Both taxa are known from the majority of the skeleton (Otero Reference Otero2010; von Baczko et al. Reference von Baczko, Desojo and Ponce2019), suggesting underlying causes other than reconstruction error, such as apomorphic anatomies. For instance, Neuquensaurus was quite small for a sauropod, and moreover it possessed a very broad pelvis, potentially resulting in a more caudal COMX location.
The classifications assigned to the 15 “other” taxa for the four best-performing models are reported in Table 6. The classifications broadly corresponded to qualitative observations of how each taxon plots in PC space (Fig. 3, Supplementary Movie S1). As an explicit “facultatively bipedal” category was not included, the posterior probabilities determined may give some tentative indication of how often bipedalism and quadrupedalism were used during normal activity. The pseudosuchians Postosuchus and Batrachotomus were strongly supported as a biped and quadruped, respectively. The enigmatic archosauriform Euparkeria was also classified as a quadruped, although in PC space it plotted well clear of the bipedal and quadrupedal morphospaces, and hence this result should be viewed with caution. In general concordance with a recent study (Otero et al. Reference Otero, Cuff, Allen, Sumner-Rooney, Pol and Hutchinson2019), adult Mussaurus was frequently classified as a biped, whereas its hatchling was frequently classified as a quadruped (including in the best-performing model). The juvenile Alligator model was frequently (mis)classified as a biped (73% of LDA variants), whereas the jackknifed classifications of the adult Crocodylus models (quadrupedal) were frequently correct (70% of LDA variants).
Classifications and posterior probabilities (Pr) resulting from linear discriminant analysis applied to the 15 “other” taxa, for the four best-performing models. The correct classification rate on the training dataset is also given for each model.

Monte Carlo Simulation
Simulation indicated that the results of pPCA were very robust to error in BM and COMX. Of the 1000 replicates, not one resulted in a set of PC scores that was significantly different from (i.e., uncorrelated with) the scores obtained in the main analysis using the original estimates, as indicated by symmetric Procrustes superimposition (p < 0.001). The first three PCs still accounted for 92% of the dataset's variation on average (mean ± SD for each PC: PC 1 = 47.1 ± 2.2%, PC 2 = 25.9 ± 1%, PC 3 = 19.4 ± 2.3%, PC 4 = 7.6 ± 0.4%). The average direction of the loading vectors across the 1000 replicates was within 5° of the original directions in the main analysis, and the angular standard deviation of the loading vectors’ directions in PC 1–3 space was 17° or less, indicating a narrow or acute “cone of variation” (cf. Fig. 3). Procrustes disparity (104.7 ± 3.5 for bipeds and 90.9 ± 3.1 for quadrupeds, p > 0.5) and PERMANOVA results (F 1,65 = 15.8 ± 0.6, p < 0.001) also did not differ significantly from the results of the main analysis.
In terms of the LDA, model 21 remained the best-performing combination of anatomical variables, with a classification success rate of 98.53 ± 1.33%. The distribution of posterior probabilities for classification of the 15 “other” taxa were also highly consistent with the original probabilities obtained in the main analyses; Figure 5 illustrates the distributions for the model 21 combination. Nonetheless, the spread of probabilities for the juvenile Alligator and Marasuchus encompassed a considerable proportion of quadrupedal classifications, suggesting that the main analysis’ classifications for these two taxa should be viewed tentatively.
Distribution of posterior probabilities (Pr) obtained for each of the 15 “other” taxa under model 21 linear discriminant analysis (LDA) across the 1000 replicates of the Monte Carlo simulation, binned into 100 intervals. Thick vertical lines denote probabilities obtained for each taxon in the main analysis using the original estimates for body mass (BM) and center of mass location cranial to the hips (COMX).

Discussion
Patterns of Anatomical Variation
By synthesizing data derived from 3D computational models, this study principally sought to examine how mass properties and gross body proportions relate to each other and locomotor habit—here taken to mean bipedal versus quadrupedal stance—in terrestrial archosaurs. The results of pPCA indicated that, despite concerns regarding methodological bias in generating estimates, or potential error associated with this, bipedal and quadrupedal species were largely distinct from each other in morphospace (Fig. 3). Procrustes distance regression of all the original anatomical parameters themselves also recognized a clear distinction between the two groups. Yet few differences existed between bipeds and quadrupeds on an individual parameter-by-parameter basis (Table 4), and no PC was loaded primarily by just one anatomical parameter (Table 2). These findings highlight how a holistic, multivariate approach can facilitate more rigorous, quantitative assessment of locomotor habit in extinct archosaurs.
Following on from this, the single clearest distinction between bipedal and quadrupedal taxa revealed in the present study was bivariate (Fig. 3, Supplementary,Movie S1): overall, bipeds have relatively longer hindlimbs than quadrupeds (paralleling the finding of Kubo and Kubo Reference Kubo and Kubo2012) and have a COM located closer to the hips. This result is hardly surprising, as biological and mechanical intuition would lead to an expectation of this pattern. From a biological perspective, longer hindlimbs reflect greater investment of biomass in them as locomotive organs, and therefore likely reflect greater reliance on the hindlimbs during daily activity. From a mechanical perspective, the COM must be kept over a “polygon of support” formed by the feet during static and dynamic activities (Alexander Reference Alexander2006; Herr and Popovic Reference Herr and Popovic2008; Winter Reference Winter2009), the size of which is more restricted—and posteriorly positioned—in a biped. The size and mobility of the hindlimbs therefore constrains how far the COM is able to be located cranial to the hips in a biped (Hutchinson Reference Hutchinson2006; Gatesy et al. Reference Gatesy, Bäker and Hutchinson2009), although postural differences can also modulate this relationship, as occurs in birds (Hutchinson and Allen Reference Hutchinson and Allen2009; Allen et al. Reference Allen, Bates, Li and Hutchinson2013).
Quadrupedal archosaurs are (or were) probably also subject to their own form of locomotor constraint. Compared with bipeds, the current sample of quadrupeds exhibited substantially less variance in FL and a similar variance in HL (Table 4), suggesting that in order to coordinate stable, efficient progression, the dimensions of the limbs and intervening trunk in quadrupeds need to be more closely coupled with one another (see also Thulborn Reference Thulborn1982). The adoption of bipedality and removal of this constraint can therefore enable uncoupling of fore- and hindlimb locomotor modules (Gatesy and Dial Reference Gatesy and Dial1996) and in turn promote greater evolutionary variability in limb size. This raises a possible evolutionary scenario within bipedal archosaurs, whereby relaxation of the “coupled proportions” constraint may have facilitated greater anatomical, functional, and perhaps ecological innovation, which in turn may have expedited the diversification of bipedal archosaurs across the Triassic/Jurassic boundary and into the later Mesozoic. For example, constraint relaxation should have been conferred by bipedality in the immediate ancestors of dinosaurs (Grinham et al. Reference Grinham, VanBuren and Norman2019). Such relaxation would then have presaged the uncoupling of forelimb and hindlimb allometries at the origin of birds, in association with the acquisition of powered flight (Dececchi and Larsson Reference Dececchi and Larsson2013), which subsequently led to phenotypic release in both limbs and increased rates of evolution in stem birds (Benson and Choiniere Reference Benson and Choiniere2013).
Predicting Locomotion in Extinct Archosaurs
A secondary aim of this study was to develop a quantitative framework that could be used to help predict locomotor habit in extinct terrestrial archosaurs, and that bipeds and quadrupeds were largely distinct in PC space has facilitated this. Although beyond the scope of the present study, this new framework has the potential to provide new rigor to assessments of locomotor evolution within Archosauria, such as the frequency and phyletic distribution of shifts from quadrupedalism to bipedalism (facultative and obligate; Kubo and Kubo Reference Kubo and Kubo2012; McPhee et al. Reference McPhee, Benson, Botha-Brink, Bordy and Choiniere2018; Grinham et al. Reference Grinham, VanBuren and Norman2019; Chapelle et al. Reference Chapelle, Benson, Stiegler, Otero and Choiniere2020). This would first require the generation of digital volumetric models for additional taxa, particularly those surrounding inferred transitions, which can be a nontrivial and time-intensive process.
Interestingly, it was found that excluding birds from the training dataset almost always resulted in improved classification accuracy. Birds occupied a distinct region of PC space in the current study, with strongly negative values along PC 3 reflecting their overall smaller BM (compared with both bipeds and quadrupeds), and to a lesser extent their more cranial COMX (compared with bipeds). It is possible that the tendency toward a more cranial COMX makes birds more quadruped-like than most other nonavian bipedal archosaurs, impeding the ability of LDA to accurately separate out the two locomotor categories. As most birds are volant, and therefore not strictly terrestrial in their locomotor habit, the current study's findings echo previous arguments that birds are not a good candidate as modern analogues for studying locomotion in Archosauria as a whole (e.g., Gatesy and Middleton Reference Gatesy and Middleton1997; Carrano Reference Carrano1998; Hutchinson and Gatesy Reference Hutchinson and Gatesy2000).
Many of the predictions of the best-performing LDAs in the current study concur with previous assessments, such as quadrupedality in Batrachotomus (Gower and Schoch Reference Gower and Schoch2009) and Iguanodon (Norman Reference Norman1980), bipedality in Lufengosaurus (Bates et al. Reference Bates, Mannion, Falkingham, Brusatte, Hutchinson, Otero, Sellers, Sullivan, Stevens and Allen2016; McPhee et al. Reference McPhee, Benson, Botha-Brink, Bordy and Choiniere2018) and Postosuchus (Weinbaum Reference Weinbaum, Nesbitt, Desojo and Irmis2013), and bipedality in adult Mussaurus but quadrupedality in its hatchlings (Otero et al. Reference Otero, Allen, Pol and Hutchinson2017, Reference Otero, Cuff, Allen, Sumner-Rooney, Pol and Hutchinson2019). There are also conflicts with previous assessments, most notably the hadrosaurids Gryposaurus and Edmontosaurus being consistently classified here as bipeds. This is in contrast with the quadrupedal classification obtained for a third hadrosaurid, Lambeosaurus, despite the fact that all three taxa possess numerous osteological features suggestive of the use of quadrupedal stance (Dilkes Reference Dilkes2001; Maidment and Barrett Reference Maidment and Barrett2014), and reflected by many Late Cretaceous quadrupedal trackways attributed to hadrosaurids generally (Lockley and Wright Reference Lockley, Wright, Tanke and Carpenter2001). What, then, might explain this discrepancy?
The discord surrounding hadrosaurids has been noted previously: on the basis of propodial proportions, the method of McPhee et al. (Reference McPhee, Benson, Botha-Brink, Bordy and Choiniere2018) was observed to have some difficulty with quadrupedal taxa that possess biped-like humeral proportions. Hadrosaurids tend to have gracile, “biped-like” forelimbs, and this may be responsible for the (potential) misclassifications obtained in the present study as well, which only used gross body proportions as a basis for classifications. In future studies, it would be worthwhile to combine the metrics used in the current study with those used by others, such as the proportions of individual limb bones (McPhee et al. Reference McPhee, Benson, Botha-Brink, Bordy and Choiniere2018) or the vertebral column (Christian and Preuschoft Reference Christian and Preuschoft1996), into a single framework. Moreover, as discrete osteological features have also frequently aided interpretations of locomotor habit (e.g., Mallison Reference Mallison2010; VanBuren and Bonnan Reference VanBuren and Bonnan2013; Maidment and Barrett Reference Maidment and Barrett2014), it would also be interesting to incorporate such discrete measures into a quantitative predictive framework.
One further misclassification of the LDAs was that the juvenile Alligator model was often misclassified as bipedal, yet there is no evidence of sustained, habitual, or facultative bipedalism in any extant Crocodylia. This result parallels a bipedal misclassification obtained for a juvenile Caiman by McPhee et al. (Reference McPhee, Benson, Botha-Brink, Bordy and Choiniere2018). It is known that extant crocodylians undergo substantial changes through ontogeny, in both cranial and postcranial proportions (Dodson Reference Dodson1975; Allen et al. Reference Allen, Paxton and Hutchinson2009; Iijima and Kubo Reference Iijima and Kubo2019). Ontogenetic effects may therefore distort relationships between individual bone proportions and mass, COMX or other posturally relevant parameters (e.g., see Brassey et al. Reference Brassey, Maidment and Barrett2015). The present study did not aim to explicitly account for ontogenetic effects, and yet as noted earlier, the LDAs frequently detected an ontogenetic shift in locomotor mode in the early sauropodomorph Mussaurus, concordant with the interpretation of Otero et al. (Reference Otero, Cuff, Allen, Sumner-Rooney, Pol and Hutchinson2019). While the same computational models were used in the present study and that of Otero et al. (Reference Otero, Cuff, Allen, Sumner-Rooney, Pol and Hutchinson2019), they were analyzed and interpreted differently (one mechanistically, the other statistically), such that the consilience of interpretations further supports a shift in locomotor mode as Mussaurus matured. Ontogenetic changes in locomotor mode have been proposed for other extinct terrestrial archosaurs (e.g., Heinrich et al. Reference Heinrich, Ruff and Weishampel1993; Dilkes Reference Dilkes2001; Zhao et al. Reference Zhao, Benton, Sullivan, Sander and Xu2013; Słowiak et al. Reference Słowiak, Tereschenko and Fostowicz-Frelik2019; Chapelle et al. Reference Chapelle, Benson, Stiegler, Otero and Choiniere2020), and it would be interesting to explore the applicability of the current study's approach to testing these interpretations in the future.
Conclusion
By considering multiple parameters that describe whole-body mass properties and proportions, bipedal and quadrupedal archosaur taxa were largely distinguished from each other. The results presented here should nevertheless be viewed tentatively, as it remains to be fully determined how methodological differences (in deriving estimates of BM and COMX) may influence the nature of the resulting comparative dataset, and hence any of the findings and interpretations made here. It is also important to recognize that the present study's dataset is biased toward two principal clades (Theropoda and Sauropodomorpha), and future sampling of additional disparate taxa (e.g., bipedal poposaurs, basal marginocephalians, and long-legged crocodylomorphs or silesaurids) may potentially reduce the degree of distinction between bipedal and quadrupedal taxa. Furthermore, the mean body mass of the present study's taxa was 3393 kg, with more than half being >200 kg, and greater sampling of small-bodied taxa could enrich insights on the relationships between body form, size, and locomotor habit. Despite these limitations, it is clear that a more holistic approach is required to fully understand locomotor behavior and evolution within archosaurs. Additionally, the findings of the present study suggest that important biomechanical constraints on the Bauplan of archosaurs (limb and trunk proportions) influenced the scope and extent of anatomical variation in both bipedal and quadrupedal species over their 250 Myr history.
Acknowledgments
A. Cuff, K. Michel, E. Herbst, and B. Esteve-Altava are thanked for discussion of general data analysis, as are A. Wiseman, A. Goswami, R. Felice, J. Clavel, and A. Fabre for very helpful statistical advice. N. Campione and S. Maidment and prior anonymous reviewers are sincerely thanked for their very thorough and constructive criticisms of earlier drafts of the article, which greatly improved the content and presentation. This research was supported by an ERC Horizon 2020 Advanced Investigator Grant (695517, to J.R.H.). All data and code used in this study are provided in the Supplementary Material.
P.J.B., V.R.A., and J.R.H. conceived the study design; P.J.B., K.T.B., V.R.A., D.M.H., and J.R.H. produced digital models and contributed data; P.J.B. and M.R. conducted statistical analyses; all authors contributed to results interpretation and writing the article.


 Open access