

Obesity, understood as a condition of excessive fat accumulation, is a global problem now reaching epidemic proportions(1). It is a major, yet largely preventable, risk factor for a number of chronic diseases, including CVD and type 2 diabetes. BMI, because of its simplicity and hence general applicability, is a widely used surrogate measure of obesity. While BMI and percentage of body fat (BF) are generally well correlated, there is increasing evidence of wide ethnic variation in the relationship between these two variables(Reference Deurenberg, Yap and van Staveren2). Ethnic differences in body build and body composition may contribute to differences in the relationship between BMI and BF between ethnic groups. For example, correction for differences in relative leg length and frame size between Caucasian and Chinese populations reduced the disparity between BMI-predicted percentage of BF for these groups(Reference Deurenberg, Deurenberg Yap and Wang3). Other factors, including muscularisation, bone mass and physical activity, may also be important(Reference Luke, Durazo-Arvizu and Rotimi4, Reference Deurenberg, Deurenberg-Yap and Guricci5).
A BMI-based cut-off threshold for obesity defined by the WHO (BMI ≥ 30 kg/m2) is intended for international use and based on the relationship between BMI and morbidity and mortality in Western populations. In other populations, adoption of such a threshold may mask the true prevalence of obesity and the associated disease risk. Based on this threshold, Asian immigrants from the Indian subcontinent have low rates of obesity, yet, relative to Europeans, they have a higher prevalence of CHD and type 2 diabetes(Reference Balarajan6–Reference Dhawan, Bray and Warburton9). The greater central deposition of BF in Asian Indians compared with Europeans(Reference McKeigue, Shah and Marmot7) contributes to this increased disease prevalence(Reference Vague10, Reference Despres11). Polynesians have higher bone and muscle mass compared with Europeans(Reference Houghton12, Reference Reid, Cullen and Schooler13), but also have a higher prevalence of diabetes(Reference Simmons, Harry and Gatland14). The WHO has recognised the deficiencies of a universal cut-off for obesity(15), and in a 2004 report(16) suggested that further body composition studies of Asian and Pacific Island populations are needed to determine equivalent fatness levels and the relationship of BMI with body size. Ethnicity-specific recommendations for BMI-based thresholds for obesity may have significant implications for public health policies in many countries.
In the present cross-sectional study, we provide a comparative analysis of the body composition of European, Maori, Pacific Island and Asian Indian adults focusing principally on the BMI–BF relationship and body composition variables that may influence this relationship. We sought specifically to identify ethnic differences in (1) the relationships between body fatness and body size; (2) fat distribution; (3) muscularity; (4) bone mineral mass; (5) leg length; (6) associations between body composition and age. The present study represents the first direct comparison across the adult age range of Polynesian and Asian Indian men and women, ethnic groups that may be considered to lie at opposite extremes in terms of their body composition.
Subjects and methods
Subjects
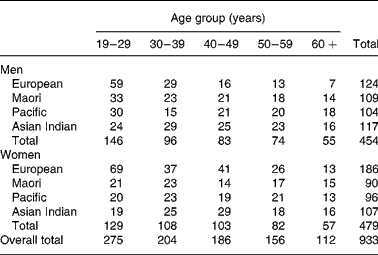
Subjects were 933 healthy volunteers (454 males and 479 females) aged 17–80 years of European, Maori, Pacific Island and Asian Indian ethnicity, who participated in body composition studies conducted in the Department of Surgery, University of Auckland, between 1990 and 2004. Exclusion criteria were total joint replacement, pregnancy, lifting weights more than once per week, major medical conditions (such as diabetes or cancer) and medication (such as oral steroids), which may affect body composition. In addition, three participants for whom recorded scale and dual-energy X-ray absorptiometry (DXA) weight (sum of fat mass (FM), fat-free soft tissue and bone mineral content (BMC)) differed by more than 2·5 kg were excluded. All studies were approved by the local ethics committees and all participants provided written informed consent. Maori and Pacific (predominantly Samoan) volunteers were recruited from urban Auckland or rural areas of the upper North Island of New Zealand, and European and Asian Indian volunteers from urban Auckland. Recruitment was by personal contact, advertisement or through existing networks of the recruiters. Recruitment of the Maori, Pacific and Asian Indian volunteers was designed to achieve similar numbers in both male and female groups for each decade of age between 20 and 70 years. For the European sample, such a uniform age distribution was not sought and the age distribution was weighted towards the 20–40 years range with a predominance of females. Ethnicity was self-defined and was at least the ethnic group of three of the four grandparents. Asian Indian was used to describe people of South Asian origins, including Pakistan, India and Sri Lanka. The number of subjects grouped by sex, ethnicity and decade of age are shown in Table 1.
The number of subjects by age group, sex and ethnicity
Anthropometry
With the subjects wearing light clothing and no shoes, height was measured to the nearest 0·5 cm, using a stadiometer, and weight was measured to the nearest 0·1 kg, using a platform beam scale, and an estimated clothing weight was subtracted. BMI was calculated as weight (kg)/height (m2).
Whole-body composition
The body composition (FM, fat-free soft tissue and BMC) measurements were made using a single DXA machine (model DPX+ with software version 3.6y; Lunar Radiation Corp., Madison, WI, USA) with the subjects lying supine in light clothing. Fat-free mass was calculated as the sum of fat-free soft tissue and BMC. Percentage of BF was calculated as 100 × FM/DXA weight.
Fat distribution
For assessing regional fat distribution, the whole-body DXA scans were analysed. Abdominal and thigh regions of interest were defined by the criteria of Ley et al. (Reference Ley, Lees and Stevenson17). Abdominal fat was obtained from the analysis of a region of interest positioned with the lower horizontal border on top of the iliac crest and the upper border approximately parallel with the junction of the T12 and L1 vertebrae. The sides of this region were adjusted to include the maximum amount of abdominal tissue. A region of interest of identical height placed over the thighs with the upper horizontal border positioned immediately below the ischial tuberosities was used to obtain the fat content of the thighs. The lateral margins were adjusted to follow the shape of the thighs.
Appendicular skeletal muscle mass
Appendicular skeletal muscle mass (ASMM) was derived from the DXA scans as total limb mass minus the sum of limb fat and wet bone mass, estimated as BMC divided by 0·55. In this model, mass of the skin and associated dermal tissues is assumed to be negligible relative to the skeletal muscle component(Reference Heymsfield, Smith and Aulet18).
Leg length
Total subject skeletal, femoral and tibial lengths were measured on the right side using the pixelated DXA image. Total skeletal length (DXA height) was measured as the distance from the apex of the cranium to the plantar surface of the calcaneus bone. Femur bone length was measured from top of the femoral head (greater trochanter) to middle patellar surface, and tibia bone length was measured from the superior intercondylar eminence to the inferior surface medial malleolus. Dimensions were measured in pixels and converted to centimetres based on a DXA scan of a standard ruler. Leg length was determined as the sum of the lengths of the femur and tibia bones. The ratio of leg length to DXA height was used as an index of relative leg length.
Statistical analysis
The results are expressed as means and standard deviations, unless stated otherwise. Between-group differences in subject characteristics were tested using one-way ANOVA followed by pairwise comparisons using Tukey's multiple comparison procedure if a significant F test was obtained. Analysis of covariance (ANCOVA) was used to adjust body composition results for comparison across ethnic groups. Before carrying out the ANCOVA, similarity of regression slopes among the ethnic groups was verified by examining the significance of the interaction between the covariate(s) and the group variable. Relationships between body composition measurements and age were investigated by multiple regression analysis controlling for independent variables such as height and weight. Potential interaction terms and non-linear relationships were examined for selected variables. Pearson's correlation coefficients are presented for bivariate linear relationships with age and partial correlation coefficients where adjustment is made for weight and height. Data were analysed using SPSS version 13.0 (SPSS, Inc., Chicago, IL, USA). Results with P < 0·05 were considered significant.
Results
Demographics and whole-body composition
Body composition characteristics of the subjects are summarised by sex and ethnicity in Table 2. European men were younger, taller and had lower FM and percentage of BF than their counterparts in the other three groups. European women were younger than Asian Indian women, and were taller and had lower FM and percentage of BF than their counterparts in the other three groups. The Asian Indian men had lower body weight and BMC but higher percentage of BF than the European, Maori and Pacific men. The Asian Indian women also had the highest percentage of BF and the lowest BMC of the four ethnic groups, while their body weight was lower than Maori and Pacific women and not significantly different from the European women. After adjustment for age, height and weight, Asian Indians had the highest FM, lowest fat-free mass and lowest BMC of the four ethnic groups, while Pacific had the lowest FM and highest fat-free mass, for both men and women, and the highest BMC for men (Table 3).
(Mean values, standard deviations and ranges)

FM, fat mass; FFM, fat-free mass; BMC, bone mineral content; AbFM, abdominal FM; ASMM, appendicular skeletal muscle mass.
* Mean value was significantly different from that of the European group (P < 0·05).
† Mean value was significantly different from that of the Maori group (P < 0·05).
‡ Mean value was significantly different from that of the Pacific group (P < 0·05).
(Mean values with their standard errors)

FFM, fat-free mass; FM, fat mass; BMC, bone mineral content; ASMM, appendicular skeletal muscle mass; AbFM, abdominal FM.
* Mean value was significantly different from that of the European group (P < 0·05).
† Mean value was significantly different from that of the Maori group (P < 0·05).
‡ Mean value was significantly different from that of the Pacific group (P < 0·05).
§ Adjusted for age only.
Relationships between BMI and percentage of body fat
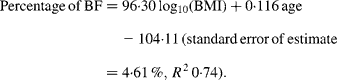
Curvilinear relationships between the percentage of BF and BMI for each ethnic group were linearised by logarithmically transforming BMI (Fig. 1). Comparison of regression equations of the percentage of BF on the logarithm of BMI with age as a covariate and with sex and ethnicity as group variables indicated significant heterogeneity in the slopes of the male and female equations (P < 0·0001). Men and women were therefore analysed separately. For men, the slope for the Europeans was steeper than that for Pacific (P = 0·023) and Asian Indians (P = 0·0008) but similar to Maori (P = 0·09). For European and Maori men, ANCOVA showed significantly different intercepts for the regression lines (P = 0·03) and the common slope regression equation was:
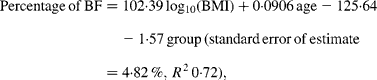
where group is coded as 0 for European and 1 for Maori.
Relationship between the percentage of body fat (BF) and BMI of European (●), Maori (○), Pacific Island (▲) and Asian Indian (△) (a) men and (b) women. The linear regressions are: percentage of BF = 117·7 log10(BMI) − 144·2 (standard error of estimate (SEE) = 5·2 %, r 2 0·61, n 124) for European men (—); percentage of BF = 101·3 log10(BMI) − 122·0 (SEE = 4·6 %, r 2 0·74, n 109) for Maori men (- - -); percentage of BF = 93·6 log10(BMI) − 113·6 (SEE = 4·1 %, r 2 0·68, n 104) for Pacific Island men (·····); percentage of BF = 78·6 log10(BMI) − 79·4 (SEE = 5·0 %, r 2 0·52, n 117) for Asian Indian men (-·-·); percentage of BF = 103·5 log10(BMI) − 109·7 (SEE = 4·8 %, r 2 0·72, n 186) for European women (—); percentage of BF = 74·8 log10(BMI) − 70·3 (SEE = 3·9 %, r 2 0·72, n 90) for Maori women (---); percentage of BF = 65·2 log10(BMI) − 57·8 (SEE = 4·1 %, r 2 0·65, n 97) for Pacific Island women (·····); percentage of BF = 71·0 log10(BMI) − 57·7 (SEE = 4·4 %, r 2 0·60, n 107) for Asian Indian women (-·-·).

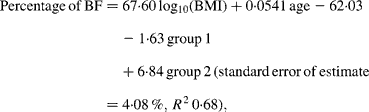
While no significant difference was found between the slopes of the regressions for Pacific and Asian Indian men (P = 0·13), ANCOVA showed their intercepts to be significantly different (P < 0·0001). The common slope regression equation for these two groups was:
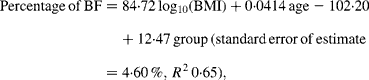
where group is coded as 0 for Pacific and 1 for Asian Indian. Age was retained in this model but was borderline significant (P = 0·051). At a BMI of 30 kg/m2 for European, the predicted percentage of BF (29 %) equates to a BMI of 31 kg/m2 for Maori, 34 kg/m2 for Pacific and 24 kg/m2 for Asian Indian men at the average ages of these respective ethnic groups (Table 4). Inclusion of BMC reduced the difference in the percentage of BF at fixed BMI and age between European and Maori to a non-significant 1·2 % (P = 0·09) and increased R 2 to 0·75, and that between Pacific and Asian Indian from 12·5 to 9·2 % (P < 0·0001) and increased R 2 to 0·71.
Comparison of European BMI and the corresponding percentage of body fat (BF) with estimated BMI equivalents for Maori, Pacific and Asian Indians derived from the equations relating BMI to the percentage of BF and age
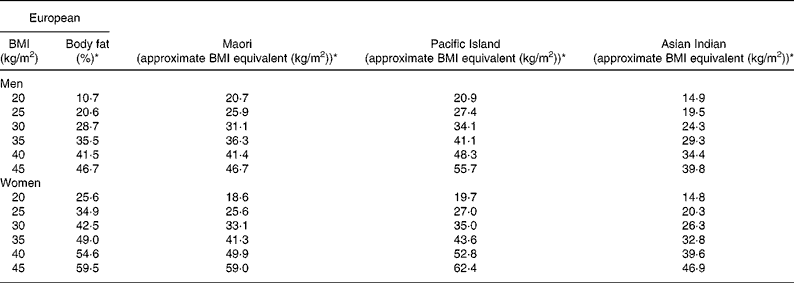
* The percentage of BF and BMI equivalents calculated at the average age for each ethnic group.
For women, the slope for the Europeans was steeper than that for all three other ethnic groups (all P < 0·001). The regression equation for European females alone was:
For Maori, Pacific and Asian Indian women, no significant difference was found between the slopes of the regressions (P = 0·14), but ANCOVA showed their intercepts to be significantly different (P < 0·0001). The common slope regression equation for these ethnic groups was:
where group 1 is coded as 0 for Maori, 1 for Pacific and 0 for Asian Indian, and group 2 is coded as 0, 0 and 1 for these respective ethnic groups. At a BMI of 30 kg/m2 for European women, the predicted percentage of BF (43 %) equates to a BMI of 33 kg/m2 for Maori, 35 kg/m2 for Pacific and 26 kg/m2 for Asian Indian women at the average ages of these respective ethnic groups (Table 4). Significant ethnicity effects remained in this model after the addition of BMC and this variable increased R 2 to 0·70.
Appendicular skeletal muscle mass
For both men and women, the highest ASMM was seen in the Pacific group and the lowest ASMM in the Asian Indians, both before (Table 2) and after adjustment for age, height and weight (Table 3). ASMM did not differ between Maori and European men or women after adjustment. Inclusion of ASMM in the percentage of BF–BMI regression models did not completely eliminate the ethnic differences. For men, ASMM reduced the difference in the percentage of BF at fixed BMI and age between European and Maori from 1·6 to 1·2 % (P = 0·044) and between Pacific and Asian Indian from 12·5 to 7·5 % (P < 0·0001), and increased R 2 to 0·81 for both models. ASMM added to the model for Maori, Pacific and Asian Indian women eliminated the difference in the percentage of BF at fixed BMI and age between Maori and Pacific (P = 0·39) but not between Maori and Asian Indian (P < 0·0001), which decreased from 6·8 to 4·2 %. R 2 for this model was 0·79.
Fat distribution
After adjustment for age, height and weight, abdominal FM was higher in Asian Indians than the other ethnic groups for both men and women with Pacific having the lowest values (Table 3). The same pattern was seen for adjusted thigh FM. As a proportion of total BF, abdominal fat was the lowest in Europeans and the highest in Asian Indians, while thigh fat was significantly higher in Europeans than the other ethnic groups (Table 2). The ratio of abdominal to thigh FM was the highest in Asian Indian men and the lowest in European men, while in women, this ratio was also the lowest in the Europeans with Asian Indians having a lower value than Pacific and not significantly different from Maori (Table 2). After adjusting this ratio for age, the same patterns were observed (Table 3). Inclusion of abdominal and thigh FM in the percentage of BF–BMI regression models did not completely eliminate the ethnic differences. For men, these variables reduced the difference in the percentage of BF at fixed BMI and age between European and Maori from 1·6 to < 1 % and increased R 2 to 0·93, and between Pacific and Asian Indian from 12·5 to 3·3 % (P < 0·0001) and increased R 2 to 0·90· Abdominal and thigh FM added to the model for Maori, Pacific and Asian Indian women eliminated the difference in the percentage of BF at fixed BMI between Maori and Pacific (P = 0·60), but not between Maori and Asian Indian (P < 0·0001), which decreased from 6·8 to 3·6 %. R 2 for this model was 0·86.
Leg length
Leg length, adjusted for height, age and weight, did not differ significantly between European, Maori and Asian Indian men and was shorter than that observed in Pacific men (Table 2). In women, adjusted leg length was the shortest in Maori and the longest in Pacific and Asian Indian with European having an intermediate value. Leg length and height when added to the percentage of BF–BMI regression models did not significantly affect the ethnic differences observed.
Variation with age
Age dependence of the percentage of BF, ASMM, abdominal fat (as a percentage of total fat) and the ratio of abdominal to thigh fat was examined by multiple regression analysis. These variables are shown in Figs. 2 and 3 as means for each decade of age and for each ethnicity-sex subgroup. Within each subgroup, ASMM associations with age were examined after controlling for weight and height. The percentage of BF increased linearly with age in European (r 0·33, P = 0·0002) and Maori (r 0·38, P < 0·0001) men, and in European (r 0·44, P < 0·0001), Maori (r 0·31, P = 0·003) and Pacific (r 0·46, P < 0·0001) women. In Asian Indian women, there was a weak dependence on age (r 0·21, P = 0·026), while in Asian Indian men the percentage of BF was independent of age (r 0·01, P = 0·97). In Pacific men, the dependence on age was quadratic (P = 0·006 for age2 term) with the percentage of BF reaching a maximum at age 49.
Mean percentage of body fat and appendicular skeletal muscle mass (adjusted for weight and height within each ethnic group) by decade of age for European (○), Maori (●), Pacific (△) and Asian Indian (▲) (a) men and (b) women. Error bars indicate the standard error of the mean. The number of subjects in each group is reported in Table 1.

Mean abdominal fat as the percentage of total body fat and ratio of abdominal to thigh fat by decade of age for European (○), Maori (●), Pacific (△) and Asian Indian (▲) (a) men and (b) women. Error bars indicate the standard error of the mean. The number of subjects in each group is reported in Table 1.

ASMM, after controlling for weight and height, decreased linearly with age in European (r − 0·29, P = 0·0012) and Maori (r − 0·39, P < 0·0001) men and European (r − 0·32, P < 0·0001) and Maori (r − 0·34, P = 0·0012) women. A significant age dependence was not seen in Pacific men and women (r − 0·17, P = 0·10 for both) nor in Asian Indian men (r − 0·13, P = 0·18) and women (r 0·01, P = 0·9).
Abdominal fat (as a percentage of total fat) increased linearly with age in European (r 0·65, P < 0·0001) and Asian Indian (r 0·69, P < 0·0001) men, and in European (r 0·55, P < 0·0001), Pacific (r 0·68, P < 0·001) and Asian Indian (r 0·47, P < 0·0001) women. In Maori and Pacific men, the dependence on age was quadratic (P = 0·002 and P = 0·0002, respectively, for age2 term) with the percentage of abdominal fat reaching a maximum at ages 61 and 59 years, respectively. In Maori women, the dependence on age followed a cubic pattern (P = 0·024 for age3 term).
The ratio of abdominal to thigh fat increased linearly with age in European (r 0·68, P < 0·0001) and Asian Indian (r 0·58, P < 0·0001) men and in the women of all ethnic groups (r 0·58, P < 0·0001 for European; r 0·40, P = 0·0001 for Maori; r 0·70 and r 0·44, both P < 0·0001, for Pacific and Asian Indian). In Maori and Pacific men, the dependence on age was quadratic (P = 0·002 and 0·010, respectively, for age2 term) with this ratio reaching a maximum at ages 61 and 68 years, respectively.
Discussion
The present study is the first detailed comparison of the body composition of European, Maori, Pacific Island and Asian Indian men and women across the adult age range. Limited analysis of subgroups of these data has appeared previously(Reference Swinburn, Ley and Carmichael19–Reference Rush, Goedecke and Jennings22). A wide disparity is seen in the BF–BMI relationship between, on the one hand, Pacific people, who could be argued to be the largest people in the world(Reference Coyne23), and, on the other hand, Asian Indians, who appear to have the most fat(Reference Yajnik24). For example, at a fixed percentage of BF corresponding to a BMI of 30 kg/m2 for Europeans (29 % BF for men, 43 % BF for women), Pacific BMI values were up to 5 units higher and Asian Indian up to 6 units lower, a span of 11 BMI units. For a BMI of 30 kg/m2, BF in Pacific men was 25 % and in Asian Indian men 37 %, while in women these fatness levels were 38 and 47 %, respectively. The second main finding of this work was that Asian Indians had higher fat levels, both total and in the abdominal region, with lower lean mass, skeletal muscle and bone mineral levels than all other ethnic groups. Third, Pacific men and women had longer legs than their European counterparts, while for Asian Indians, leg length was similar to Europeans in men and longer than Europeans in women. Fourth, with increasing age, while the percentage of BF in Asian Indians showed little change, there was a shift in the distribution of this fat to the abdominal area. In other ethnic groups, and particularly in women, increasing levels of abdominal fat with age were coupled with increasing total BF.
Results for Pacific and Maori have been compared with Europeans in earlier reports(Reference Swinburn, Ley and Carmichael19, Reference Swinburn, Craig and Daniel25) and the New Zealand Ministry of Health presently adopts BMI thresholds of 26 and 32 kg/m2 for overweight and obesity in Pacific and Maori adults. The present results for Asian Indians add further evidence for re-examination of the BMI thresholds for overweight and obesity as they apply to this ethnic group. They confirm the findings from the studies conducted in other Asian Indian migrant groups(Reference Deurenberg-Yap, Schmidt and van Staveren26). The WHO BMI classifications of overweight ( ≥ 25 kg/m2) and obesity ( ≥ 30 kg/m2), although intended for international use, are based on the relationship between BMI and cardiovascular morbidity in Western populations(1). Based on the percentage of BF levels, a BMI of 26 kg/m2 has been suggested as an obesity cut-off point in Asian Indians equivalent to that for Europeans(Reference Deurenberg-Yap, Schmidt and van Staveren26). A WHO Expert Consultation(16) identified BMI ≥ 23 kg/m2 and ≥ 27·5 kg/m2 as trigger points for public health action for many Asian populations, these cut-offs representing increased and high risks, respectively, for adverse health outcomes. More studies are required to define the ‘healthy’ BMI range for Asian Indian and Pacific Island people on the basis of risk for obesity-related diseases. Compared with their European counterparts with the same BMI, migrant Asian Indian populations are found to be relatively hyperinsulinaemic and insulin resistant(Reference Simmons and Powell27, Reference Banerji, Faridi and Atluri28), characteristics that may be important in the development of type 2 diabetes and CVD. Indeed, Asian Indians with ‘normal’ BMI ( < 25 kg/m2) have high CVD risk(Reference Deurenberg-Yap, Chew and Deurenberg29, Reference Vikram, Pandey and Misra30). Pacific Islanders in New Zealand, by contrast, are not hyperinsulinaemic relative to the Europeans of the same BMI(Reference Simmons, Thompson and Volklander31), while they have a high prevalence of type 2 diabetes and are believed to have a lower rate of CVD(Reference Tukuitonga, Stewart and Beaglehole32).
We report ethnic-specific muscularity, fat distribution, bone mass and leg length. characteristics that may contribute to the ethnic differences in the relationships between BMI and BF (Reference Deurenberg, Deurenberg Yap and Wang3). Compared with European men of similar weight, height and age, Asian Indians have significantly less skeletal muscle in the limbs, while Pacific have significantly more. Appendicular skeletal muscle is approximately 75 % of total body skeletal muscle mass(Reference Snyder, Cook and Nasset33). We have also shown, by examination of the distribution of fat in our subjects, that Asian Indians have a more central fat deposition pattern than European or Pacific. The propensity for abdominal adiposity found in Asian Indians had been inferred from the measurements of waist-to-hip girth ratios in a number of studies(Reference McKeigue, Shah and Marmot7, Reference Potts and Simmons34). In this population, the association between central obesity and risk for CVD and type 2 diabetes is clearly established(Reference Dhawan, Bray and Warburton9, Reference Raji, Seely and Arky35–Reference Anjana, Sandeep and Deepa37). In both men and women of the present study, the percentage of total fat as abdominal fat was significantly higher in Maori, Pacific and Asian Indians than Europeans. This may explain, in part, the higher prevalence of hypertension and type 2 diabetes found in these ethnic groups compared with Europeans(Reference Simmons, Harry and Gatland14, Reference Baker, Scragg and Metcalf38, 39). Adjustment of the percentage of BF–BMI relationships by the addition of skeletal muscle or fat distribution variables (abdominal and thigh fat) reduced, but did not eliminate, the ethnic effects. While Asian Indians had lower bone mineral mass than all other ethnic groups, this variable did not alter substantively the ethnic specificity of the BF–BMI relationships. Leg length appears to be the component of height most strongly associated with disease risk, with longer legs associated with lower blood pressure, cholesterol levels and insulin resistance, as well as lower BMI(Reference Smith, Greenwood and Gunnell40, Reference Gunnell, Whitley and Upton41). Individuals with long legs relative to their height have a lower BMI than those with short legs, irrespective of fat content(Reference Norgan42). The ethnic differences we observed, however, in the BF–BMI relationships were not altered significantly by adjusting for leg length. Further analysis in which the BF–BMI relationships were adjusted simultaneously by skeletal muscle, fat distribution, bone mass and leg length also did not eliminate the significant difference between Asian Indians and the other ethnic groups, although reduced substantially to < 2·5 % (absolute percentage of BF) for fixed BMI and age.
A curvilinear dependence of body fatness on age (20–80+ years) was observed in American whites, blacks and Asians with peak percentage of BF occurring about age 60 years for blacks and Asians and age 70 years for whites(Reference Mott, Wang and Thornton43). Asians in that study were likely to be predominantly Japanese, Chinese and Korean. Such curvilinearity was seen in Pacific men in the present study, but not in European or Maori where the number of subjects >70 years was limited. The pattern of change in Asian Indian men was markedly different and we do not have an explanation for this observation. Published data for age-related changes in skeletal muscle mass are sparse, but it is generally believed that beyond the age of 30–40 years muscle mass declines with age. Whole-body MRI studies of predominantly Caucasian subjects confirmed this observation(Reference Janssen, Heymsfield and Wang44) and DXA studies in Caucasian and African American adults(Reference Gallagher, Visser and De Meersman45) showed that ASMM, adjusted for height and weight, decreased linearly with age in both ethnic groups at about 0·8 kg/decade in men and about 0·4 kg/decade in women. The present results for European and Maori are in agreement(Reference Gallagher, Visser and De Meersman45) with the rates of loss of appendicular muscle approximating 0·5–0·8 kg/decade in men and 0·4–0·5 kg/decade in women. However, only a weak linear trend was seen for Pacific and Asian Indians; ASMM was preserved to at least age 65. In men and women of all ethnic groups, abdominal fat (as a percentage of total fat) and the ratio of abdominal to thigh fat were strongly age dependent. For European and Pacific, between the third and seventh decades, the percentage of abdominal fat increased by 40–55 % and abdominal-to-thigh fat ratio by 75–105 %. Recently, published work in a large multi-ethnic population(Reference Wu, Heshka and Wang46) has shown that DXA-derived trunk fat also accumulates with age. The cross-sectional nature of all these studies, including the present one, is a limitation and definitive conclusions relating to changes in body composition with age must await large-scale longitudinal studies.
Strengths of the present study include the application of a well-validated body composition methodology and the same machine for all measurements. However, validation of the DXA technology against multi-compartment models has generally been carried out in Caucasian populations. We are not aware of any published studies in adults investigating the potential effects of ethnicity on the DXA-derived body composition results. In a multi-ethnic study of children and adolescents, the relationship between the percentage of BF by DXA and that from a four-compartment model was shown to be independent of ethnicity(Reference Sopher, Thornton and Wang47). The limitations of the DXA technology are that it cannot accommodate the very obese and cannot distinguish between subcutaneous and visceral fat deposits in the abdominal region, which may be independent predictors of disease risk(Reference Lovejoy, de la Bretonne and Klemperer48). Our measure of central fat was based on an abdominal region of interest deliberately chosen to avoid significant interference from the bone pixels that may affect the accuracy of the separation of non-bone tissue into fat and lean components. A primary purpose of the present work was to examine the relationships between body size and fatness for which we sought, at least in the non-European groups, a uniform age distribution and wide range of BMI rather than representativeness of the wider populations.
In conclusion, the present study demonstrates the marked differences in body build, body composition and fat distribution, which characterise New Zealanders of European, Maori, Pacific Island and Asian Indian ancestry. These differences go some way towards explaining the observed wide variation in the relationships between BMI and percentage of BF. Particularly notable are the marked differences between Asian Indians and Europeans. The higher fat levels, both total and central, and the apparent shift in fat distribution to the abdominal region with ageing that we observed in Asian Indians may have important implications for their risk of obesity-related diseases. Asian Indians are a rapidly growing segment of the New Zealand population and their body composition characteristics distinguish them from other Asian subgroups(16, Reference Deurenberg-Yap, Schmidt and van Staveren26). It is important that in New Zealand, as in other countries with significant migrant Asian populations, this distinction is acknowledged by public health policymakers. The present results emphasise the inadequacy of universal BMI cut-off points for the determination of the percentage of BF and obesity and the need for further studies to relate morbidity and mortality risk to ethnic-specific criteria for the determination of obesity in epidemiological and public health settings.
Acknowledgements
We thank Sarah Ley, Heather Carmichael and Vishnu Chandu for assistance with recruitment and measurements. Prof. Boyd Swinburn kindly provided some of the data. Manaia Laulu and Ljiljana Jovanovic contributed to the regional analysis. This work was supported, in part, by the Ministry of Health and the Health Research Council of New Zealand and the Auckland University of Technology Contestable Research Fund. None of the authors has a conflict of interest in relation to the work presented in the present paper. E. C. R. helped in designing the study, assisted with data collection and analysis, and wrote the manuscript; I. F. assisted with the analysis of the data and edited the manuscript and L. D. P. helped in designing the study, assisted with recruitment, data collection, analysis and interpretation, and edited the manuscript.


