


I. INTRODUCTION
Early-stage diagnosis techniques play a vital role to fight against fatal diseases and infections reliably with minimal costs for improved treatment outcomes. ‘Biosensor’ is one of the major advances in the field of healthcare science to eliminate emerging health issues and find solution to many chronic diseases like cancer, heart disease, epilepsy, Alzheimer’s disease, diabetes, asthma, allergy, angina, urethral stones, dementia etc. It can effectively serve as a low cost and highly efficient tool that uses biological entities like tissues, microorganisms, enzymes, antibodies, nucleic acids (NA) (DNA and RNA), cell receptors, synthetic ligands etc. to quickly, accurately, and reliably detect analyte molecules for medical diagnostics, environmental monitoring, defense, and food industry. Reference Mohanty and Kougianos1–Reference Soper and Rasooly5
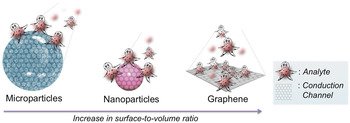
Integrating nanotechnology with biosensors has a huge potential over conventional methods, including high-throughput screening, low limit of detection (LOD), real-time analysis, label-free detection and less sample volume requirement to be analyzed, among others. In the quest toward biosensors, different nanomaterials in conjugation with biological molecules have been proposed and investigated due to their quantum size effect. Reference Gs, Cv and Mathew6,Reference Nehra and Pal Singh7 Among these nanomaterials, metallic nanomaterials, silica nanoparticles (NPs), dendrimers, quantum dots (QDs), polymer NPs, carbon nanotubes (CNTs), nanodiamonds (NDs), and 2D-nanomaterials [graphene, hexagonal-boron nitride (h-BN), transition metal dichalcogenides (TMDs) such as niobium selenide (NbSe2), molybdenum disulfide (MoS2), and tungsten disulfide (WS2)] are highly studied and have significantly contribution to biosensor development. Reference Holzinger, Le Goff and Cosnier8–Reference Kaul12 In particular, graphene is the most promising nanostructured carbon material that is used in the bioanalytical area and has stimulated intense research as it possesses an excellent combination of enhanced specific surface area, electrical conductivity, chemical stability, ease of manipulation and biocompatibility, thus, providing more specific sites to capture foreign moieties with high sensitivity. In addition, it is resistant to the harsh ionic solutions found in body. Reference Geim and Novoselov13,Reference Ferrari, Bonaccorso, Fal’ko, Novoselov, Roche, Bøggild, Borini, Koppens, Palermo, Pugno, Garrido, Sordan, Bianco, Ballerini, Prato, Lidorikis, Kivioja, Marinelli, Ryhänen, Morpurgo, Coleman, Nicolosi, Colombo, Fert, Garcia-Hernandez, Bachtold, Schneider, Guinea, Dekker, Barbone, Sun, Galiotis, Grigorenko, Konstantatos, Kis, Katsnelson, Vandersypen, Loiseau, Morandi, Neumaier, Treossi, Pellegrini, Polini, Tredicucci, Williams, Hong, Ahn, Kim, Zirath, van Wees, van der Zant, Occhipinti, Matteo, Kinloch, Seyller, Quesnel, Feng, Teo, Rupesinghe, Hakonen, Neil, Tannock, Löfwander and Kinaret14 Fig. 1 demonstrates the concept of surface interaction in micro- and nano-particles and graphene with analyte molecules. As the dimensions of the particle decreases from micro to nanometer regime to particularly graphene, the surface-to-volume ratio and conduction channel area increases drastically. For micro and nanoparticles, only a part of their volume is exposed to the analyte molecule, and therefore minimizing the sensing effect. On the other hand, the planar topology of graphene offers enhanced specific surface area and allows even a single molecule to be captured. Consequently, the electron transport pathway through graphene becomes highly sensitive to the adsorbed molecules and makes it more apt for low-level detection. Reference Ferrari, Bonaccorso, Fal’ko, Novoselov, Roche, Bøggild, Borini, Koppens, Palermo, Pugno, Garrido, Sordan, Bianco, Ballerini, Prato, Lidorikis, Kivioja, Marinelli, Ryhänen, Morpurgo, Coleman, Nicolosi, Colombo, Fert, Garcia-Hernandez, Bachtold, Schneider, Guinea, Dekker, Barbone, Sun, Galiotis, Grigorenko, Konstantatos, Kis, Katsnelson, Vandersypen, Loiseau, Morandi, Neumaier, Treossi, Pellegrini, Polini, Tredicucci, Williams, Hong, Ahn, Kim, Zirath, van Wees, van der Zant, Occhipinti, Matteo, Kinloch, Seyller, Quesnel, Feng, Teo, Rupesinghe, Hakonen, Neil, Tannock, Löfwander and Kinaret14
Schematic design representing the concept of ‘influence of surface-to-volume ratio’ on enhanced surface interactions between analyte molecules and different particle systems (microparticle, nanoparticle, and graphene) that eventually affects the overall electron conduction mechanism.
There are already several excellent reviews focusing on the synthesis, properties, and biosensing performance of graphene and its derivatives for biomedical applications. Reference Feng, Wu and Qu15–Reference Zhu, Liu, Li, Nie and Li25 Yet many obvious questions arise if we think of a perfect graphene-based biosensor that needs to be discussed: What makes graphene a sensitive detector for biological molecules? Does the method of production and assembly of graphene affects its biosensing performance? Is graphene actually selective to differentiate molecules embedded on it? Is it possible to precisely control and detect how many molecules have been spontaneously captured by it? Can graphene be considered as a reliable material to be used in future lab-on-chip and implantable medical devices for real-time health monitoring? What are the other factors that can contribute to the successful commercialization of graphene for in vivo and in vitro biosensing applications?
In this review, we will briefly highlight the relevant properties and assembly techniques for graphene in the context of biosensing and basic working mechanism of the available biosensor systems. We aim to answer the questions raised above along with the discussion on the more significant conceptual advances that have been made for clinical diagnosis and real-time molecular detection by nano-electronics, microfluidics, and nanosensors. Finally, we compare different techniques and present our views on the future developments and some critical challenges in this field.
II. GENERAL CONCEPTS
A. Brief history of biosensors
‘Biosensor’ is a very broad field and known to have many terminologies and definitions that entirely depend on the method of transduction (i.e., optical, mechanical, or electrical) or the bio-receptor used [i.e., catalytic (enzyme) or affinity based (aptamer, antibody, lectin, bacteriophages etc.)]. Amperometric sensor, immunosensor, DNA biosensor, piezo-electric sensor, optical biosensor, thermal sensor, etc. are some common terms, which are quite often used. In a simplified way, a ‘biosensor’ can be defined as a bioanalytical device that directs a biological response from a bio-receptor to an electronic component for the generation of a quantifiable signal to detect a specific molecule with high specificity.
The journey of biosensors began in 1962, when Leland C. Clark Jr. and Cham Lyon demonstrated the first biosensor. Reference Clark and Lyons26 Their concept of glucose enzyme electrodes enabled millions of diabetic patients to monitor their own blood sugar level. To prove their vision, they performed an experiment in which a thin layer of glucose oxidase (GOx) was entrapped at a Clark oxygen electrode by a semipermeable dialysis membrane. A decrease in oxygen concentration was found to be proportional to glucose concentration. Reference Clark and Lyons26 The catalytic reaction performed by enzyme GOx (a bio-receptor) is as follows:
 $${\rm{Glucose}} + {{\rm{O}}_2}\buildrel {{\rm{GOx}}} \over \longrightarrow {\rm{Gluconic\ acid}} + {{\rm{H}}_2}{{\rm{O}}_2}\quad .$$
 $${{\rm{O}}_2} + 4{{\rm{H}}^ + } + 4{{\rm{e}}^ - } \to 2{{\rm{H}}_2}{\rm{O}}\quad {\rm{.}}$$
This discovery provoked many researchers from various disciplines including electronics, material science, physics, chemistry, and biomedical sciences to integrate and find innovative detection strategies for healthcare applications. Since then the field of biosensor has grown enormously with many breakthrough findings by coupling different bioelements and sensor elements for variety of applications. Reference Pandey, Datta and Malhotra27–Reference Ghafar-Zadeh30
The advent of graphene in 2004, accelerated the biosensor research by adding new-dimensions in terms of high loading efficiency, good stability, biocompatibility, fast response time, low production cost, and consistent signal amplification even under the harsh environmental conditions that brings important advantages over many other nanomaterials. A myriad of biological and chemical species such as proteins, viruses, bacteria, DNA, lipids, peptides, antibodies, metal ions etc. have been successfully detected by various graphene-based biosensing strategies. Consequently, graphene continues to be a focus of research for the futuristic goal of multiplexed clinical diagnostic biosensors to provide early detection of many deadly diseases, which are addressed in the upcoming sections. Figure 2 provides a schematic overview of numerous tactics involved in graphene-based biosensor to detect a binding event between a biomolecule and a bio-receptor. This includes, (i) nanosensors which involves nanomechanics, piezoelectric, electrochemical or optical schemes, (ii) microfluidic system and (iii) nanoelectronics approach that comprises of FET configurations.
Schematic illustration of the sensing tactics involved in a graphene-based biosensor for in vitro and in vivo applications.

B. Why graphene in biosensing?
1. Graphene derivative—its properties, production and assembly relevant to biosensing platform
Soon after the first isolation of graphene in 2004 by Professor Andre Geim and Konstantin Novoselov, Reference Novoselov, Geim, Morozov, Jiang, Zhang, Dubonos, Grigorieva and Firsov31 it has been considered as a versatile material owing to its 2D planar structure. It has excelled in wide range of potential applications like electronic devices, photonics and optoelectronics, medical diagnostics and drug delivery, sensors, flexible electronics, energy storage, nanocomposites, spintronics, etc. In particular, the integration of graphene and its derivatives with such remarkable properties in biosensor modules offers great opportunities to better identify and track the specific analytes. Reference Ferrari, Bonaccorso, Fal’ko, Novoselov, Roche, Bøggild, Borini, Koppens, Palermo, Pugno, Garrido, Sordan, Bianco, Ballerini, Prato, Lidorikis, Kivioja, Marinelli, Ryhänen, Morpurgo, Coleman, Nicolosi, Colombo, Fert, Garcia-Hernandez, Bachtold, Schneider, Guinea, Dekker, Barbone, Sun, Galiotis, Grigorenko, Konstantatos, Kis, Katsnelson, Vandersypen, Loiseau, Morandi, Neumaier, Treossi, Pellegrini, Polini, Tredicucci, Williams, Hong, Ahn, Kim, Zirath, van Wees, van der Zant, Occhipinti, Matteo, Kinloch, Seyller, Quesnel, Feng, Teo, Rupesinghe, Hakonen, Neil, Tannock, Löfwander and Kinaret14
a. Structure
When graphite is isolated to individual graphite layers that are held together by van der Waal forces, a new entity emerges that is termed as ‘graphene’. Typically, each layer of graphite having a thickness of 0.35 nm comprises of sp 2-bonded carbon atoms arranged in a hexagonal network with carbon–carbon bond length of 1.42 Å and exhibit unique morphological properties. Reference Castro Neto, Guinea, Peres, Novoselov and Geim32 The 2D graphene can also be considered as a new carbon allotrope that is the basic building block for all other carbon allotropes, which can be stacked to form 3D graphite, rolled up to form 1D CNTs and can be wrapped to generate 0D fullerenes. Reference Geim and Novoselov13 All the chemical derivatives of graphene including graphene-oxide (GO), reduced-GO (rGO), few-layer graphene (FLG), wrinkled graphene (WG), rGO hybridized with NPs, fluorographene (FG), hydrogenated graphene (HG), nano-size GO mainly termed as graphene quantum dots (GQDs) etc. [as depicted in Fig. 3(a)] are useful and broadly applied as a component or as a constituent for biosensors, real-time bioimaging, cancer diagnosis and treatment, catalysis, water purification, etc. Reference Feng, Wu and Qu15,Reference Morales-Narváez and Merkoçi33–Reference Urbanová, Karlický, Matěj, Šembera, Janoušek, Perman, Ranc, Čépe, Michl, Otyepka and Zbořil38
(a) Graphene and its derivatives facilitating biosensing platform. (b) Hexagonal honeycomb lattice of graphene with two atoms (A and B) per unit cell. (c) The 3D band-structure of graphene. (d) Dispersion of the states of graphene. (e) Approximation of the low energy band-structure as two cones touching at a single point (called Dirac point). The position of the Fermi level determines the nature of the doping and the transport carrier. (b–e) Adapted with permission from Ref. Reference Avouris39 Copyright (2010) American Chemical Society.

b. Large specific area
Being a single layer of carbon atoms, the lateral dimensions of graphene can range from few nanometers to several microns. It has an exceptionally high surface to mass ratio (specific surface area) with theoretical value of ∼2600 m2/g. Reference Zhu, Murali, Cai, Li, Suk, Potts and Ruoff40 With such remarkable physical properties, it can go down up to single molecule detection potentially by affecting its percolation threshold and electrical properties significantly (as discussed earlier in Fig. 1). Consequently, making it an attractive nanomaterial, which is expected to have a bright future for sensor applications.
c. Electronic transportation
The characteristic electronic properties of graphene are the result of its band structure that requires the understanding of its crystal lattice structure. Each carbon atom with its one s and two in-plane p orbitals forms a strong sp 2 covalent bond with three neighboring carbon atoms providing strength to the graphene hexagonal structure that offers the longest ‘mean free path’ on the order of several microns amongst any known nanomaterial. ‘Mean free path’ is the distance that an electron can travel freely without any scattering with virtually no resistance and generating almost negligible amount of heat. Graphene obeys Dirac’s equation instead of the traditional Schrödinger equation. Reference Weiss, Zhou, Liao, Liu, Jiang, Huang and Duan41 Figs. 3(b)–3(d) represents the electronic structure of graphene that exhibits degeneration of the valance and the conduction band at the Dirac point. Reference Avouris39 It has been shown to have high carrier mobility of 15,000 cm2/(V s) at 300 K and intrinsic mobility of 200,000 cm2/(V s) (for freely suspended graphene). Reference Du, Skachko, Barker and Andrei42–Reference Morozov, Novoselov, Katsnelson, Schedin, Elias, Jaszczak and Geim44 So, even when a single biomolecule comes in contact with graphene surface it can modulate the electrical properties of graphene by means of either n or p-type doping, surface charge induced gating, Schottky-barrier modification (between the metal and graphene) or scattering potential across it [Fig. 3(e)]. Therefore, makes graphene a perfect candidate for various electronic transport dependent applications.
d. Ease of functionalization
Being hydrophobic Reference Georgakilas, Tiwari, Kemp, Perman, Bourlinos, Kim and Zboril45 in nature and having a tendency to form agglomerates in most of the solvents due to van der Waal forces (which are induced by π–π interactions between the individual graphene planes), graphene has an important feature that it can be easily modified with a variety of chemical groups and biomolecules to endow it with high colloidal stability in a physiological environment, finely tune its band gap, provide high site-specific targeting capability, enhanced loading capacity, and biocompatibility. It was observed that functionalization of graphene alters its sp 2-hybridization to sp 3-hybridization, which directly affects its electronic properties, which is one of the salient features of a suitable biosensor. Reference Georgakilas, Otyepka, Bourlinos, Chandra, Kim, Kemp, Hobza, Zboril and Kim46 Thus, it becomes more essential to have a perfect balance between chemical functionalization and carrier mobility of graphene.
Generally, there can be two kinds of approaches to chemically modify graphene:
i. Covalent functionalization
Chemical moieties can be covalently created on graphene using strong oxidants. Likewise, GO is the result of oxidation of graphite with carboxylic acids (–COOH) at the edges and epoxy (C–O–C) and hydroxyl (–OH) groups on the basal plane that provides good dispersity in hydrophilic or hydrophobic media as well as in organic polymers with long term stability. Reference Georgakilas, Otyepka, Bourlinos, Chandra, Kim, Kemp, Hobza, Zboril and Kim46,Reference Chua and Pumera47 In addition, it inevitably alters the electronic and physical properties of graphene by converting sp 2 carbons to sp 3 ones and disrupts the carrier mobility. Moreover, covalent functionalization of graphene can be achieved by electrophilic addition, condensation, addition or nucleophilic substitution reactions. Reference Mandal, Maitra, Das and Das48 For example, nitrene addition, carbine- and aryne cycloaddition, radical addition with benzoyl peroxide, diazonium modification, or organometallic functionalization.
ii. Non-covalent functionalization
Generally, noncovalent interaction can be classified as electrostatic, van der Waals, π–π or hydrophobic interactions. Reference Mandal, Maitra, Das and Das48 Graphene can be considered as a giant aromatic molecule that can firmly interact with any molecule without the need of any coupling agent. Reference Georgakilas, Otyepka, Bourlinos, Chandra, Kim, Kemp, Hobza, Zboril and Kim46,Reference Allen, Tung and Kaner49 Noncovalent hybrid combination of GO and rGO with polymers and different metal NPs (Ag, Au, and Pt) could facilitate in situ reduction that provides good dispersion in water without disturbing electronic conjugation. With these approaches, graphene properties can be integrated with other nanomaterials like metal NPs, magnetic, metal-oxide, or QDs. ‘Biofunctionalization’ is the advancement of nanoscience and biotechnology that has benefitted graphene by improving its performance as a biosensor in terms of solubility, biocompatibility, and selectivity. Reference Wang, Li, Wang, Li and Lin50
e. Biocompatibility of graphene and its derivatives
When any nanomaterial is considered for biological application, biosafety in cells and live biosystems in terms of some physiological parameters such as adsorption, distribution, metabolism, excretion, and toxicity becomes essential. Now a question arises: Is graphene biocompatible? Does this material offer viable advantages over other nanomaterials? In recent investigations, graphene has shown immense potential beyond its electronic and chemical applications toward biomedical areas like graphene-enhanced cell differentiation and growth, drug/gene delivery for cancer treatment, bio-sensing, DNA sequencing, therapeutics, tissue engineering, stem cell research, and lot more. Reference Ferrari, Bonaccorso, Fal’ko, Novoselov, Roche, Bøggild, Borini, Koppens, Palermo, Pugno, Garrido, Sordan, Bianco, Ballerini, Prato, Lidorikis, Kivioja, Marinelli, Ryhänen, Morpurgo, Coleman, Nicolosi, Colombo, Fert, Garcia-Hernandez, Bachtold, Schneider, Guinea, Dekker, Barbone, Sun, Galiotis, Grigorenko, Konstantatos, Kis, Katsnelson, Vandersypen, Loiseau, Morandi, Neumaier, Treossi, Pellegrini, Polini, Tredicucci, Williams, Hong, Ahn, Kim, Zirath, van Wees, van der Zant, Occhipinti, Matteo, Kinloch, Seyller, Quesnel, Feng, Teo, Rupesinghe, Hakonen, Neil, Tannock, Löfwander and Kinaret14 The in vivo toxicity studies have shown that biocompatibility of graphene and its derivatives greatly depends on its lateral size, dosage, functionalization, charge, and reactive oxygen species. Reference Yang, Li, Tan, Peng and Liu51–Reference Pelin, Fusco, León, Martín, Criado, Sosa, Vázquez, Tubaro and Prato54 GO accumulation can mainly occur in the liver, lungs, spleen, and kidneys. In a study, it is demonstrated that GO can be cleared quickly from the blood stream and accumulation in liver can be eliminated by liver secretion into bile tract system. Reference Wang, Ruan, Song, Zhang, Wo, Guo and Cui55,Reference Schinwald, Murphy, Jones, MacNee and Donaldson56 However, due to the large size (1–5 μm) and 2D structure of GO; it becomes difficult for lungs and kidneys to clear it out, while smaller sizes (110–500 nm) were retained by liver. Reference Liu, Yang, Wang, Chang, Cao and Liu57 Yet many other reports revealed that GO purification via several washing steps, polymeric modifications (such as PEGylated graphene), conjugation strategies through surface modifications, also enhances the biocompatibility and circulation times in vivo. Reference Nurunnabi, Parvez, Nafiujjaman, Revuri, Khan, Feng and Lee37,Reference Guo and Mei58,Reference Xu, Zhu, Wang, Xiong, Wu, Wang, Weng, Zhang, Chen and Liu59 In addition, the genotoxicity of graphene, GO and rGO have also been studied to an extent. While other carbon counterparts like SWCNT and C60 have shown signs of cytotoxicity, genotoxicity, and ROS generation. Reference Jacobsen, Pojana, White, Møller, Cohn, Korsholm, Vogel, Marcomini, Loft and Wallin60 Recently, Bengtsan et al. have reported that under in vitro conditions in FE1 murine lung epithelial cells, rGO with lateral size 1> μm does not induce genotoxicity or ROS generation. Reference Bengtson, Kling, Madsen, Noergaard, Jacobsen, Clausen, Alonso, Pesquera, Zurutuza, Ramos, Okuno, Dijon, Wallin and Vogel61 However, a study under in vivo conditions is highly recommended to fully understand the biological effects. From the literature reviewed, before considering graphene and its derivatives as a ‘biosafe’ material, certain factors should be taken into consideration such as its size distribution, amount of oxygen containing groups which is directly related to the method of production, optimum dosage, its aggregation formation tendency, surface coating etc. Reference Ou, Song, Liang, Liu, Feng, Deng, Sun and Shao53,Reference Yang, Wan, Zhang, Tian, Zhang and Liu62,Reference Morimoto, Kubo and Nishina63
f. Electrochemical behavior of graphene
Additional key feature of graphene is its electrochemical activity. It is highly resistant to many oxidizing agents. With chemically selective functionalization, it can specifically target the analyte and pave the way for the development of biosensors.
g. Good adsorption capability
Graphene is considered as a highly favorable nanoplatform in detecting adsorbed molecules as the entire surface area of graphene is exposed to foreign molecules. Reference Choi, Lahiri, Seelaboyina and Kang64 As discussed in previous sections, with different modes of functionalization it can be made highly selective to capture specific molecules. Typically, graphene does not contain any heterogeneous materials, which is one of the key assets over other nanomaterials like CNT where these heterogeneous materials remain electrochemically active yielding toxicological hazards and a drop in the selectivity and sensitivity of a sensor device. Reference Pumera65
2. Synthesis and assembly approaches toward biosensing platform
So far, numerous routes have been reported for the synthesis of graphene, which can broadly be classified into two categories: (i) top-to-bottom, and (ii) bottom-to-up approaches. Reference Edwards and Coleman66 A top-to-bottom approach involves the split-up of bulk material into single or few-layer sheets by overcoming the van der Waals forces that holds the sheets together as represented in Fig. 4(a). However, bottom-to-up is all about building-up graphene from carbon source on a substrate [Fig. 4(b)].
Schematic representation of (a) top-to-down, (b) bottom-to-up approaches involved in graphene synthesis. (c) Micromechanical cleavage. (d) Anodic bonding. (e) Photo-exfoliation. (f) Liquid phase exfoliation. (g) Growth on SiC. Gold and gray spheres represent Si and C atoms, respectively. At elevated temperatures, Si atoms evaporate (arrows), leaving a carbon-rich surface that forms graphene sheets. (h) Segregation/precipitation from carbon containing metal substrate. (i) Chemical vapor deposition. (j) Molecular beam epitaxy. (k) Chemical synthesis using benzene as building block. (c–k) Adapted with permission from Ref. Reference Bonaccorso, Lombardo, Hasan, Sun, Colombo and Ferrari67 Copyright (2012) Elsevier Ltd.

There are primarily seven recipes [Figs. 4(c)–4(k)] available where ‘top-to-down’ approaches include mechanical cleavage, anodic bonding, photo-exfoliation, liquid-phase exfoliation, arc-discharge, and unzipping of CNTs. Moreover, segregation/precipitation from carbon containing metal substrate, chemical vapor deposition (CVD) growth and molecular beam epitaxial, growth on silicon carbide (SiC), and chemical synthesis using benzene as building block comes under ‘bottom-to-up’ category. Reference Bonaccorso, Lombardo, Hasan, Sun, Colombo and Ferrari67 Each preparation methods has its own pros and cons thus it is essential to select a method of production based on application so that graphene’s potential can be fully realized.
Till now, a massive number of papers and review articles have been published only on the synthesis strategies but still there is no single perfect method that preserves all the salient features of graphene other than high throughput at low cost. Reference Ferrari, Bonaccorso, Fal’ko, Novoselov, Roche, Bøggild, Borini, Koppens, Palermo, Pugno, Garrido, Sordan, Bianco, Ballerini, Prato, Lidorikis, Kivioja, Marinelli, Ryhänen, Morpurgo, Coleman, Nicolosi, Colombo, Fert, Garcia-Hernandez, Bachtold, Schneider, Guinea, Dekker, Barbone, Sun, Galiotis, Grigorenko, Konstantatos, Kis, Katsnelson, Vandersypen, Loiseau, Morandi, Neumaier, Treossi, Pellegrini, Polini, Tredicucci, Williams, Hong, Ahn, Kim, Zirath, van Wees, van der Zant, Occhipinti, Matteo, Kinloch, Seyller, Quesnel, Feng, Teo, Rupesinghe, Hakonen, Neil, Tannock, Löfwander and Kinaret14,Reference Wei and Liu68,Reference Gengler, Spyrou and Rudolf69 Briefly, micromechanical cleavage or ‘peel-off’ method includes thoroughly peeling-off the layers of graphite with a ‘scotch tape’ until an atom thick layer is achieved, which can then be transferred to SiO2 (300 nm)/Si substrate [Fig. 4(c)]. Although this method is impractical for large-scale applications but still it has developed immense interest among the researchers for conducting fundamental studies and proof of principle devices.
‘Anodic bonding’ is a common method utilized for bonding Si wafer to the glass substrate to prevent contamination and humidity. Similar approaches have been followed to separate out graphene from graphite [Fig. 4(d)]. A high voltage (in few kVs) is applied between graphite and a metal back contact and then heated at 200 °C. Cleaving graphite flake leaves behind single or multilayer graphene. By controlling the applied voltage and temperature, sheet size and thickness can be tailored. ‘Photo-exfoliation’ is all about laser beam irradiation on a substrate to detach entire or partial graphene layers [Fig. 4(e)]. In fact, controlling the intensity and power of the laser, patterning can also be achieved. Next comes, ‘liquid-phase exfoliation’ (LPE) that involves dispersion of graphite flakes in water or organic solvent, exfoliation through sonication and centrifugation to separate out un-exfoliated flakes [Fig. 4(f)]. Graphene has also been synthesized using ‘chemical exfoliation of graphite’ using strong oxidants and concentrated acids followed by reduction of it, which can yield single or few layer GO. The resulting material is known as rGO or functionalized graphene rather than ‘graphene’ since complete reduction has not yet been reported. Hummer’s method is the most widely used process for the production of GO, which leads to the formation of hydroxyl and epoxy groups on basal plane and carboxyl groups at the edges as shown in Fig. 3(a). In addition, due to these oxygen moieties it can be well dispersed in water and other organic solvents and thus considered to be highly suitable for bio-related applications. Many strategies have been proposed to chemically reduce GO sheets including chemical, hydrothermal or solvothermal, electrochemical, thermal, UV-assisted photocatalyzed, microbial reduction, etc. Reference Gao and Duan70–Reference Thakur and Karak72 Likewise, the exposure of graphite to strong acids results in the formation of graphite-intercalated compounds (GICs), which can then be exfoliated by thermal shock treatment at elevated temperature. In this process, heating of GICs generally causes the thermal decomposition of intercalates into gaseous species that push the layers apart and separates the graphene layers to few or multilayers, mainly referred as expanded graphite (EG). Reference Dhakate, Chauhan, Sharma, Tawale, Singh, Sahare and Mathur73 In a similar way, unzipping of multi-walled CNTs (MWCNTs) was achieved by treating them with strong oxidizing agents, physical method, laser irradiation, or plasma etching. The unzipping results in development of graphene nanoribbons having different properties based on their edge type (armchair/zigzag) and width. Reference Dhakate, Chauhan, Sharma and Mathur74 These methods have been explored to scale up the production of rGO or functionalized graphene but the resulting materials often exhibit significant structural defects or heteroatomic impurities.
Recently, ‘arc-discharge’ method has been widely used for the synthesis of few-layer graphene. Generally, in an arc discharge chamber, direct current (dc) is applied between two graphite electrodes in the presence of a buffer gas that may also include hydrogen or a combination of helium and hydrogen to provide high crystallinity.
In bottom-to-up approach, like ‘epitaxial growth’ by thermal desorption of Si atoms from the SiC surface above 1000 °C in which carbon rearranges itself in a hexagonal structure rather than being deposited on same SiC substrate as would happen in traditional epitaxial method [Fig. 4(g)]. Growth on metals by precipitation is another method to obtain graphite/graphene. High temperature annealing of metals like Cu, Ni, Pt, Au etc. can form single layer graphene or multilayer graphene through carbon precipitation [Fig. 4(h)]. Reference Mishra, Boeckl, Motta and Iacopi75 Highly crystalline or amorphous graphene films that can be transferred to various substrates have been grown using chemical vapor deposition system (CVD) systems [Fig. 4(i)]. There are many types of CVD processes including plasma enhanced CVD (PECVD), thermal CVD, hot-wire CVD, radio-frequency (rf) CVD, etc. The PECVD is considered to be the most common and inexpensive method. It also allows the deposition by the creation of plasma of the reacting gaseous precursors at lower temperature as compared to thermal CVD system. In a typical CVD process, a Cu or Ni substrate is annealed and precursor gases are pumped into a reaction chamber at elevated temperatures. Such high temperature leads to the pyrolysis of precursors and dissociate carbon atoms from the gases, which reacts with the substrate to grow a thin film of graphene. By varying parameters like gas composition, flow rate, temperature, and deposition time, quality of graphene can be improved. The quality of graphene produced using this method is highly suitable for photonics, nanoelectronics, and FET biosensing applications. Reference Zhang, Zhang and Zhou76
In molecular beam epitaxy (MBE) process [Fig. 4(j)], graphite layers are grown with high purity carbon sources on various substrates. As MBE is a thermal process, the carbon is expected to be deposited in the amorphous or nanocrystalline phase. In addition, the chemical synthesis process [Fig. 4(k)] exploits benzene-based precursors, mainly polycyclic aromatic hydrocarbons (PAHs) for producing small domains called as nanographene (NG) or large flakes. So far, CVD and chemical exfoliation of graphite flakes using Hummer’s method are the two main approaches widely used for the production of graphene for different biosensing mechanisms.
To take full advantage of graphene’s excellent properties for fabricating highly integrated device fabrication such as biosensors, a precise control over the organization of graphene sheets is essential. Extensive efforts have been made to achieve organized graphene or GO films using several assembly techniques including: solvent evaporation (that includes drop casting, spin coating, dip coating, and spray coating), vacuum filtration, self-assembly, electrophoretic deposition (EPD), self-assembly, layer-by-layer (L-b-L), and Langmuir–Blodgett (LB). Reference Richardson, Björnmalm and Caruso77 Among them, the most frequently used techniques for the fabrication of biosensors are L-b-L, self-assembly, and LB technique. These techniques have significant advantages including monolayer-film resolution, less sample requirement, good uniformity, and precise control over the thickness and placement. Reference Matharu, Bandodkar, Gupta and Malhotra78 L-b-L assembly approach is a firmly established technique where electrostatic interaction enables the alternating assembly of positively and negatively charged GO sheets thereby providing high degree of control over the thickness of films. Reference Zeng, Xing, Gao, Wang and Zhang79–Reference Lee, Min, Gu, Jung, Lee, Lee, Seong and Kim81 However, LB technique is the most promising alternating method to assemble amphiphilic molecules at the air–water interface as it enables precise control over the monolayer thickness and gap between them, providing homogeneous deposition of the monolayer over large areas and could be useful to make hybrid films with varying layer composition. Reference Cote, Kim and Huang82–Reference Chauhan, Palaninathan, Raveendran, Poulose, Nakajima, Hasumura, Uchida, Hanajiri, Maekawa and Kumar86 Furthermore, lithography and various printing strategies have also been used for patterning graphene that have been acquired from the CVD method for sensing application. Reference Rodrigo, Limaj, Janner, Etezadi, de Abajo, Pruneri and Altug87,Reference Zribi, Castro-Arias, Decanini, Gogneau, Dragoe, Cattoni, Ouerghi, Korri-Youssoufi and Haghiri-Gosnet88
C. 2D hybrid and 3D graphene materials
Fusion of NP or polymer with graphene offers individual properties of each material in one hybrid material. In addition, in the form of hybrid film assembly, it exhibits synergistic effect and makes it more compatible for developing new biosensing schemes with enhanced sensitivity and selectivity. Moreover, graphene paper (GP) acts like a scaffold to construct flexible electrodes due to its good mechanical strength, structural uniformity, and excellent electrical conductivity. However, in comparison with GP, graphene foam (GF) being a 3D material with well-defined porous structure and high conductivity offers more surface area to introduce more catalysts or enzymes into 3D graphene material. Reference Gao and Duan70,Reference Santonicola, Coscia, Sirilli and Laurenzi89,Reference Artiles, Rout and Fisher90
III. TOWARDS BIOSENSING PLATFORM
A. Selection of graphene materials
The success of any sensor not only depends on the selection of right material but also on its availability with high throughput at low cost. As discussed in previous sections, there are some key factors that drastically influence the properties of graphene and should be paid attention before adapting any fabrication protocol for graphene-based biosensors such as number of graphene layers, size of sheets, defects, edge-types, available functional groups, flatness, adsorbed impurities, and substrate (Si, paper, plastic) to be used for the fabrication of a device.
Graphene is fundamentally suitable for detecting organic molecules, ions, biomolecules, gas molecules and living organisms with high sensitivity due to its remarkable high surface-to-volume ratio to capture even a single molecule and electrical conductivity that modulates as soon as the foreign entity binds to it along with the chemical and thermal stability. However, it is important to mention that this can happen even with any molecule that binds to graphene thus making it not so selective in terms of differentiating molecules. In this section, we will explore the current tactics for modeling graphene-based biosensor with enhanced selectivity and detection performance that holds tremendous potential for addressing analytical needs in diagnosing various pathogens. As mentioned earlier, with the availability of wide range of surface chemistry like, amino silane, carboxy, diazonium and plasma chemistry, graphene surface can be modified to immobilize biomolecules for the detection of variety of pathogens. There are several review articles that focus on various trends for bio-functionalization of graphene and related materials. Reference Wang, Li, Wang, Li and Lin50,Reference Dong, Wang, Liu, Pei, Chen and Jin91 Based on these amazing features of graphene, various sensor designs such as field-effect transistors (FETs), optical, electrochemical, microfluidic technology and other systems have been proposed for early diagnosis and rapid detection to provide better and more successful therapeutic outcomes.
B. Detection and sensing mechanisms
Almost every ‘nanoelectronic biosensor’ mechanism is based on the principle of charge-detection. When a biomolecule binds to the sensor, the charge density of the sensor alters and an electrical sensing signal is generated. Now a question arises, does graphene has some charge-detection limitations that obstruct its use for detecting most of the analytes? As graphene research progress rapidly, various types of binding receptors and ligands, physicochemical methods and nano-platforms (discussed below) have been used for the detection or control of different biological substances. This includes immune components, NA, specific proteins, DNA, biochemical compounds, glucose concentration, glutamine deficiency, hazardous fraction of metal ions and toxic gas molecules present in the environment, detection of specific protein, aptamer, organophosphates and carbamic insecticides, species whole cells (like, cancer cells, stem cells, bacteria, or viruses), ascorbic acid (AA), uric acid (UA) level and dopamine (DA), hydrogen peroxide (H2O2), DNA and poly-lysine, pH, etc. Reference Zhu, Liu, Li, Nie and Li25,Reference Yao, Sun, Yang and Duan35,Reference Wang, Jackman, Ng and Cho92 These approaches have paved a new path in the development of biosensors having superior analytical performance, high sensitivity, high selectivity, LOD, low working potentials, and prolonged stability.
1. Graphene based FET biosensing system
A typical FET system consists of a semiconducting channel along with three metal terminals: source (S), drain (D), and gate (G). The S and D metal material are selected on the basis of the work function of the channel, which is ‘graphene’ in this case. The current in the semiconducting channel (drain current, I d) can be modulated through electric field generated by gate voltage (V g) and the voltage applied between the S and D terminals (V ds). The gate voltage can be applied in two different configurations bottom-gate and top-gate (TG). The TG configuration is also known as liquid gating or electrolyte gating. Reference Tran and Mulchandani11,Reference Park, Yoon and Kwon17,Reference Liu and Guo93 Generally, in bottom-gate configuration, S, D and channel are fabricated on the top on SiO2/Si substrate where SiO2 layer act like an insulator between graphene and heavily-doped Si (typically, p++) which is used as a bottom or back-gate (BG) as shown in Fig. 2. However, top-gated configuration is used for assays to be performed in solution form on the top of FET device typically in the presence of some electrolyte solution. The S, D and channel can also be fabricated on a flexible PET substrate. A reference electrode is dipped into the liquid placed between S and D and a small amount of V g (±0.1 V) and V ds can be applied. It has an advantage over BG configuration that it can be operated in the buffer solution at low voltage (<1 V) for real time measurement of an analyte. Due to the ambipolar transfer characteristics (I ds–V g curve) of these graphene based FET (GFET) devices, it is easy to detect any doping as to the left of Dirac point, the majority carriers are holes whereas to the right, the majority carriers are electrons as shown in Fig. 5(a). Reference Ohno, Maehashi, Matsumoto and Matsumoto94 Once any bio-species or gas molecule binds to the graphene surface there will be a shift in the Dirac point along the V g-axis as shown in Fig. 5(b) or a change in the transconductance, which can be calculated from the slope of transfer characteristics on either side of the Dirac point of the GFET device. The transconductance of TG FET is more than 200 times than that of BG operated device in vacuum. Wide range of detection strategies have been demonstrated using these device configurations. Reference Okamoto, Ohno, Maehashi, Inoue and Matsumoto95–Reference Viswanathan, Narayanan, Aran, Fink, Paredes, Ajayan, Filipek, Miszta, Tekin, Inci, Demirci, Li, Bolotin, Liepmann and Renugopalakrishanan97
(a) Schematic representation of graphene-based FET biosensor device and its transfer characteristics with the band structures for each regime and (b) changes in transfer characteristics due to electrostatic gating by charged analyte molecules. GNM-FET biosensor. (c) Schematic illustration of the fabrication of GNM FET biosensor. (d) GNM FET biosensor integrated on the PDMS film and attached on the human skin. Enlarged views: corresponding schematic structure of the flexible biosensor. (e) Transfer characteristics of solution-gated GNM FET biosensor in response to HER2 protein concentrations ranging from 0.0001 to 200 ng/mL. The V d is set at a fixed value of −0.1 V. (f) Magnified curve of (e) in the V g range of −0.2 to 0.1 V. (g) Current change (ΔI d,HER2) versus HER2 concentration (C HER2). The error bars present the standard deviations for three measurements. (c–g) Adapted with permission from Ref. Reference Yang, Yang, Zou, Wu, Wan, Cao, Liao, Yuan and Duan98 Copyright (2016) WILEY-VCH Verlag GmbH & Vo. KGa, Weinheim.

And it has been found that there are primarily four type of mechanisms possible that are possible when a single molecule or a collection of biomolecules approach the graphene-biosensor that can give rise to a significant change in the electronic properties of graphene based-FET: (i) surface charge-inducted gating effect or electrostatic gating, (ii) charge transfer between the biomolecules and graphene (acceptor or donor), (iii) charge scattering across graphene, and (iv) Schottky-barrier formation between the graphene and metal electrodes. Reference Tran and Mulchandani11,Reference Liu and Guo93 For instance, Mohanty and Berry proposed the first GFET biosensor by demonstrating a single bacterium resolution interfacial device, a label-free, reversible DNA detector, and a polarity-specific molecular transistor for protein/DNA adsorption from GO or graphene amines produced by treating GO with nitrogenous plasmas or ethylenediamine. Reference Mohanty and Berry99 A flexible glucose sensor has been fabricated using CVD-grown GFET in TG configuration. Reference Kwak, Choi, Kim, Kim, Yoon, Ahn, Yang, Yang and Seo100 It was functionalized with a linker molecule to immobilize enzyme that induces catalytic response of glucose. A range of 3.3–10.9 mM glucose levels was detected through a shift in Dirac point and differential I ds measurement for diabetic diagnosis. Another example of CVD graphene as a DNA and poly-L-lysine (PLL) biosensor was studied using BG configuration with no additional functionalization. Reference Kakatkar, Abhilash, Alba, Parpia and Craighead101,Reference Green and Norton102 The exposure of 300 pM concentration of DNA and ∼580 pM of PLL on GFET was detected by a large shift in the Dirac voltage toward negative and positive V g respectively. This device can be recycled and reused without performance degradation. A flexible sensing platform based on graphene coated 3D hierarchical bio-composite comprising of hollow natural pollen microcapsules has exhibited rapid response time of 4 s and detection limit up to 10−15 M with real-time feedback against prostate specific antigen. Reference Wang, Jackman, Ng and Cho92 This modular device design and performance are found to be highly suitable for next generation flexible and wearable devices. Yang et al. have demonstrated the real-time detection of breast cancer cells over-expressed with receptor 2 down to single-cell level using a flexible graphene nanomesh (from directly grown mesoporous silica template) FET-array with high density of hole punched in the basal plane to introduce lateral confinement and enable on/off ratio. Reference Yang, Yang, Zou, Wu, Wan, Cao, Liao, Yuan and Duan98 The aptamer binding and subsequent protein binding steps are illustrated in Fig. 5(c) where 1-pyrenebutanoic acid succinimidyl ester linker is conjugated with amino modified HER2-specific aptamer through amide bond. The integration of PDMS and graphene nanomesh device intimately attached onto the human skin, demonstrating the flexibility of the device [Fig. 5(d)]. The aptamer-modified graphene nanomesh device measurements taken when subjected to HER-2 solution are shown in Figs. 5(e)–5(g). The biosensor shows high sensitivity and selectivity toward HER2 protein with LOD of 0.6 × 10⁻¹⁵ M. Zhang et al. have realized a highly sensitive glucose biosensor for noninvasive diagnosis of glucose levels in the human body fluids such as sweat, tar, and human saliva based on whole-graphene solution-gated transistors with PtNP-functionalized graphene gate electrodes modified with an enzyme GOx, chitosan, and Nafion. Reference Zhang, Liao, Mak, You, Mak and Yan103 The inherent signal amplification function of the GFET and Pt incorporation with graphene improves its electrocatalytic activity toward H2O2 and enhances its sensitivity up to 0.5 μM concentration of glucose by detecting H2O2 concentration down to 30 nM. In addition, it can also be used to realize many other enzyme sensors based on the detection of H2O2. Huang et al. have demonstrated a TG configured GFET device with high sensitivity and selectivity for real time monitoring of metabolic activity of live pathogenic bacterial cells that can be used for screening antibacterial drugs. Reference Huang, Dong, Liu, Li and Chen104 They have used CVD-grown graphene as a channel functionalized with anti-E. coli antibody and a passivation layer for the detection of E. coli K12 ER2925. The attachment of bacteria with antibodies was monitored by taking I ds–V ds and I ds–V g curves before and after each incubation of 0 to 105 cfu/mL bacteria and the lowest detection concentration was found to be 10 cfu/mL. For selectivity, they have also performed similar experiments with another species called P. aeruginosa that did not produce any significant change in the FET response. These are few examples of GFET biosensors and for more information one can refer to Table I. Detection of toxic gases is extremely important for environment monitoring, public safety, and indoor quality control. Various experimental studies have shown that GFET operating at room temperature possess pronounced sensitivity to toxic gases such as CO, NO2, SO2, NH3 up to extremely low concentrations of down to tens of parts per billion (ppb). The electrical response of GFET changes based on the charge transfer mechanism taking place after the adsorption/desorption of the gas molecules on the surface of graphene. For example, the exposure of NH3, which act like an electron donor, increases the resistance value whereas electron-withdrawing NO2 cause a decrease in resistance. Reference Varghese, Varghese, Swaminathan, Singh and Mittal105 An implantable silk-fibroin encapsulated graphene-FET enzymatic biosensor that utilizes silk-protein both as enzyme immobilization material, and a device substrate—was developed for real-time glucose monitoring up to 3–10 mM. Reference You and Pak106 Myung et al. have reported rGO encapsulated with silicon-oxide NPs based FET biosensor that significantly increases the surface-to-volume ratio and maintain high electrical conductivity for selective and sensitive real time detection of key biomarker proteins for breast cancer. The device functionalized with monoclonal antibodies (mAbs) was able to detect up to 1 pM of human epidermal growth factor receptor 2 (HER2) and 100 pM of epidermal growth factor receptor (EGFR) that are known to be over-expressed in breast cancer, by the change in the conductance. Reference Myung, Solanki, Kim, Park, Kim and Lee108 Kwon et al. have demonstrated an artificial multiplexed super-bioelectronic (MSB) nose that mimics the human olfactory sensory system by using highly uniform graphene patterns conjugated with two different human olfactory receptors (hORs) in TG-FET configuration. It provides good discrimination and selectivity toward the targeted odorants (amyl butylate and helional) up to 0.1 fM. The concept of multiplexed super-bioelectronic nose is represented in Fig. 6 where hOR-conjugated graphene micropattern geometries have been referred as MSB nose, which can be operated stably as a TG-FET configuration to identify distinct odors. Reference Kwon, Song, Park, Lee, An, Park, Yang, Yoon, Bae, Park and Jang107
Summary of graphene and its derivative based biosensors with their performance and potential applications.

Schematic diagram of functional anatomy of human olfactory system and components of MSB-noses simulating each functional stages of human nose. (a) Olfactory bulb, where the olfactory signals generated by OSNs are combined for the generation of combinatorial olfactory codes, matching with artificial olfactory codes generated by MSB-nose. (b) Olfactory sensory neurons (OSNs), where olfactory signals triggered by the specific binding of hORs and odorants, matching with GMs functionalized with hORs. (c) hORs for the specific recognition of odorants. (d) Illumination of specific interaction between hOR and odorant. Adapted with permission from Ref. Reference Kwon, Song, Park, Lee, An, Park, Yang, Yoon, Bae, Park and Jang107 Copyright (2015) American Chemical Society.

2. Graphene based optical biosensing system
Optical biosensing technique is a powerful tool for accurately visualizing and monitoring analyte binding-induced changes in the inherent optical properties of a sensor surface such as absorbance, photoluminescence (PL) or fluorescence quenching efficiency, chemiluminescence, Förster or fluorescence resonance energy transfer (FRET), light absorption and scattering, reflectance or any change in the refractive index. So far, many optical sensors have been developed via the basic theory of colorimetric, plasmonic, and fluorescence sensing techniques. Reference Yoo and Lee109 The colorimetric sensors allow easy-to-use, portable, cost-effective, rapid (within 15 min), and distinct absorbance response that can be visually detected by the naked eye upon analyte recognition. But, they have several downsides, such as drop in sensitivity when analyte concentration decreases, limited multiplexing capabilities and blink on/off at the single molecular level. However, plasmonic based sensors offers superior sensitivity with multiplexing capabilities and is typically based on the mechanism of surface plasmon resonance (SPR), localized SPR (LSPR), surface enhanced Raman spectroscopy (SERS), or propagating surface plasmon polaritons (SPPs). In a fluorescence based biosensor, specific fluorescent probes are mounted chemically, enzymatically or genetically through recognition element that identifies or captures an analyte and generates measurable fluorescent signal that is directly proportional to the strength of the specific analyte binding. Generally, any change in the fluorescent signal can occur either due to fluorescence quenching (turn-off) or fluorescence enhancement (turn-on) or FRET. Particularly, fluorescence biosensors have generated immense interest in detecting extracellular cancer biomarkers, cancer cells and cancerous tissues in vitro and in vivo as they provide subcellular-resolution and enable the tumor phenotype identification at their early stages. Reference Berezin and Achilefu110 There are various molecular probes available such as organic dyes, fluorescent proteins, etc. that can be utilized for biosensing. However, they might suffer from poor photo-bleaching resistance, photoinstability and are thus considered as an unreliable intracellular probe. As a result, many nanomaterials such as silver nanoclusters (AgNCs) with high quantum yields, QDs, upconversion NPs etc. have been used as efficient fluorescent labels. Reference Chinen, Guan, Ferrer, Barnaby, Merkel and Mirkin9
Many generalized reviews have appeared showing remarkable optical properties of graphene and its derivatives over other nanomaterials. Reference Loh, Bao, Eda and Chhowalla111–Reference McGuire116 Pristine graphene has a zero intrinsic band gap thereby limiting its use in many optical applications that are based on photo-excited PL. However, band-gap in graphene can be introduced or tuned (as we have discussed in the previous sections) by converting 2D graphene sheets to GO, rGO, GQDs, etc. Among them, GO and GQDs have displayed advantageous features as an optical biosensing platform due to their direct wiring with various biomolecules, a tunable band gap, capability to be processed in solution, Raman scattering, inherent fluorescence activity, and good photo-bleaching resistance. GO can fluoresce by photo-exciting with a wide range of wavelengths [from near infra-red (NIR) region to ultra-violet (UV) emission] due to its heterogeneous structure. Reference He and Tian117,Reference Romero-Aburto, Narayanan, Nagaoka, Hasumura, Mitcham, Fukuda, Cox, Bouchard, Maekawa, Kumar, Torti, Mani and Ajayan118 It is also popular as an effective fluorescence quenching materials that makes it suitable for FRET biosensors where an excitation on another molecule can transfer nonradiatively to GO, or vice-versa. Since the fluorescence quenching is distance dependent, FRET can determine the molecular distances and interactions between domains in a single protein or between proteins, which corresponds to the efficiency of energy transfer between an acceptor and a donor located at two distinct sites with separation limited to a range of 10–80 Å through luminescent spectral measurements. Reference Martins, Ribeiro, de Camargo, Filho, Cavalcante and Dias119 The GQDs exhibit nonblinking PL that ranges from UV to red and most commonly blue and green. Generally, it is accepted that there are mainly two mechanisms possible for the generation of PL in graphene nanomaterials i.e., the introduction of the conjugated π-domains (as the oxygen moieties present on GO confines the π-electrons within the sp 2 carbon nanodomains) and the defect-derived PL emissions. Reference Morales-Narváez and Merkoçi33,Reference Wang, Zeng and Sun120,Reference Xie, Wang, Zhou, Liu, Fan, Li and Li121 In most of the cases these two mechanisms may also occur simultaneously. The quenching and tunable fluorescence capability of GO, which further depends on the oxidation time, size, shape and relative fraction of the sp 2-hybridized domains present clearly implies its possible use for biosensing. Reference Zhu, Du and Lin122 The potential of each optical method integrated with graphene have led to the development of various ingenious graphene-based optical biosensors (GOSs) to facilitate the development of compact, cost-effective, multiplexed, and simple readout devices.
Many research groups have come up with advanced graphene-based optical biosensing strategies that target high-throughput and practical usefulness besides improved sensing efficiency. For instance, Rodrigo and co-workers Reference Rodrigo, Limaj, Janner, Etezadi, de Abajo, Pruneri and Altug87 have improved the well-known molecular sensing method called infrared-absorption spectroscopy by demonstrating the practicality of electro–optical properties of graphene. They have developed a dynamically tunable graphene based plasmonic biosensor for chemically specific label-free detection of protein. By making use of LSPR phenomenon in graphene, the researchers have tuned graphene to different frequencies by applying voltage to make its electrons oscillate for extracting all vibrations of the molecule present on the surface of graphene, that is not possible using the conventional methods. Thereby, identifying the nature of the bond connecting the atoms that makes nanometric molecules. Reference Rodrigo, Limaj, Janner, Etezadi, de Abajo, Pruneri and Altug87 In another approach, graphene-FRET aptamer where the fluorescence quenching ability of graphene was first used for dye-labeled aptamer (as a biomolecular probe) based detection of thrombin which is a kind of protein that regulates tumor growth, metastasis, and angiogenesis. Reference Chang, Tang, Wang, Jiang and Li123 It can detect up to 31.3 pM thrombin with good sensitivity in both buffer and blood stream via fluorescence quenching of dye [fluorescein amidite (FAM)] labeled aptamers by graphene and subsequent fluorescence recovery induced by the formation of quadruplex–thrombin complexes due to relatively weak binding of quadruplex–thrombin complexes to graphene than that of aptamer. Recently, a multitasking scheme comprising of simultaneous sensing and imaging of ATP and GTP in vitro and in situ have been realized through fluorescence and confocal microscopy techniques in MCF-7 breast cancer cells by using GO nanosheet and DNA/RNA aptamers. Reference Wang, Tang, Li, Lin and Li124 He et al. have demonstrated a homogenous sensor design for multiplex, sequence-specific DNA detection based on the high fluorescence quenching ability as well as different affinity of GO toward ss- and dsDNA. Reference He, Song, Li, Zhu, Qi, Wen, Wang, Song, Fang and Fan125 In a subsequent study, a label-free and paper-based lateral-flow immunoassay for pathogen detection (like Escherichia coli bacteria) have been proposed that provides a low-cost, disposable and easy-to-use device for portable and automated diagnostic applications without using secondary antibodies. Using lateral flow approach and taking advantage of QDs (CDSe@ZnS) conjugated with antibody (as a donor) and PL quenching ability of GO (as an acceptor), a simple nitro/cellulose strip was made with QD as a control line as depicted in Figs. 7(a)–7(b). The device LOD was 10 CFU/mL in buffer and 100 CFU/mL in bottled water and milk. Reference Morales-Narváez, Naghdi, Zor and Merkoçi126
Photoluminescent lateral flow test revealed by GO for pathogen detection. (a) Schematic representation. QDs are printed on nitrocellulose substrate as control line. Antibody-decorated quantum dots are printed on the same substrate as test line. The sample flows from the sample pad (SP) to the absorbent pad (AP). Upon excitation, the control line is always quenched by a GO flow (since the distance between QDs energy transfer donors and GO acceptor is minimum). The test line is quenched by a GO flow when the analyte is not present. The contrary, when the analyte is present it is selectively captured and the test line will not be significantly quenched when compared with the control line (since the distance between donor and acceptor exceeds the nanoscale due to the analyte size). (b) Portable lateral flow reader and typical positive/negative response of the test. The graph contains the profile of the original intensity of the strip (dotted line), the final intensity of a positive assay (red line) and the final intensity of a negative assay (green line). (c) Schematic of the trypsin quantification by FRET-based modified GQDs nanoprobe. Originally, the FRET from the GQD (460 nm) to CMR2 (520 nm) on BSA occurred due to the close proximity of GQD and CMR2. In the presence of trypsin, BSA would be digested and FRET system is dissembled. As a consequence, emission intensity at 460 nm increases and that at 520 nm diminishes. (d) The emission spectra of the nanoassembly in the presence of trypsin at different concentrations; and (e) a photo of nanoprobe (GQD-BSA, left), GQD-BSA-CMR2 (middle) and GQD-BSA-CMR2 with trypsin (right) under exposure of a hand-held UV lamp. (a–b) Adapted with permission from Ref. Reference Morales-Narváez, Naghdi, Zor and Merkoçi126 Copyright (2015) American Chemical Society and (c–e) Ref. Reference Poon, Li, Zhang, Li, Dong, Lee, Chan and Li127 Copyright (2016) Elsevier B.V.

Graphene can also be used as a substrate to improve the optical biosensor’s performance when conjugated with conventional plasmonic material to obtain high sensitivity by amplifying the detectable signal up to single molecule level detection. For example, the measurement of immunoglobulin G (IgG) antibody level is important to deal with immune deficiencies, autoimmune disorders like autoimmune hepatitis and infections. In a study, Wu et al. have used carboxyl-functionalized GO as a SPR biosensing substrate conjugated with biofunctionalized Au-nanostars to amplify the response signals for the pig IgG detection with LOD 32 times lower than that of GO based biosensor. Reference Wu, Sun, Ma, Zhang, Li, Wang and Song128 Recently, Poon et al. have demonstrated a fast and sensitive screening of pancreatic disease by direct quantification of trypsin in urine samples using GQD nanoprobe FRET biosensing scheme as depicted in Figs. 7(c)–7(e). Reference Poon, Li, Zhang, Li, Dong, Lee, Chan and Li127 Table I provides recent updates for graphene-based optical biosensing systems.
3. Electrochemical based biosensing system
One of the striking features of an electrochemical sensor is that it has little power consumption, and multiple sensing operations over other sensing schemes. For developing high performance electrochemical sensor it is important to have effective electron transfer from the surface of conducting electrode. With the advancement in graphene related research, a variety of graphene based electrochemical biosensors have come up, thereby, paving a bright way for electrochemical biosensors. Reference Du, Zou, Shin, Wang, Wu, Engelhard, Liu, Aksay and Lin129–Reference Gong, Wang and Yang133 In the following section, we will highlight the basic mechanism behind the available schemes of graphene based electrochemical biosensors and discuss several graphene-based nanomaterials that have been successively developed. Briefly, a graphene-based electrochemical biosensor can be divided into three main categories depending on the analyte detected: graphene-based enzyme sensor (enzyme amplification), immunosensors (based on antigen–antibody interaction), and DNA sensors (DNA structure switching). These biosensors are used to detect any change in current (amperometry or voltammetry), voltage (potentiometry), capacitance, or impedance from the chemical reaction. An interesting portable graphene-based sensor in conjugation with 3D-AuNPs was fabricated on origami-paper for the detection of H2O2 release from K-562 cells via the simulation of phorbol 12-myristase-13-acetate. Reference Ge, Zhang, Zhang, Liu, Huang, Yan and Yu134 Tehrani et al. have fabricated a highly sensitive, inexpensive, and disposable graphene-copper based glucose biosensor chip for selective non-enzymatic glucose detection. The electrochemical properties of the modified graphene electrodes were inspected by cyclic voltammetry (CV), electrochemical impedance spectroscopy (EIS), and amperometry with a LOD of 0.025–0.9 mM. Reference Tehrani, Reiner and Bavarian135 An electrochemical immunosensor for cancer biomarker a-fetoprotein by using graphene and chitosan to modify screen printed carbon electrode where graphene acted like an electron transfer nanomaterials which can respond to 0.02 ng/mL of a-fetoprotein. Reference Du, Zou, Shin, Wang, Wu, Engelhard, Liu, Aksay and Lin129 Using an electrochemical impedance spectroscopy, Kailasiya et al. have demonstrated a sensitive biosensor based on antibody and GO on glassy carbon (GC) electrode for the detection of platelet-derived microparticles (the blood samples obtained from patients diagnosed with acute infarction). Reference Kailashiya, Singh, Singh, Agrawal and Dash136
Real-time monitoring of a disease can have great impact on quality of life of a patient. Electrochemistry has shown immense potential for implantable devices in terms of rapid measurement, design simplicity, stability, good sensitivity, and selectivity. In past few years, many electrochemical graphene-based device schemes, have been proposed for use in vivo for monitoring the dopamine, H2O2, L-Dopa (an intermediate precursor of the neurotransmitter dopamine), glucose, L-lactate, β-galactosidase-gene expressions. Reference Zhu, Zeng and Ye137–Reference Manibalan, Mani, Huang, Huang and Chang141 An implantable device to study the brain dynamics using rGO wrapped gold–oxide composite (rGO/Au2O3) multichannel neural probe with multiple real-time monitoring of neural-chemical and electrical signals by nonenzymatic neural-chemical interface was developed [represented in Fig. 8(a)]. An efficient real time sensitivity of brain H2O2 with low LOD and brain dynamics of ischemic strokes was analyzed with electrophysiology signals measured by somatosensory-evoked potentials (SSEPs). Reference Liu, Chuang, Chu, Huang, Lai, Wang, Chu, Chen and Chen142 Recently, Wang et al. have demonstrated a new strategy to develop in vivo electrochemical biosensor through bioelectrochemically multifunctional film (BMS) that can be used for understanding the molecular basis of brain function. The BMS film was formed by drop-casting an integrated mixture of oxidase, ferrocene mediator, and GO with the polymaleimidostyrene/polystyrene (PMS/PS) matrix on GC substrate as illustrated in Fig. 8(b). Sensing was achieved by directly coupling the biosensors to in vivo microdialysis to establish an online electrochemical system (OECS) for in vivo monitoring of glucose in rat auditory cortex during salicylate-induced tinnitus model [Fig. 8(c)] with LOD of 10 μM. Reference Wang, Li, Xu, Wu, Xiao, Hao, Yu and Mao143 In another study, Lee et al. have demonstrated an enzyme-based wearable diabetes monitoring and therapy device in vitro and in vivo. Graphene synthesized through CVD process, doped with gold and combined with serpentine-shape gold mesh was used as wearable patch by detecting biomarker present in human sweat for wireless diabetes monitoring and feedback therapy. They have also incorporated pH and temperature-monitoring option in the same device, as the enzyme-based glucose sensor is highly sensitive to it. If a high glucose level is detected, the embedded heater turns on, and dissolves phase-change material coated over the bioresorbable polymer-based microneedles, as a result of which Metformin loaded temperature sensitive microneedles pierces the skin and releases the drug into the bloodstream. Reference Lee, Choi, Lee, Cho, Ghaffari, Wang, Choi, Chung, Lu, Hyeon, Choi and Kim132 A highly conducting paper-based electrochemical biosensor comprising of (3,4-ethylenedioxythiophene):poly(styrenesulfonate) (PEDOT:PSS) and rGO used for cancer biomarker detection showed sensitivity of 25.8 μA ng−1 mL cm−2 in the detection range of 2–8 ng/mL. Reference Kumar, Kumar, Srivastava, Yadav, Lee, Sharma, Doval and Malhotra144 Some more updates in graphene-based electrochemical biosensors field are discussed and listed in Table I.
(a) In vivo amperometric experimental setup of laser-inducing ischemic stroke and neural probe with rGO/Au2O3 electrode by chloride ion (Cl−) induced effect. (b) Schematic illustration of bio-electrochemically multifunctional film and (c) OECS with BMF-based biosensor as detector. (a) Adapted with permission from Ref. Reference Liu, Chuang, Chu, Huang, Lai, Wang, Chu, Chen and Chen142 Copyright (2015) American Chemical Society and (b–c) Ref. Reference Wang, Li, Xu, Wu, Xiao, Hao, Yu and Mao143 Copyright (2016) American Chemical Society.

4. Microfluidics and other biosensing system
So far, the current biosensing studies have been mainly focused on the extraordinary electrical, optical, and electrochemical properties of graphene. However, these strategies can also be integrated in a microfluidic configuration for developing point-of-care (POC) external miniaturized devices. Reference Derkus145,Reference Lafleur, Jönsson, Senkbeil and Kutter146
Ang et al. have demonstrated an array of graphene-FET constructed on a quartz-substrate that was integrated with microfluidic flow cytometry for sensing malaria infected blood cells at a single cell level. The infected blood cells induce highly sensitive capacitively coupled changes in the conductivity of graphene through charge protrusions on cell surface that induces local doping thereby changing the FET characteristics. Reference Ang, Li, Jaiswal, Wang, Hou, Thong, Lim and Loh147 Graphene based fluorescence microfluidic chip biosensors have been developed for rapid, visible and high-throughput approach for early cancer diagnosis with high sensitivity. For instance, a multiplex chip has been created for in situ detection of seven different cancer cells by implementing GO-based FRET strategy i.e., assaying the cell-induced fluorescence recovery from the dye-labeled aptamer/GO complex with a LOD of about 25 cell/mL that is 10 times lower than a typical biosensor. Reference Cao, Cheng, Zhang, Wang, Zhang, Chen, Liu, Zhang and Kong148 Yoon and co-workers have used microfluidic device approach based on noncovalently functionalized GO with patterned gold surface having hydrophobic lipid chains of PL-PEG-NH2 immobilized over it for sensitive capture of circulating tumor cells (CTCs). CTCs are the major cause of cancer spreading throughout the body. These cells detach from the primary tumor, and move to a new site for subsequent tumor growth through blood stream. CTCs also contain information about the primary tumor and can be used as a biomarker for disease diagnosis and progression. The authors have also processed blood samples from patients suffering from metastatic breast cancer, early-stage lung cancer, and metastatic pancreatic cancer for their full study. The lowest concentration of target cells captured was 73 + 32.4% at 305 cells/mL blood. Reference Yoon, Kim, Zhang, Azizi, Pham, Paoletti, Lin, Ramnath, Wicha, Hayes, Simeone and Nagrath149 A simple graphene-based potentiometric sensor was developed for monitoring intracellular glucose concentration in human adipocyte. It consists of a fine borosilicate glass capillary coated with glucose oxidase enzyme immobilized graphene and inserted into a single human cell for in vivo biosensing. Reference ul Hasan, Asif, Hassan, Sandberg, Nur, Willander, Fagerholm and Strålfors150 A 3D graphene micropillar structure was constructed by PDMS micropillars fabricated in microchannel using conventional photolithography process for enzyme-based detection of phenol with a LOD of 50 nM. Reference Liu, Piao, Choi and Seo151 Yoon et al. have combined a thermoresponsive polymer with GO incorporated into a microfluidic chip for efficient capture and release of viable CTCs (Fig. 9). This process would bring more insight into the mechanism of underlying cancer metastatis and help in optimizing the treatment selection and management. Reference Yoon, Shanker, Wang, Kozminsky, Jin, Palanisamy, Burness, Azizi, Simeone, Wicha, Kim and Nagrath152
(a) Schematic concept of a polymer–GO microfluidic device for the capture/release of CTCs. (b) Enclosure within PDMS chamber and photograph of patient blood samples being processed by the polymer–GO devices. Adapted with permission from Ref. Reference Yoon, Shanker, Wang, Kozminsky, Jin, Palanisamy, Burness, Azizi, Simeone, Wicha, Kim and Nagrath152 Copyright (2016) WILEY-VCH Verlag GmbH & Vo. KGa, Weinheim.

Mannoor and co-workers have demonstrated bio-selective detection of bacteria at single cell level in saliva as a line of defense against the pathogenic threats by direct bio-interfaced graphene wireless nanosensor with biomaterial such as tooth enamel.
The fundamental operation and key functionality of this sensing scheme is represented in Fig. 10. A parallel LRC resonant circuit with Au-inductive coil for wireless transmission and interdigited capacitive electrodes that connects graphene was used as a resistive sensor. The detection was performed via self-assembled antimicrobial peptides onto graphene/electrode/silk hybrid transferred to tooth enamel or tissue. Reference Mannoor, Tao, Clayton, Sengupta, Kaplan, Naik, Verma, Omenetto and McAlpine153 Typically, proteins trigger three types of signals that make sensing more difficult to distinguish between similar type of proteins for sensitive and accurate results. Zhu et al. have devised a multimodal biosensor with graphene as an active region that works in three different ways-mechanical, electrical, and optical modes. A wide range of similar proteins were identified through their mass, optical as well as electrical properties. Reference Zhu, Yi, Reed, Zhu and Cubukcu154
Biotransferrable graphene wireless nanosensor. (a) Graphene is printed onto bioresorbable silk and contacts are formed containing a wireless coil. (b) Biotransfer of the nanosensing architecture onto the surface of a tooth. (c) Magnified schematic of the sensing element, illustrating wireless readout. (d) Binding of pathogenic bacteria by peptides self-assembled on the graphene nanotransducer. Adapted with permission from Ref. Reference Mannoor, Tao, Clayton, Sengupta, Kaplan, Naik, Verma, Omenetto and McAlpine153 Copyright (2012) Macmillan Publishers Limited.

IV. CONCLUSION, CHALLENGES, AND PROSPECTS
In vitro and in vivo biosensors have revolutionized our understanding toward finding the root cause and treatment of disease. The field of graphene, its derivatives and hybrids, is rapidly progressing from its theoretical projection to practical implementation. Numerous graphene-based biosensors have shown remarkable performance from diagnosis of disease to their treatment and have begun to make their way to the market place. For instance, Stebunov and co-workers Reference Stebunov, Aftenieva, Arsenin and Volkov173 have demonstrated the first SPR biosensor chip by using a linked layer for biomolecule immobilization, comprising of a thin film of graphene or GO, for optical biosensing applications. The proposed biosensor chip showed good sensitivity with high binding sites and less nonspecific binding. In addition, it can be used multiple times with 10–25% accuracy of repeatability and has been presented as a substitute for commercially available SPR biosensor chips. However, the field of graphene-based biosensors is still in its early development stage with a number of key challenges that needs to be addressed. For instance, large-scale production of good quality graphene with well-defined size and precise surface chemistry is still a major problem. Moreover, for developing a cost-effective and real-time biosensing device, we need to focus our research efforts to build a versatile and a re-usable biosensor that can perform multiple-functions at a time.
Although graphene-based materials are considered to have no significant toxicity in many biomedical applications, however, more elaborative studies are still needed before considering it as a reliable material for implantable devices. This would include monitoring the interaction of graphene with genetic molecules, acute toxicity studies (long term toxicity), intracellular metabolic pathway, and excretion studies from biological systems. These experimental studies are essential to design graphene based biosensors that will help us better understand the metastatic cancer, molecular basis underlying the brain function, developing prostheses for injured organs, hepatitis, oxidative stress, autophagy, apoptosis etc. This could enable early detection and lead to better treatment strategies by monitoring the progress of the disease in response to treatment. Thus, more fundamental and detailed research is required to resolve many clinical hurdles, in order, to bring graphene-based flexible and implantable biosensors in the market by next decade.
ACKNOWLEDGMENTS
The authors would like to acknowledge their sincere gratitude to the Ministry of Education, Culture, Sports, Science and Technology (MEXT), Japan for the financial support under the program of the strategic research foundation at private universities S1101017, organized by the MEXT, Japan.


