


I. Introduction
A growing narrative links declining trust in the news to their political affiliation. Recent surveys show that only about 40% of U.S. adults have confidence that the media report the news fairly and accurately—down from over 70% in the 1970s—and that most Americans believe news outlets systematically favor one side of the political spectrum (Gallup (2020), Pew Research Center (2020), (2021)). Such distrust has been shown to shape belief formation and contribute to polarization among general news audiences (Ladd (Reference Ladd2010), Arceneaux, Johnson, and Murphy (Reference Arceneaux, Johnson and Murphy2012), and Guriev and Papaioannou (Reference Guriev and Papaioannou2022)). Although media distrust may stem from concerns that politically affiliated outlets slant their coverage, excessive suspicion could also lead audiences to dismiss reporting even when no bias is present. We ask whether this occurs among stock market investors. Because financial markets play a central role in allocating capital and aggregating information, it is important to determine whether investors correctly interpret news reports or whether they, too, are prone to distrusting politically affiliated media.
Answering this question is challenging because it is difficult to empirically separate low credibility due to political affiliation and low informativeness due to biased content, since news media generally display some degree of political slant (Groseclose and Milyo (Reference Groseclose and Milyo2005), Gentzkow and Shapiro (Reference Gentzkow and Shapiro2010)). An ideal test would therefore change the political affiliation of a news outlet while holding the content of its reporting constant, and specifically, without introducing any political bias into the news itself.
To address this challenge, we design a test around the takeover of Dow Jones & Co., a leading publisher of financial news, by News Corporation in 2007, and investigate the stock market investors’ responses to news reports published in the Dow Jones Newswires (DJNW), a Dow Jones & Co. outlet that distributes financial news to investment professionals.Footnote 1 The acquisition raised concerns about the independence of Dow Jones & Co. as Rupert Murdoch, News Corporation’s controlling shareholder, was viewed as right-wing and not above meddling in editorial lines. We exploit this event as a shock to the political affiliation of the DJNW and test for its effect on the responsiveness of stock prices to news reports.
DJNW newswires mainly report bare-bone facts and numerical information, reducing the likelihood of a political slant and inherently limiting DJNW’s leeway to produce biased reports. DJNW’s audience, moreover, consists of finance professionals who value accuracy, so that the incentive for DJNW to slant news reports to cater to the political views of its readers is also limited (Mullainathan and Shleifer (Reference Mullainathan and Shleifer2005), Gentzkow and Shapiro (Reference Gentzkow and Shapiro2006), (Reference Gentzkow and Shapiro2010)). As a result, the possibility of a confounding effect from biased news reporting is reduced, helping us isolate the stock market’s response to DJNW’s political affiliation. In addition, the takeover does not affect the fundamentals of the firms covered in DJNW’s news reports, attenuating the potential impact of omitted variables related to a firm’s connection to political power (Fisman (Reference Fisman2001), Faccio (Reference Faccio2006), Faccio, Masulis, and McConnell (Reference Faccio, Masulis and McConnell2006), and Goldman, Rocholl, and So (Reference Goldman, Rocholl and So2009)) and resulting in a comparatively clean testing environment.
Our testable hypotheses are based on the theory of trust in information sources (Gentzkow, Wong, and Zhang (Reference Gentzkow, Wong and Zhang2021), Cheng and Hsiaw (Reference Cheng and Hsiaw2022)). Suppose investors have a prior that News Corporation’s political affiliation induces a pro-Republican/anti-Democrat bias in DJNW news reports. Rational Bayesian updating from such a prior makes investors interpret favorable DJNW news reports about Republican-aligned stocks less favorably and unfavorable reports about Democrat-aligned stocks more favorably. As a result, stock prices should become less responsive to DJNW news reports. To the extent that DJNW reports economically meaningful information, this makes stock prices less informative. We test this theory to the data on a large sample of DJNW newswires published during the years surrounding the takeover of Dow Jones & Co. by News Corporation.
In the aftermath of News Corporation’s takeover of Dow Jones & Co., corporate political affiliation is associated with a reduced sensitivity of stock prices to the sentiment content of DJNW news reports (Figure 1). Using corporate political contributions as a measure of political affiliation, we find that the prices of stocks with a political affiliation become less sensitive to DJNW sentiment, relative to the prices of nonaffiliated stocks. The drop in sensitivity is substantial: Prior to the takeover, reports in the top sentiment decile are associated with 1.14 percentage points higher stock returns than reports in the bottom decile; following the takeover, the difference shrinks to 0.56 percentage points. It is also protracted: stock prices do not revert to their pre-2007 sensitivity to DJNW sentiment until late 2010 (Figure 2). This effect is driven by a reduced sensitivity to politically affiliated stocks, whereas no change in sensitivity is detectable for nonaffiliated stocks. Moreover, consistent with our argument, the reduced sensitivity to DJNW sentiment is associated with reports that may suggest a pro-Republican/anti-Democrat bias (i.e., favorable reports about Republican stocks and unfavorable reports about Democrat stocks). These findings are robust, both qualitatively and quantitatively, to a broad set of checks, including alternative measures of DJNW news sentiment content and alternative proxies for corporate political affiliation.
Figure 1 illustrates the test reported in Table 2. We regress the 3-day cumulative abnormal return around a news report published in the DJNW on
$ DJ\_ Sent $
 , an indicator for stocks that have a political affiliation, and indicators for each 6-month interval over 2003–2012. The regression also includes industry
$ \times $
, an indicator for stocks that have a political affiliation, and indicators for each 6-month interval over 2003–2012. The regression also includes industry
$ \times $
 date fixed effects. We plot the coefficients on the 3-way interaction terms
$ DJ\_ Sent\times \mathrm{Politically}\ \mathrm{affiliated}\ \mathrm{stock}\times \mathrm{semi}\hbox{-} \mathrm{annual}\ \mathrm{indicators} $
date fixed effects. We plot the coefficients on the 3-way interaction terms
$ DJ\_ Sent\times \mathrm{Politically}\ \mathrm{affiliated}\ \mathrm{stock}\times \mathrm{semi}\hbox{-} \mathrm{annual}\ \mathrm{indicators} $
 , along with 95% confidence bands.

FIGURE 1 Long description
The x-axis spans from December 2003 to December 2012 in yearly increments. The y-axis is labeled Stock Price Sensitivity to D J N W Sentiment in percentage points, ranging from minus 1.5 to plus 1.0. The central black line represents the estimated coefficients for the three-way interaction of D J Sent, Politically affiliated stock, and semi-annual indicators. The shaded gray area around the line shows the 95 percent confidence interval. Two vertical green lines are drawn at May 2007 and December 2007. The first is labeled May 2007 News Corporation bid is announced, and the second is labeled Dec 2007 Acquisition is complete. Before May 2007, the sensitivity fluctuates around zero, declining to negative values after the bid announcement and reaching a trough near minus 1.0 around 2008. After 2008, the sensitivity gradually increases, approaching zero and then positive values by 2012. The confidence interval is widest at the graph’s edges and narrows near the center.
Figure 2 plots the excess returns on the portfolio analyzed in Table 8, based on a benchmark that includes the Fama and French (Reference Fama and French1993), (Reference Fama and French2016) market, size (SMB), book-to-market (HML), profitability (RMW), and investment (CMA) factors, the Carhart (Reference Carhart1997) momentum factor (MOM), and the return on a similar portfolio based on stocks without a political affiliation (nonpolitical).

FIGURE 2 Long description
The x-axis runs from January 2003 on the left to January 2013 on the right. The y-axis is labeled cumulative excess return in percentage points, ranging from 0 to 40. The plotted line remains mostly flat and fluctuates between 0 and 10 until early 2007. At May 2007, a green vertical line is labeled ‘May 2007 News Corporation bid is announced.’ After this point, the line rises steeply, crossing 10 and reaching above 30 by late 2008. A second green vertical line at December 2007 is labeled ‘Dec 2007 Acquisition is complete.’ After this, the line continues to rise, peaking above 40 around 2011, then declines slightly but remains above 30 through January 2013.
We consider three tests to link this effect to the DJNW’s political affiliation. First, we repeat our baseline analysis on the sentiment content of news sources with similar features as DJNW (focus on facts and numbers, similar audience), but considering those whose political affiliation does not change: Reuters Newswire, Associated Press, and corporate press releases. We find no drop in stock return sensitivity to the sentiment content of their reports. This evidence rules out the possible impact of omitted variables that may affect the stock market’s general responsiveness to news reports during our period of interest or that may be related to characteristics other than political affiliation. Second, we find a stronger attenuation when the sentiment in DJNW news reports deviates the most from the sentiment in comparable news sources, consistent with the view that in such cases investors may be more likely to perceive DJNW as biased. Third, we find that less informed investors and Democrat investors are mostly affected, such that they are less likely to trade in the direction implied by the sentiment content of DJNW reports.
One possible interpretation of our results is that the News Corporation takeover has indeed rendered DJNW politically biased (or exacerbated a pre-existing bias), and investors discount its reports. However, following the main approaches in the empirical literature on media bias (Puglisi and Snyder (Reference Puglisi, Snyder, Anderson, Waldfogel and Strömberg2015)), we find no evidence that DJNW becomes more pro-Republican or anti-Democrat after 2007. In particular, we document that the sentiment content of DJNW reports does not become more favorable to Republican stocks (or less favorable to Democrat stocks) following 2007, nor is there a change in its coverage related to the political affiliation of the stocks, or a change in the language used by DJNW news reports relative to alternative sources such as Reuters Newswires or the Associated Press.
One major implication of our results is that, if DJNW news reports do not contain a political slant after the News Corporation takeover (or if the takeover does not exacerbate a pre-existing slant), the attenuated stock price sensitivity to DJNW sentiment content suggests that stock prices fail to incorporate potentially valuable information. We test whether this is the case by forming a portfolio that goes long Republican stocks that receive DJNW news reports with more favorable sentiment and short Democrat stocks with less favorable sentiment (i.e., those whose price exhibits the most pronounced attenuation in response to DJNW sentiment content). Prior to the News Corporation takeover, the portfolio earns small returns that are statistically indistinguishable from 0; but following the announcement of the News Corporation bid, it earns significantly positive, large returns up until 2010 (Figure 2). This pattern matches the attenuated stock price sensitivity to DJNW sentiment illustrated in Figure 2 and is consistent with the notion that investors do not find DJNW news reports credible due to DJNW’s political affiliation, under-reacting to their information content.
This has material implications for liquidity and stock price informativeness. Positive DJNW news reports about Republican stocks and negative DJNW reports about Democrat stocks, to which the market becomes less responsive after the News Corporation takeover, are associated with higher bid–ask spreads and Amihud (Reference Amihud2002) illiquidity and lower firm-specific stock price information content.
Relation to the literature. Our work contributes to the literature on learning in financial markets and its impact on investor beliefs and stock prices (Pástor and Veronesi (Reference Pástor and Veronesi2009)). This literature examines how learning about cash flows and discount rates affects valuation (e.g., Pástor and Veronesi (Reference Pástor and Veronesi2003), (Reference Pástor and Veronesi2006)) and individual investor trading (e.g., Seru, Shumway, and Stoffman (Reference Seru, Shumway and Stoffman2010), Linnainmaa (Reference Linnainmaa2011)), typically assuming Bayesian learning. Other studies emphasize belief differences driven by behavioral biases such as overconfidence (e.g., Scheinkman and Xiong (Reference Scheinkman and Xiong2003), Hong, Scheinkman, and Xiong (Reference Hong, Scheinkman and Xiong2006)) or from attention and salience, finding evidence that investors can respond to stale news (Huberman and Regev (Reference Huberman and Regev2001), Tetlock (Reference Tetlock2011), Fedyk and Hodson (Reference Fedyk and Hodson2023), and Fedyk (Reference Fedyk2024)). Similar to this latter group, our results are consistent with investors responding to DJNW reports as if they contained a bias, despite no such bias being detectable.
A related group of studies analyzes how uncertainty and news about government policy affect stock prices (e.g., Pástor and Veronesi (Reference Pástor and Veronesi2012), (Reference Pástor and Veronesi2013), Baker, Bloom, and Davis (Reference Baker, Bloom and Davis2016), and Kelly, Pástor, and Veronesi (Reference Kelly, Pástor and Veronesi2016)). We argue that when political affiliation shapes the perceived credibility of a news source, stock prices may become less informative—even under rational Bayesian updating—and we provide evidence consistent with information-source attributes, including political affiliation, influencing investor responsiveness.Footnote 2
Our work also contributes to the empirical literature on politics and the media. This literature measures political slant in the media (Groseclose and Milyo (Reference Groseclose and Milyo2005), Gentzkow and Shapiro (Reference Gentzkow and Shapiro2010), Puglisi and Snyder (Reference Puglisi, Snyder, Anderson, Waldfogel and Strömberg2015), and Goldman, Gupta, and Israelsen (Reference Goldman, Gupta and Israelsen2024) provide a review) and the effects of politically biased news reporting on outcomes such as voting (DellaVigna and Kaplan (Reference DellaVigna and Kaplan2007), DellaVigna and Gentzkow (Reference DellaVigna and Gentzkow2010), Chiang and Knight (Reference Chiang and Knight2011), Martin and Yurukoglu (Reference Martin and Yurukoglu2017), Durante, Pinotti, and Tesei (Reference Durante, Pinotti and Tesei2019), and Wang (Reference Wang2021)) and corporate policies (Baloria and Heese (Reference Baloria and Heese2018), Knill, Liu, and McConnell (Reference Knill, Liu and McConnell2021)). Goldman et al. (Reference Goldman, Gupta and Israelsen2024) find evidence of political polarization in corporate financial news in the Wall Street Journal and the New York Times and relate it to trading volumes and herding. They focus on persuasion—whether politically distorted news reports induce distorted behavior in their audience (Prior (Reference Prior2013)). We take a different perspective and test whether a news provider’s political affiliation affects investors through credibility rather than persuasion. In this respect, our findings also relate to the literature on trust in information sources (Gentzkow et al. (Reference Gentzkow, Wong and Zhang2021), Cheng and Hsiaw (Reference Cheng and Hsiaw2022)). To the best of our knowledge, we provide the first empirical evidence that a specialized audience such as stock market investors is less responsive to a politically affiliated news source, suggesting that the survey evidence linking media affiliation to diminished trust may extend to professional audiences as well.
II. Background and Testable Hypotheses
A. The Takeover of Dow Jones & Co. by News Corporation
On May 1, 2007, News Corporation announced an unsolicited bid to take over Dow Jones & Company.Footnote 3 The acquisition was completed on Dec. 14, 2007, following a protracted public debate about journalistic values and political bias in the media. A concern emerged that Rupert Murdoch, News Corporation’s controlling shareholder, might meddle in editorial affairs, tilting the company’s outlets toward the right of the political spectrum (e.g., Bourgeois, Kapur, and Mussio (Reference Bourgeois, Kapur and Mussio2008)).
Commentators worried that News Corporation management were unlikely to uphold the Dow Jones code of conduct, and pointed out that Murdoch believed that “the rest of the press [wa]s liberal and that the conservative swing of his Fox News Channel and New York Post exist[ed] to correct that bias” (“Can Murdoch Pass the Stink Test?” Jack Shafer, Slate, May 29, 2007). Leslie Hill, a member of the Bancroft controlling family of Dow Jones opposed to the acquisition, resigned as director arguing that the deal implied “the loss of an independent global news organization with unmatched credibility and integrity” (“Dow Jones Enters News Corp. Fold,” Washington Post, Aug. 1, 2007). In a letter to readers, Wall Street Journal publisher L. Gordon Crovitz insisted that “the same standards of accuracy, fairness and authority will apply to this publication, regardless of ownership” (“A Report to Our Readers,” L. Gordon Crovitz, Wall Street Journal, Aug. 1, 2007). Some of the concerns voiced by the acquisition’s detractors appeared to be vindicated when Murdoch appointed Robert Thomson, described in the press as his “best friend,” as managing editor of the Wall Street Journal as well as editor-in-chief of DJNW in April 2008 (“Murdoch’s Best Friend,” Ken Auletta, New Yorker, Apr. 4, 2011).
B. Logic of the Test and Testable Hypotheses
We explain the logic behind our empirical tests by building on the economic arguments of Gentzkow and Shapiro (Reference Gentzkow and Shapiro2006).Footnote 4 Investors form beliefs about both the accuracy and potential bias of news outlets and update those beliefs as new information arrives. Assume that DJNW reports are, in fact, unbiased; however, investors may suspect otherwise after the News Corporation takeover, given the political orientation of its controlling shareholder. We ask how this perceived possibility of bias might shape how investors interpret and react to DJNW news reports about Republican and Democrat stocks.
Before the takeover, investors have no reason to question DJNW’s neutrality and interpret its reports at face value. After the takeover, however, they develop a prior that DJNW would slant its coverage in favor of Republican stocks and against Democrat ones. This assumption is consistent with evidence that audiences tend to associate media outlets with the political views of their owners and that such associations affect credibility assessments (Federal Communications Commission (2003), Gallup (2020), and Gentzkow et al. (Reference Gentzkow, Wong and Zhang2021)). As investors read DJNW articles, they infer not only information about firms but also about DJNW’s reliability. Favorable reports on Republican stocks and unfavorable reports on Democrat stocks are consistent with the perception of a pro-Republican bias, leading investors to discount those reports. As a result, stock prices react less strongly to the sentiment content of DJNW coverage that fits the perceived bias.
This reasoning yields two predictions. First, if investors become uncertain about the outlet’s neutrality, the short-run market response to its reports weakens. The attenuation should be strongest when the reports align with the suspected direction of bias (i.e., when they are favorable for Republican stocks or unfavorable for Democrat ones) and more pronounced when the prior belief in bias is stronger:
Hypothesis 1. (a) After the News Corporation takeover, stock prices become less responsive to DJNW sentiment content. (b) The attenuated stock price responsiveness to DJNW sentiment is associated with favorable news reports about Republican stocks and unfavorable news reports about Democrat stocks.
Over time, however, investors observe information about firms’ fundamentals that allows them to verify whether the original DJNW reports were accurate. When ex post outcomes contradict investors’ discounted interpretation of the news (e.g., when a Republican stock later performs well after an initially discounted favorable report) beliefs adjust upward, generating long-run return reversals:
Hypothesis 2. After the News Corporation takeover, DJNW news reports with more favorable sentiment about Republican stocks are associated with higher long-run returns on those stocks, and DJNW news reports with less favorable sentiment about Democrat stocks are associated with lower long-run returns on those stocks.
III. Data and Main Variables
We combine the sentiment scores of Dow Jones Newswires news reports and corporate press releases from the RavenPack news analytics database; from Factiva, the texts of news reports from Dow Jones Newswires, Reuters Newswire, and Associated Press (and, for a set of robustness checks, from the Wall Street Journal); political contributions from the Federal Elections Commission (FEC); institutional investor trades from Abel Noser Solutions (formerly Ancerno; we henceforth refer to it as Ancerno for brevity); daily stock prices and returns from CRSP; balance sheets from Compustat; analyst recommendations from IBES; institutional investor holdings from Thomson Reuters 13F filings. A description of the main data sources and variables follows. We provide detailed definitions of all variables in the Appendix.
A. News Sentiment Content
Most of our tests exploit the sentiment content of Dow Jones Newswires (DJNW) news reports over the period from 2003 to 2012 (i.e., 5 years before and after the News Corporation takeover). We obtain these data from RavenPack, a leading provider of real-time news analytics used by hedge funds, mutual funds, and large banks to incorporate information from the news into their investment process. RavenPack identifies the news event discussed in each news article (e.g., earnings announcements, M&As), the companies they mention, and how relevant the article is for them.
RavenPack analyzes the content of DJNW articles and generates an Event Sentiment Score (
$ ESS $
 ), which indicates the tone of the article. The
$ ESS $
), which indicates the tone of the article. The
$ ESS $
 is expressed on a scale from 0 (most negative sentiment) to 100 (most positive sentiment). As described in Table 1, the average level of the raw
$ ESS $
is expressed on a scale from 0 (most negative sentiment) to 100 (most positive sentiment). As described in Table 1, the average level of the raw
$ ESS $
 score in our sample is 52 (standard deviation: 13). For example, when Amazon increases its jewelry and watches sales by more than 120% in 2006, the
$ ESS $
score in our sample is 52 (standard deviation: 13). For example, when Amazon increases its jewelry and watches sales by more than 120% in 2006, the
$ ESS $
 score is 90; and when, also in 2006, Google is reported as losing 8%–12% market share in the search engine market in China, the sentiment score is 20. We average the
$ ESS $
score is 90; and when, also in 2006, Google is reported as losing 8%–12% market share in the search engine market in China, the sentiment score is 20. We average the
$ ESS $
 across all non-press-release DJNW articles associated with a given firm on a given day and we base most of our analysis on its decile rank, which we refer to as
$ DJ\_ Sent $
across all non-press-release DJNW articles associated with a given firm on a given day and we base most of our analysis on its decile rank, which we refer to as
$ DJ\_ Sent $
 . We separately obtain a sentiment score based on RavenPack’s
$ ESS $
. We separately obtain a sentiment score based on RavenPack’s
$ ESS $
 associated with corporate press releases.

TABLE 1 Long description
Panel A, at the top, lists variables in the first column: ESS, Republican, Market equity in billion dollars, Leverage, Book-to-market, R O A, C A R minus eleven to minus two in percentage points, and C A R minus one to one in percentage points. For each variable, columns from left to right show mean, standard deviation, twenty-fifth percentile, fiftieth percentile, and seventy-fifth percentile. For example, ESS has a mean of 51.972, standard deviation 12.663, twenty-fifth percentile 41.500, fiftieth percentile 51.333, and seventy-fifth percentile 61.333. Market equity has a mean of 34.960, standard deviation 57.101, twenty-fifth percentile 3.752, fiftieth percentile 13.390, and seventy-fifth percentile 37.299. Panel B, below, compares Republican and Democrat firms before and after the News Corp. acquisition. The first column lists variables: ESS, Market equity in billion dollars, Leverage, Book-to-market, R O A, and C A R minus eleven to minus two in percentage points. For each variable, columns from left to right show Republican mean, Democrat mean, and t-statistic before the acquisition, then Republican mean, Democrat mean, and t-statistic after the acquisition. For example, before the acquisition, ESS is 52.525 for Republicans and 52.574 for Democrats with a t-statistic of minus 0.27; after, ESS is 51.508 for Republicans and 51.577 for Democrats with a t-statistic of minus 0.45. Market equity before is 34.232 for Republicans and 47.556 for Democrats with a t-statistic of minus 1.53; after, 27.567 for Republicans and 32.200 for Democrats with a t-statistic of minus 1.25. Leverage before is 0.244 for Republicans and 0.262 for Democrats with a t-statistic of minus 1.14; after, 0.261 for Republicans and 0.253 for Democrats with a t-statistic of 0.71. Book-to-market before is 0.523 for Republicans and 0.487 for Democrats with a t-statistic of 1.56; after, 0.747 for Republicans and 0.724 for Democrats with a t-statistic of 0.60. R O A before is 0.055 for Republicans and 0.047 for Democrats with a t-statistic of 1.49; after, 0.042 for Republicans and 0.041 for Democrats with a t-statistic of 0.16. C A R minus eleven to minus two before is 0.071 for Republicans and 0.003 for Democrats with a t-statistic of 1.61; after, minus 0.016 for Republicans and minus 0.019 for Democrats with a t-statistic of 0.04.
In several tests, we examine an alternative sentiment score, based on the text of news pieces collected from Factiva, a news search engine. The score is built using textual analysis tools based on Loughran and McDonald (Reference Loughran and McDonald2011) and exploiting a dictionary-based method that counts the frequency of positive and negative words in texts.Footnote 5 As in the case of the sentiment score based on RavenPack data, we base the analysis on the decile ranks of the dictionary-based sentiment scores. We apply this approach to obtain an alternative measure of sentiment for DJNW news pieces, as well as for news pieces from Reuters Newswire and the Associated Press.Footnote 6
B. Corporate Political Affiliation
We use corporate political contributions to quantify a company’s political affiliation as perceived by investors. We retrieve data on corporate political contributions from the Federal Election Commission (FEC) detailed committee contribution files, for the period from 2003 to 2012. Political contributions are a key component of a company’s public image, as they are publicly disclosed on the FEC website and frequently commented upon in the media.Footnote 7 For this reason, the political science and political economy of finance literatures use them as a proxy for the political affiliation of a corporation (Cooper, Gulen, and Ovtchinnikov (Reference Cooper, Gulen and Ovtchinnikov2010), Bonica (Reference Bonica2014), Correia (Reference Correia2014), and Ahn, Kim, and Lee (Reference Ahn, Kim and Lee2019)) or of its managers and employees (Cohen, Hazan, Tallarita, and Weiss (Reference Cohen, Hazan, Tallarita and Weiss2019), Babenko, Fedaseyeu, and Zhang (Reference Babenko, Fedaseyeu and Zhang2020)). Contributions reflect the stance of the firm’s management and ownership, its business, as well as any corporate actions that have political nature to the eyes of the public, acting as a “sufficient statistic” for the perception of the firm’s political alignment. In principle, this does not require that investors be aware of the firm’s actual contributions—just that those contributions relate to the firm’s public image as closer to the Democrats or the Republicans.Footnote 8
To categorize a firm on the Democrat–Republican spectrum as a function of its political contributions, we define the
$ Republican $
 variable as
$ Rep/\left( Rep+ Dem\right) $
variable as
$ Rep/\left( Rep+ Dem\right) $
 , where
$ Rep $
, where
$ Rep $
 is the dollar value of the firm’s contributions to the Republican party, and
$ Dem $
is the dollar value of the firm’s contributions to the Republican party, and
$ Dem $
 to the Democrat party. The higher the value of
$ Republican $
to the Democrat party. The higher the value of
$ Republican $
 , the more “Republican-leaning” the stock. Although this variable is continuous, for ease of exposition throughout the article, we describe a stock as “Republican” (“Democrat”) if
$ Republican $
, the more “Republican-leaning” the stock. Although this variable is continuous, for ease of exposition throughout the article, we describe a stock as “Republican” (“Democrat”) if
$ Republican $
 is above (below) the median value each year.Footnote
9
is above (below) the median value each year.Footnote
9
Firms in our sample contribute slightly more to the Republican party, with an average
$ Republican $
 equal to 0.58 (standard deviation: 0.22, Table 1).Footnote
10 Political affiliation is persistent: Nearly 60% of stocks retain the same political alignment as in their first contributing year throughout our sample period (Figure I.2 in the Supplementary Material). In total, we have 774 distinct U.S. stocks.
equal to 0.58 (standard deviation: 0.22, Table 1).Footnote
10 Political affiliation is persistent: Nearly 60% of stocks retain the same political alignment as in their first contributing year throughout our sample period (Figure I.2 in the Supplementary Material). In total, we have 774 distinct U.S. stocks.
C. Other Data and Sample Characteristics
We supplement the main data with firm balance sheet data from Compustat, stock price information from CRSP, analyst recommendations from IBES, institutional investor holdings from Thomson Reuters 13F filings, and institutional investor trading data from Ancerno.Footnote 11 All the variables are defined in detail in the Appendix.
We provide descriptive statistics in Table 1. Panel A presents summary statistics for the main variables in our sample. Panel B compares the main characteristics of Republican and Democrat stocks before and after the News Corporation takeover. Firms in our sample have an average market capitalization of $35 billion. They have an average leverage of 26% and an average book-to-market ratio of 0.63. These figures are comparable to those reported by Cooper et al. (Reference Cooper, Gulen and Ovtchinnikov2010), who also merge the FEC and CRSP/Compustat data. Republican and Democrat stocks are, on the other hand, similar in terms of the main observable characteristics, such as size (market value of equity), book-to-market ratio, profitability (ROA), and leverage ratio.
IV. Changes in Sensitivity to DJNW Sentiment Around the News Corporation Takeover
A. Baseline Results
To study the sensitivity of the market price of Democrat and Republican stocks to DJNW sentiment following the acquisition by News Corporation, we estimate

The dependent variable is the 3-day (−1, +1) cumulative abnormal return on stock
$ i $
 around news report date
$ t $
around news report date
$ t $
 relative to the Fama–French–Carhart 4-factor model.Footnote
12
$ DJ\_ Sent $
relative to the Fama–French–Carhart 4-factor model.Footnote
12
$ DJ\_ Sent $
 is the sentiment associated with a news report from DJNW, defined in Section III.A.
$ Post $
is the sentiment associated with a news report from DJNW, defined in Section III.A.
$ Post $
 is an indicator variable equal to 1 starting from the completion day of the News Corporation takeover on Dec. 14, 2007, and 0 prior to that date.
$ {\alpha}_i $
is an indicator variable equal to 1 starting from the completion day of the News Corporation takeover on Dec. 14, 2007, and 0 prior to that date.
$ {\alpha}_i $
 and
$ {\alpha}_{jt} $
and
$ {\alpha}_{jt} $
 denote firm and industry
$ \times $
denote firm and industry
$ \times $
 date fixed effects. The standard errors are clustered around calendar dates. The vector of
$ Controls $
date fixed effects. The standard errors are clustered around calendar dates. The vector of
$ Controls $
 includes firm size, leverage, book-to-market ratio, ROA, as well as the cumulative abnormal return over the 10-day period prior to the news report date, interacted with the
$ Post $
includes firm size, leverage, book-to-market ratio, ROA, as well as the cumulative abnormal return over the 10-day period prior to the news report date, interacted with the
$ Post $
 indicator.
The results are reported in Table 2, Panel A. We first estimate equation (1) for stocks with a political affiliation (column 1). The coefficient on the
$ Post\times DJ\_ Sent $
 interaction term is negative for the politically affiliated stocks, indicating that their prices are less responsive to DJNW news report sentiment after the News Corporation takeover. To gauge the economic magnitude of the effects implied by our estimates, consider the difference in returns associated with news reports in the top and bottom sentiment deciles (
$ DJ\_ Sent= $
interaction term is negative for the politically affiliated stocks, indicating that their prices are less responsive to DJNW news report sentiment after the News Corporation takeover. To gauge the economic magnitude of the effects implied by our estimates, consider the difference in returns associated with news reports in the top and bottom sentiment deciles (
$ DJ\_ Sent= $
 1 and 0.1) for the politically affiliated stocks. Prior to the News Corporation takeover, the difference is 1.14 percentage points (
$ =1.264\times \left(1-0.1\right) $
1 and 0.1) for the politically affiliated stocks. Prior to the News Corporation takeover, the difference is 1.14 percentage points (
$ =1.264\times \left(1-0.1\right) $
 ); after the takeover, it is 0.56 percentage points (
$ =\left(1.264-0.647\right)\times \left(1-0.1\right) $
); after the takeover, it is 0.56 percentage points (
$ =\left(1.264-0.647\right)\times \left(1-0.1\right) $
 ). This indicates a substantial drop in the sensitivity of stock prices the sentiment content of DJNW news reports. These results are consistent with our testable Hypothesis 1(a) as well as with the visual evidence of Figure 2.

TABLE 2 Long description
Panel A. Full Sample.
This panel includes three columns of regression results.
Row 1: D J Sent times Post times Republican. Column 3 is minus 0.783 with a t-stat of minus 3.34.
Row 2: D J Sent times Post. Column 1 is minus 0.647 t-stat minus 12.03. Column 2 is minus 0.055 t-stat minus 0.39. Column 3 is minus 0.208 t-stat minus 1.37.
Row 3: D J Sent times Republican. Column 3 is 0.083 t-stat 0.48.
Row 4: Post times Republican. Column 3 is 0.541 t-stat 3.58.
Row 5: D J Sent. Column 1 is 1.264 t-stat 31.07. Column 2 is 2.372 t-stat 23.86. Column 3 is 1.211 t-stat 10.53.
Row 6: Republican. Column 3 is minus 0.085 t-stat minus 0.77.
All columns include Firm controls and Industry times Date and firm F E.
R-squared values are 0.167, 0.269, and 0.167 respectively.
Number of observations: Column 1 is 322,973. Column 2 is 96,182. Column 3 is 322,879.
Panel B. Positive/Negative D J N W Sentiment and Corporate Political Affiliation.
This panel is divided by Stock Political Affiliation: Democrat (Columns 1 and 2) and Republican (Columns 3 and 4), further split by Negative and Positive D J N W Sentiment.
Row 1: D J Sent times Post. Column 1 (Democrat Negative) is minus 0.571 t-stat minus 2.25. Column 2 (Democrat Positive) is 0.092 t-stat 0.47. Column 3 (Republican Negative) is 0.225 t-stat 0.79. Column 4 (Republican Positive) is minus 0.570 t-stat minus 2.57.
Row 2: D J Sent. Column 1 is 0.633 t-stat 3.34. Column 2 is 1.487 t-stat 10.89. Column 3 is 0.438 t-stat 2.16. Column 4 is 1.841 t-stat 11.86.
All columns include Firm controls and Industry times Date and firm F E.
R-squared values range from 0.292 to 0.332.
Number of observations range from 65,958 to 84,241.
We contrast these estimates with those for politically unaffiliated stocks in column 2.Footnote
13 In that sample, the coefficient on
$ Post\times DJ\_ Sent $
 is small and statistically indistinguishable from 0; the difference between the estimates for affiliated and unaffiliated stocks is highly statistically significant (F-stat: 15.56, P-value
$ < $
is small and statistically indistinguishable from 0; the difference between the estimates for affiliated and unaffiliated stocks is highly statistically significant (F-stat: 15.56, P-value
$ < $
 0.01). The fact that we find no attenuation for the unaffiliated stocks suggests that the attenuation effect detected in column 1 is related to political affiliation (as opposed to, for instance, some omitted variable characterizing stocks covered by DJNW news reports). It also helps us rule out one alternative interpretation where investors simply stop reading DJNW. If that were the case, we should observe a significant drop in the sensitivity of stock returns to the sentiment of politically unaffiliated stocks as well. Building on this result, in the remainder of the analysis we focus on firms that have political affiliation.
Hypothesis 1(b) predicts that the attenuated stock price responsiveness to DJNW sentiment is driven by favorable news reports about Republican stocks and unfavorable news reports about Democrat stocks. To test this hypothesis, we restrict the attention to stocks with a political affiliation and estimate:

The coefficient
$ {\beta}_7 $
 in equation (2) is associated with Hypothesis 1(b), as it modulates the stock return’s sensitivity to DJNW sentiment depending on the stock’s political affiliation, captured by the variable
$ Republican $
in equation (2) is associated with Hypothesis 1(b), as it modulates the stock return’s sensitivity to DJNW sentiment depending on the stock’s political affiliation, captured by the variable
$ Republican $
 . In column 3, the estimate of coefficient
$ {\beta}_7 $
. In column 3, the estimate of coefficient
$ {\beta}_7 $
 is significantly negative, suggesting a lower responsiveness to more favorable DJNW sentiment for Republican stocks (or to less favorable DJNW sentiment for Democrat stocks), in line with Hypothesis 1(b).Footnote
14
is significantly negative, suggesting a lower responsiveness to more favorable DJNW sentiment for Republican stocks (or to less favorable DJNW sentiment for Democrat stocks), in line with Hypothesis 1(b).Footnote
14
For ease of interpretation, in Panel B, we also directly estimate equation (1) separately for Democrat and Republican stocks (
$ Republican $
 below/above the median) and for unfavorable/favorable DJNW sentiment (RavenPack
$ ESS $
below/above the median) and for unfavorable/favorable DJNW sentiment (RavenPack
$ ESS $
 score below/above 50).Footnote
15 We find that the attenuated sensitivity to DJNW sentiment is concentrated among favorable DJNW sentiment for Republican stocks and unfavorable DJNW sentiment for Democrat stocks (i.e., for news reports that align with Dow Jones’s political affiliation). These findings are in line with the previous results and with Hypothesis 1(b).Footnote
16
score below/above 50).Footnote
15 We find that the attenuated sensitivity to DJNW sentiment is concentrated among favorable DJNW sentiment for Republican stocks and unfavorable DJNW sentiment for Democrat stocks (i.e., for news reports that align with Dow Jones’s political affiliation). These findings are in line with the previous results and with Hypothesis 1(b).Footnote
16
In sum, the prices of politically affiliated stocks become less sensitive to DJNW sentiment following the News Corporation takeover, especially so for Republican stocks receiving favorable DJNW commentary and for Democrat stocks receiving unfavorable commentary. These results are in line with Hypotheses 1(a) and (b) and consistent with the notion that investors believe that the DJNW becomes less credible due to its political affiliation after the takeover.Footnote 17
We subject these baseline results to a battery of robustness checks, reported in Table 3. First, they are not sensitive to using alternative measures of corporate political affiliation, such as the proxies based on the firm’s cumulative political contributions up until a given year (lifetime contributions), the ones based on the firm’s total contributions over our entire sample period (total contributions), the two measures used by Babenko et al. (Reference Babenko, Fedaseyeu and Zhang2020), the proxies based on the individual contributions of the firm’s employees other than the CEO, and total individual contributions including the CEO’s. We also find qualitatively similar results when we look at a measure of corporate political affiliation not based on political contributions: the political sensitivity of the stock price to the Republican Party (Addoum and Kumar (Reference Addoum and Kumar2006)).

TABLE 3 Long description
The table consists of five columns: (1) Sent times Post times Republican, (2) t-Stat, (3) Sent times Post, (4) t-Stat, and (5) N.
* Baseline: -0.783, -3.34, -0.208, -1.37, 322,879.
* Panel A. Alternative Measures for Political Affiliation:
- Lifetime political contributions: -1.239, -4.06, 0.072, 0.37, 322,910.
- Total political contributions: -0.752, -2.25, -0.210, -1.02, 322,973.
- Employee contributions: -0.532, -2.60, -0.402, -3.26, 287,966.
- C E O and Employee contributions: -0.566, -2.76, -0.382, -3.05, 289,205.
- Political sensitivity: -9.522, -3.31, -0.585, -9.39, 266,674.
* Panel B. Alternative Sentiment Measures:
- Average Dow Jones E S S / 100: -1.735, -3.13, -0.489, -1.37, 322,879.
- D J bar Score: -0.664, -2.00, 0.191, 0.90, 180,422.
* Panel C. Additional Controls:
- Press Release sentiment: -0.770, -3.28, -0.251, -1.64, 322,879.
- Reuters Newswire sentiment: -0.772, -3.30, -0.199, -1.31, 322,879.
- Associated Press sentiment: -0.777, -3.32, -0.192, -1.27, 322,879.
- All alternative sentiment: -0.757, -3.23, -0.226, -1.48, 322,879.
- Analyst coverage, inst. ownership: -0.772, -3.29, -0.223, -1.46, 322,081.
* Panel D. Alternative Fixed Effects:
- Additional: state times date: -0.956, -3.58, -0.084, -0.49, 299,234.
- Republican (0/1) times industry times date and firm: -0.639, -2.55, -0.260, -1.59, 316,955.
- Industry times date and firm times year: -0.801, -3.28, -0.212, -1.33, 322,875.
* Panel E. Investor Trading Behaviors and Analyst Recommendations:
- Net buyer indicator: -0.094, -2.73, 0.041, 1.85, 271,343.
- Trading imbalance: -0.098, -2.12, 0.036, 1.21, 271,343.
- Recommendation percentage change: -0.022, -2.23, 0.013, 2.07, 45,677.
- Recommendation up% minus down%: -0.031, -2.40, 0.022, 2.71, 48,111.

TABLE 4 Long description
The table consists of three columns representing different sentiment sources: 1 Press Releases, 2 Reuters Newswire, and 3 Associated Press.
Row-by-row data breakdown:
* Sent times Post times Republican: Column 1 is minus 0.016 with t-stat minus 0.03. Column 2 is minus 0.042 with t-stat minus 0.10. Column 3 is 0.099 with t-stat 0.24.
* Sent times Post: Column 1 is 0.039 with t-stat 0.13. Column 2 is 0.250 with t-stat 0.95. Column 3 is 0.059 with t-stat 0.24.
* Sent times Republican: Column 1 is 0.194 with t-stat 0.68. Column 2 is 0.028 with t-stat 0.11. Column 3 is minus 0.309 with t-stat minus 1.27.
* Post times Republican: Column 1 is 0.298 with t-stat 1.12. Column 2 is 0.223 with t-stat 0.71. Column 3 is 0.214 with t-stat 0.78.
* Sent: Column 1 is 0.294 with t-stat 1.51. Column 2 is 0.856 with t-stat 4.91. Column 3 is 0.985 with t-stat 6.22.
* Republican: Column 1 is 0.009 with t-stat 0.05. Column 2 is 0.121 with t-stat 0.63. Column 3 is 0.053 with t-stat 0.30.
* Firm controls: Yes for all three columns.
* Industry times Date and Firm F E: Yes for all three columns.
* R super 2: Column 1 is 0.253. Column 2 is 0.259. Column 3 is 0.256.
* Number of observations: Column 1 is 99,407. Column 2 is 138,717. Column 3 is 138,166.
Second, our results are not sensitive to the measure of news report sentiment as well. Indeed, similar results are obtained whether we consider a continuous measure or rely on the sentiment score based on textual analysis of DJNW news reports described in Section III.A, which is based on a different methodology.Footnote 18
Third, our results are robust to the inclusion of additional control variables to account for the information environment of the firms (such as analyst coverage and institutional ownership), to controlling for sentiment from alternative news sources (i.e., Reuters Newswire, Associated Press, and corporate press releases),Footnote
19 and to the inclusion of combinations of fixed effects: state
$ \times $
 date fixed effects that account for local political environment, industry
$ \times $
date fixed effects that account for local political environment, industry
$ \times $
 date and firm
$ \times $
date and firm
$ \times $
 year fixed effects, or firm fixed effects and industry
$ \times $
year fixed effects, or firm fixed effects and industry
$ \times $
 date fixed effects interacted with an indicator for Republican stocks.Footnote
20
date fixed effects interacted with an indicator for Republican stocks.Footnote
20
Fourth, we find similar results if, instead of looking at stock returns, we focus on trades by institutional investors and on analyst recommendations. This suggests that their behavior is also consistent with a reduced credibility of DJNW news reports to their eyes.Footnote 21
B. Placebo Tests; Contrast Between DJNW and Other News Sources
We perform two further tests to clarify the interpretation of our results. First, we run placebo tests to rule out that our results reflect a general decline in the market’s sensitivity to news or fundamental economic changes affecting Republican and Democrat stocks differently during the period around the News Corporation takeover. We examine the sentiment content of news sources similar to DJNW but whose political affiliation does not change during this period: Reuters Newswire, Associated Press, and corporate press releases. Reuters Newswire and Associated Press are business-focused wires comparable to DJNW, and corporate press releases also tend to focus on factual and numerical content. If our results were explained by a broad attenuation in market responsiveness or by fundamentals differentially affecting Republican and Democrat stocks, we should find similar results using these alternative news sources.
We estimate equation (2) replacing
$ DJ\_ Sent $
 by the sentiment measures associated with the alternative news sources. We find no drop in the sensitivity of the stock price to any of the alternative news sentiment measures, regardless of the stock’s political affiliation. In other words, the market appears to consider Reuters Newswire, Associated Press, and press releases just as credible after December 2007 as before, ruling out the potential alternative explanations.Footnote
22 More generally, the estimates from these placebo tests are inconsistent with any “macro” drivers, for example, related to the 2008 financial crisis, as these drivers should have an identical impact on the alternative sources.Footnote
23
by the sentiment measures associated with the alternative news sources. We find no drop in the sensitivity of the stock price to any of the alternative news sentiment measures, regardless of the stock’s political affiliation. In other words, the market appears to consider Reuters Newswire, Associated Press, and press releases just as credible after December 2007 as before, ruling out the potential alternative explanations.Footnote
22 More generally, the estimates from these placebo tests are inconsistent with any “macro” drivers, for example, related to the 2008 financial crisis, as these drivers should have an identical impact on the alternative sources.Footnote
23
Second, in Table 5, we relate our results to the divergence between news reports by DJNW and other news sources. To proxy for the divergence between DJNW and other news sources, for each firm on each date we compute the standardized absolute distance between DJNW sentiment score
$ DJ\_ Sent $
 and the sentiment from corporate press releases (
$ PR\_ Sent $
and the sentiment from corporate press releases (
$ PR\_ Sent $
 ) and news reports from Reuters Newswire (
$ RN\_ Sent $
) and news reports from Reuters Newswire (
$ RN\_ Sent $
 ), and Associated Press (
$ AP\_ Sent $
), and Associated Press (
$ AP\_ Sent $
 ).Footnote
24 The attenuation effect appears mainly driven by cases of large divergence in sentiment between the DJNW and the alternative news sources, and we do not observe any effects when DJNW sentiment closely aligns with other sources, consistent with investors discounting DJNW sentiment more when they can observe a contrast between it and other news sources.Footnote
25 Moreover, they suggest that comparing DJNW’s news with alternative sources might facilitate investors’ learning.Footnote
26
).Footnote
24 The attenuation effect appears mainly driven by cases of large divergence in sentiment between the DJNW and the alternative news sources, and we do not observe any effects when DJNW sentiment closely aligns with other sources, consistent with investors discounting DJNW sentiment more when they can observe a contrast between it and other news sources.Footnote
25 Moreover, they suggest that comparing DJNW’s news with alternative sources might facilitate investors’ learning.Footnote
26

TABLE 5 Long description
From left to right, the table presents two columns labeled Low and High under Sentiment Divergence. Each column contains values for interaction terms and main effects. The first row shows D J Sent times Post times Republican with coefficients negative zero point one nine nine and negative two point six five four, and t-statistics negative zero point seven six and negative four point three six. The next row lists D J sent times Post with coefficients negative zero point four six nine and zero point seven eight eight, and t-statistics negative two point seven four and two point one two. D J sent times Republican has coefficients negative zero point three nine two and one point six two eight, t-statistics negative two point zero seven and three point eight three. Post times Republican yields coefficients zero point one three eight and one point eight five four, t-statistics zero point eight three and four point five six. D J sent alone has coefficients one point four one zero and zero point four two three, t-statistics ten point nine zero and one point five three. Republican alone has coefficients zero point one eight six and negative zero point nine four two, t-statistics one point five seven and negative three point one six. The Difference F-test statistic and P-value are thirteen point seven nine and zero point zero zero zero for both columns. Firm controls, Industry times Date and firm fixed effects are marked Y for both columns. R squared values are zero point two zero one for Low and zero point two eight four for High. Number of observations is two hundred twenty thousand seven hundred seventy-five for Low and ninety-four thousand seven hundred forty-seven for High.
V. DJNW Readership Change; Value of DJNW News Reports; Impact on Liquidity and Stock Price Information Content
Our results so far indicate an attenuated stock price reaction to DJNW news reports, consistent with investors responding to Dow Jones & Co.’s political affiliation after the News Corporation takeover. We ask next if this response is related to DJNW’s readership contracting or DJNW becoming less informative/credible, or if instead investors are neglecting potentially valuable information. We articulate this analysis in five parts. First, we examine whether DJNW experiences a contraction in its readership. Second, we test whether there is any evidence of a change in pro-Republican/anti-Democrat bias in DJNW news reports after the News Corporation takeover. Third, we assess the type of investors who become less responsive to DJNW news reports after the takeover. Fourth, we investigate whether following DJNW news reports leads to trading gains and ignoring them leads to trading losses. Fifth, we test whether the attenuated response to DJNW news reports is associated with measures of liquidity and stock price information content.
A. A Contraction in DJNW Readership?
One possibility is that the readership of DJNW contracts as investors perceive it as biased. As a result, fewer investors place weight on DJNW’s reporting, leading to a weaker reaction to the sentiment content in DJNW. However, this mechanism is unlikely to explain our results because explaining the differences in the sensitivity changes between politically affiliated and unaffiliated firms, as well as between Republican and Democrat firms, would require DJNW’s readership to be systematically correlated with the political affiliation of the stocks it covers. For example, one would need to posit that certain readers subscribed to DJNW specifically to follow news about Republican firms (but not Democrat firms) before the takeover and subsequently discontinued their subscriptions. However, it is unclear why a politically unaffiliated reader would focus exclusively on news about Republican firms. Moreover, a Republican with a preference for news about Republican firms would have little reason to lose trust in DJNW and unsubscribe after the takeover. In contrast, if such a reader were instead a Democrat, it is even less likely that she would concentrate on Republican firms; she would more likely follow Democrat firms, in which case any post-takeover disengagement would imply a larger decline in sensitivity for Democrat stocks, working against our results.
In addition to these observations, we assess the change in DJNW readership. To the best of our knowledge, no database tracks DJNW subscriptions around the News Corporation acquisition directly. Two pieces of evidence, however, suggest that a pronounced contraction of DJNW’s readership is unlikely.
First, we assess potential staff reductions by comparing the number of DJNW journalists from the 10-K statements of Dow Jones & Company for the years before the takeover and 10-Ks from News Corporation for subsequent years. The evidence suggests that the number of DJNW journalists remains stable, implying no significant staff cuts (Figure I.3 in the Supplementary Material, left axis). This is consistent with the notion that there was no major audience loss.
Second, we use circulation statistics from The Wall Street Journal (WSJ), owned by the same company Dow Jones & Co., as another indirect approach.Footnote 27 Had DJNW lost readers due to a decline in trust, WSJ circulation would have likely dropped as well because of its greater potential for biased content. We find, however, no evidence of declining readership in WSJ (Figure I.3 in the Supplementary Material, right axis).
Taken together, these results suggest that a substantial drop in DJNW readership following the News Corporation acquisition is not likely.Footnote 28
B. A Political Slant in DJNW News Reports After the News Corporation Takeover?
The nature of DJNW newswires, which report mainly factual and quantitative information, suggests that they do not easily lend themselves to a political slant. In addition, the readers of DJNW newswires are primarily professionals in the finance industry who value accuracy, thus the incentives for DJNW to slant news reports to cater to readers’ political preferences are also limited (Mullainathan and Shleifer (Reference Mullainathan and Shleifer2005), Gentzkow and Shapiro (Reference Gentzkow and Shapiro2006), (Reference Gentzkow and Shapiro2010)).
In addition to these observations, we run formal tests to assess the likelihood of a slant in DJNW news reports. Puglisi and Snyder (Reference Puglisi, Snyder, Anderson, Waldfogel and Strömberg2015) classify three approaches to measure media bias: i) the “tone” approach, which looks at the sentiment content of news reports, ii) the “issue intensity” approach, which looks at the frequency with which news items are covered by a given media source, and iii) the “comparison” approach, which compares the language used by a given media source to a benchmark. We employ all three approaches.
First, we test whether DJNW news reports become more favorable to Republican stocks or less favorable to Democrat stocks after the News Corporation takeover. In terms of Puglisi and Snyder’s (Reference Puglisi, Snyder, Anderson, Waldfogel and Strömberg2015) taxonomy, this test follows the “tone” approach. We estimate

where the dependent variable is the DJNW sentiment
$ DJ\_ Sent $
 . We report the results in Panel A of Table 6. We find a small and insignificant negative coefficient on the
$ Republican\times Post $
. We report the results in Panel A of Table 6. We find a small and insignificant negative coefficient on the
$ Republican\times Post $
 interaction term, suggesting that DJNW reports do not become systematically more favorable to Republican stocks (or less favorable to Democrat stocks (column 1). A similar result obtains if we replace
$ DJ\_ Sent $
interaction term, suggesting that DJNW reports do not become systematically more favorable to Republican stocks (or less favorable to Democrat stocks (column 1). A similar result obtains if we replace
$ DJ\_ Sent $
 by an alternative sentiment score based on textual analysis of DJNW articles retrieved from Factiva (column 2).Footnote
29 These results suggest that the average DJNW sentiment for Republican firms remains unchanged.
by an alternative sentiment score based on textual analysis of DJNW articles retrieved from Factiva (column 2).Footnote
29 These results suggest that the average DJNW sentiment for Republican firms remains unchanged.

TABLE 6 Long description
Panel A at the top presents sentiment changes with columns for D J Sent and D J Score. The first row shows Republican times Post with values minus 0.009 and minus 0.012, and t-statistics minus 1.45 and minus 1.14. The next row shows Republican with minus 0.009 and 0.017, and t-statistics minus 1.87 and 1.87. Firm controls and industry times date and firm fixed effects are marked Y in both columns. R squared values are 0.222 and 0.287. Number of observations are 323,069 and 184,617. Panel B in the middle displays coverage changes with four columns: Incl. Zero, Excl. Zero, Negative, and Positive. Republican times Post has values 0.013, minus 0.001, minus 0.002, minus 0.008, and t-statistics 0.49, minus 0.04, minus 0.05, minus 0.24. Republican has minus 0.014, minus 0.005, 0.018, minus 0.000, and t-statistics minus 0.65, minus 0.26, 0.69, minus 0.02. Firm controls and industry times date and firm fixed effects are Y in all columns. Pseudo-R squared values are 0.201, 0.195, 0.226, 0.242. Number of observations are 432,163, 323,069, 150,095, 166,554. Panel C at the bottom shows textual similarity changes with columns for Associated Press and Reuters Newswire. Republican times Post has values minus 0.024 and minus 0.008, and t-statistics minus 1.48 and minus 0.49. Republican has 0.024 and 0.025, and t-statistics 1.81 and 1.93. Firm controls and industry times date and firm fixed effects are Y in both columns. R squared values are 0.504 and 0.438. Number of observations are 68,291 and 74,408.
We also address the possibility that, even though on average, DJNW sentiment does not change for Republican firms, the sentiment distribution does, and that DJNW sentiment for Republican firms tends to diverge more from alternative sources. Quantile regressions reveal no evidence of a change in the distribution of DJNW sentiment for Republican firms (Table I.11 in the Supplementary Material); tests across various subsamples find no systematic increase in sentiment divergence for Republican firms (Table I.12 in the Supplementary Material); and the analysis of sentiment from alternative sources (press releases, Reuters Newswire, and Associated Press) suggests no evidence of worsening sentiment for Republican stocks post-News Corporation takeover; if anything, Associated Press sentiment becomes slightly more favorable (Table I.13 in the Supplementary Material).Footnote 30
Second, we test whether DJNW changes its coverage according to corporate political affiliation. In terms of Puglisi and Snyder’s (Reference Puglisi, Snyder, Anderson, Waldfogel and Strömberg2015) taxonomy, this test follows the “issue coverage” approach. In Panel B of Table 6, we examine whether DJNW has higher or lower coverage for Republican stocks following the News Corporation takeover, and whether any changes are driven by coverage of favorable or unfavorable news (defined as in Table 2, Panel B). We re-estimate equation (3), replacing the dependent variable with the number of DJNW news articles.Footnote
31 We perform the analysis for all the stock-days in our data (column 1), restricting the sample to the days in which at least one DJNW report is published about a given stock (column 2), and to unfavorable DJNW reports (column 3) or favorable DJNW reports (column 4). Under all the specifications, the coefficient on the
$ Republican\times Post $
 is small and statistically insignificant, consistent with no change in DJNW’s coverage in relation to a given stock’s political affiliation.
Third, we compare the language used by DJNW news reports and by the alternative news sources Reuters Newswires and Associated Press, for which we are able to retrieve the text of the news reports from Factiva. In terms of Puglisi and Snyder’s (Reference Puglisi, Snyder, Anderson, Waldfogel and Strömberg2015) taxonomy, this test follows the “comparison” approach. For each DJNW-alternative source pair of news reports about a given stock on a given day, we compute a cosine similarity index measuring the “distance” between the language used by the two reports; the higher the value of the index, the more similar the language used by DJNW is to the language used by the alternative news source.Footnote 32 We then estimate regressions similar to equation (3), where the dependent variable is the decile value of the cosine similarity between DJNW and alternative source-news reports on a given stock on a given day. The estimates are reported in Panel C of Table 6. They do not provide any evidence of a change in the similarity between the language used by DJNW and the alternative sources after the News Corporation takeover in relation to a stock’s political affiliation.
In sum, the nature of DJNW’s news reports and of its clientele suggests that a political slant after the News Corporation takeover is unlikely. Tests looking at the tone of DJNW news reports, their coverage, and the similarity between their language and the language used by alternative sources also provide no indication of such a slant.Footnote 33
C. Investor Sophistication and Political Affiliation
We assess the type of investors who become less responsive to DJNW news reports after the takeover. First, we examine whether less sophisticated investors are less likely to trade in the direction implied by DJNW sentiment. We proxy investor sophistication using past performance, measured as the investor’s Fama–French–Carhart 4-factor alpha over the prior 24 months, computed from Ancerno trades. We define an indicator,
$ Less\ Sophisticated\ Investor $
 , that is equal to 1 if the pre-News Corporation takeover alpha is below median, and 0 otherwise. For each investor-date, we calculate the share of trades that follow DJNW: net purchases of Republican stocks with favorable DJNW sentiment (
$ ESS>50 $
, that is equal to 1 if the pre-News Corporation takeover alpha is below median, and 0 otherwise. For each investor-date, we calculate the share of trades that follow DJNW: net purchases of Republican stocks with favorable DJNW sentiment (
$ ESS>50 $
 ) or a net sales of Democrat stocks with unfavorable DJNW sentiment (
$ ESS<50 $
) or a net sales of Democrat stocks with unfavorable DJNW sentiment (
$ ESS<50 $
 ), that is, the cases showing the strongest attenuation in Panel B of Table 2.Footnote
34 We also define an indicator equal to 1 if this share is below the median, and 0 otherwise. We then regress the percentage (or the indicator) on the
$ Less\ Sophisticated\ Investor $
), that is, the cases showing the strongest attenuation in Panel B of Table 2.Footnote
34 We also define an indicator equal to 1 if this share is below the median, and 0 otherwise. We then regress the percentage (or the indicator) on the
$ Less\ Sophisticated\ Investor $
 indicator interacted with the
$ Post $
indicator interacted with the
$ Post $
 indicator. As shown in Panel A of Table 7, lower-alpha investors are less likely to trade in the direction implied by DJNW sentiment after the News Corporation takeover, consistent with the attenuated reaction being driven by less sophisticated investors.Footnote
35
indicator. As shown in Panel A of Table 7, lower-alpha investors are less likely to trade in the direction implied by DJNW sentiment after the News Corporation takeover, consistent with the attenuated reaction being driven by less sophisticated investors.Footnote
35

TABLE 7 Long description
From left to right, columns 1 and 2 report Following D J N W percentage, columns 3 and 4 report High Following D J N W indicator. The first row shows Sophistication times Post coefficients: 0.008 and 0.009 for columns 1 and 2, 0.012 for columns 3 and 4. The second row lists t-statistics: 2.25, 2.37, 2.07, 2.13. The third row indicates firm controls: N for columns 1 and 3, Y for columns 2 and 4. The fourth row shows investor fixed effects: Y for all columns. The fifth row shows date fixed effects: Y for all columns. The sixth row presents R squared values: 0.034 for columns 1 and 2, 0.053 and 0.055 for columns 3 and 4. The seventh row lists number of observations: 134,071 for columns 1 and 3, 134,070 for columns 2 and 4.
Second, we examine whether Democrat investors are less likely to follow DJNW. Specifically, we replace the
$ Less\ Sophisticated\ Investor $
 indicator in Panel A of Table 7 with an indicator for whether the investor is a Democrat investor, based on their PAC and employee contributions obtained from the OpenSecrets database. We report the results in Panel B of Table 7, finding that Democrat investors are less likely to follow DJNW, consistent with the notion that they are more likely to perceive DJNW as biased.Footnote
36
indicator in Panel A of Table 7 with an indicator for whether the investor is a Democrat investor, based on their PAC and employee contributions obtained from the OpenSecrets database. We report the results in Panel B of Table 7, finding that Democrat investors are less likely to follow DJNW, consistent with the notion that they are more likely to perceive DJNW as biased.Footnote
36
D. Long-Run Stock Performance and DJNW Sentiment
We build a portfolio that tracks the DJNW reports for which stock price responsiveness is most attenuated—favorable reports on Republican stocks and unfavorable reports on Democrat stocks—and measure its performance. Following the overlapping portfolios approach of Jegadeesh and Titman (Reference Jegadeesh and Titman1993), each day we form a portfolio of all Republican stocks covered by DJNW news reports on that day, weighted by each stock’s sentiment decile (scaled from 0 to 1). We form a separate portfolio of Democrat stocks, weighted by 1 minus each stock’s sentiment decile. Both portfolios are held from day +2 relative to the news report date until day +6. New portfolios are formed daily, and across overlapping portfolios are averaged to produce time series of Republican and Democrat portfolio returns. From the return to going long the Republican portfolio and short the Democrat portfolio constitutes our “DJNW portfolio.”
According to Hypothesis 2, the DJNW portfolio should earn positive excess returns after the News Corporation takeover. This is indeed what we find. As shown in Figure 2, cumulative excess returns are flat until the May 2007 takeover announcement and turn positive thereafter, with the positive performance persisting until 2010, when the cumulative returns level off. We formalize this by regressing the portfolio’s daily returns on the Fama–French–Carhart four factors:

where
$ {R}_{pt} $
 is the portfolio’s return,
$ MKTRF $
is the portfolio’s return,
$ MKTRF $
 is the market’s excess return, and
$ SMB $
is the market’s excess return, and
$ SMB $
 ,
$ HML $
,
$ HML $
 , and
$ UMD $
, and
$ UMD $
 are the returns on the size, value, and momentum factor-mimicking portfolios, respectively. Standard errors use a Newey–West correction with 60 lags. The estimate of the intercept
$ \alpha $
are the returns on the size, value, and momentum factor-mimicking portfolios, respectively. Standard errors use a Newey–West correction with 60 lags. The estimate of the intercept
$ \alpha $
 measures the portfolio’s average daily risk-adjusted excess return.
Panel A of Table 8 reports the DJNW portfolio’s performance over the pre- and post-News Corporation takeover periods. Prior to the takeover, the DJNW portfolio earns a statistically insignificant excess return of 0.9 bps per day. After the takeover, the average excess return rises to 2 bps per day (about 5% annualized) and is statistically significant. Consistent with Figures 1 and 2, excess returns are positive through 2010 and negligible thereafter. This pattern supports Hypothesis 2: following the takeover, investors behave as if DJNW has a pro-Republican/anti-Democrat bias and underreact to its information, generating excess returns; over time, they update their beliefs, reducing and eventually eliminating the portfolio’s outperformance.Footnote 37

TABLE 8 Long description
Panel A. D J N W Portfolio.
This panel compares returns across different time horizons.
Column 1 (2003 to 2007, 60-Day Horizon): Alpha 0.009, Number of observations 1,246, R-squared 0.12.
Column 2 (2008 to 2012, 60-Day Horizon): Alpha 0.020, Number of observations 1,269, R-squared 0.05.
Column 3 (2008 to 2010, 60-Day Horizon): Alpha 0.038, Number of observations 767, R-squared 0.05.
Column 4 (2011 to 2012, 60-Day Horizon): Alpha minus 0.004, Number of observations 502, R-squared 0.15.
Column 5 (2008 to 2012, 20-Day Horizon): Alpha 0.041, Number of observations 767, R-squared 0.05.
Column 6 (2008 to 2012, 120-Day Horizon): Alpha 0.035, Number of observations 767, R-squared 0.04.
Column 7 (2008 to 2012, Calendar Time): Alpha 0.021, Number of observations 767, R-squared 0.11.
Panel B. Alternative News Sources.
Columns 1 to 3 show portfolios for Reuters Newswire, Associated Press, and Press Releases. Alphas are 0.004, minus 0.018, and minus 0.009 respectively.
Columns 4 to 7 show D J N W portfolios controlling for those sources. Alphas range from 0.018 to 0.028. Number of observations is 767 for all columns. R-squared values range from 0.44 to 0.62.
Panel C. Additional benchmarks.
This panel tests the D J N W portfolio against various benchmarks including R M W, C M A, Nonpolitical, R M D equal weighted, Illiquidity, and Industry.
Alpha values remain positive and statistically significant in most cases, ranging from 0.020 to 0.039.
Number of observations is 767 for all columns.
R-squared varies significantly by benchmark, from 0.06 for Nonpolitical to 0.69 for the All category.
This result is robust to extensive checks. First, columns 5–6 in Panel A, Table 8 show similar excess returns when we shorten the holding period to 20 trading days or extend it to 120 days, and column 7 shows comparable results using a calendar-time portfolio approach (Fama (Reference Fama1998)) rather than overlapping portfolios.Footnote 38 Second, the performance of the DJNW portfolio is not reproduced by analogous portfolios based on Associated Press, Reuters Newswire, or corporate press releases: columns 1–3 in Panel B show no abnormal performance for these alternative-source portfolios once we control for the DJNW portfolio, while columns 4–7 show that the DJNW portfolio’s excess returns remain intact when controlling for theirs. Third, Panel C demonstrates robustness to six additional benchmarks, which are included individually and jointly: the Fama and French (Reference Fama and French2016) profitability (RMW) and investment (CMA) factors, a portfolio tracking DJNW sentiment for politically unaffiliated stocks, an equal-weighted Republican-minus-Democrat portfolio, an Amihud (Reference Amihud2002) illiquidity-based portfolio, and a portfolio matched on the DJNW portfolio’s industry composition using Fama–French 12-industry returns.
In sum, DJNW news reports do not appear to become more favorable to Republican stocks (or less favorable to Democrat ones) after the News Corporation takeover; the reduced response to DJNW news reports is associated with less sophisticated investors; and the DJNW portfolio exhibits positive abnormal returns until the end of 2010, suggesting that the information from DJNW news reports is valuable, even though the market becomes less responsive to it. We ask next if these results imply a loss of firm-specific information in stock prices.
E. Impact on Liquidity and the Firm-Specific Information Content of Stock Prices
We examine measures of stock price liquidity and informativeness. First, we consider two (il)liquidity measures: the bid–ask spread (scaled by the closing price) and the daily price impact measure (lambda), based on Amihud (Reference Amihud2002). Higher levels of these variables indicate lower liquidity and reduced information content of stock prices.
Second, we consider two measures of price informativeness. The first one is the yearly return
$ {R}^2 $
 (Morck, Yeung, and Yu (Reference Morck, Yeung and Yu2000)), estimated from regressions of daily stock returns on market and industry returns for each stock-year in our sample. A higher value of the return
$ {R}^2 $
(Morck, Yeung, and Yu (Reference Morck, Yeung and Yu2000)), estimated from regressions of daily stock returns on market and industry returns for each stock-year in our sample. A higher value of the return
$ {R}^2 $
 indicates that stock prices move more with market- and industry-wide news, rather than firm-specific information. The second measure is the absolute difference between the return
$ {R}^2 $
indicates that stock prices move more with market- and industry-wide news, rather than firm-specific information. The second measure is the absolute difference between the return
$ {R}^2 $
 and the “news commonality”
$ {R}_N^2 $
and the “news commonality”
$ {R}_N^2 $
 proposed by Dang, Moshirian, and Zhang (Reference Dang, Moshirian and Zhang2015), defined as the
$ {R}^2 $
proposed by Dang, Moshirian, and Zhang (Reference Dang, Moshirian and Zhang2015), defined as the
$ {R}^2 $
 from a regression of individual-stock
$ ESS $
from a regression of individual-stock
$ ESS $
 score on market and industry
$ ESS $
score on market and industry
$ ESS $
 scores. The news commonality
$ {R}_N^2 $
scores. The news commonality
$ {R}_N^2 $
 captures the comovement in firm fundamentals as reflected in news coverage. Therefore, a larger deviation of the return
$ {R}^2 $
captures the comovement in firm fundamentals as reflected in news coverage. Therefore, a larger deviation of the return
$ {R}^2 $
 from the news commonality
$ {R}_N^2 $
from the news commonality
$ {R}_N^2 $
 suggests that price comovement is less driven by firm-specific information—here, DJNW coverage.
Table 9 reports the estimates of regressions with specification analogous to equation (2), using these liquidity and informativeness measures as dependent variables. Across all measures, the results indicate a deterioration of liquidity and price informativeness for Republican stocks with positive DJNW sentiment and Democrat stocks with negative DJNW sentiment after the News Corporation takeover of Dow Jones.

TABLE 9 Long description
The table has four main columns: Bid–Ask Spread, Price Impact, Return R-squared, and Absolute Return R-squared minus News Commonality R N-squared, each with subcolumns labeled 1 to 4. The first five rows show regression coefficients and t-statistics for DJ Sent times Post times Republican (coefficients: 0.414, 0.249, 0.158, 0.168; t-statistics: 3.50, 2.07, 2.19, 3.11), DJ Sent times Post (coefficients: minus 0.365, minus 0.152, minus 0.037, minus 0.023; t-statistics: minus 4.74, minus 1.97, minus 0.77, minus 0.53), DJ Sent times Republican (coefficients: minus 0.295, minus 0.133, minus 0.001, minus 0.035; t-statistics: minus 3.36, minus 1.58, minus 0.03, minus 0.73), Post times Republican (coefficients: minus 0.251, minus 0.279, minus 0.111, minus 0.121; t-statistics: minus 3.35, minus 3.59, minus 2.69, minus 3.96), and DJ Sent (coefficients: 0.384, 0.088, minus 0.015, minus 0.012; t-statistics: 6.44, 1.57, minus 0.40, minus 0.39). The next row is Republican (coefficients: 0.218, 0.098, 0.041, 0.062; t-statistics: 3.87, 1.69, 1.04, 1.67). Data frequency is daily for columns 1 and 2, yearly for columns 3 and 4. Firm controls and industry times date and firm fixed effects are present in all columns (Y). R-squared values are 0.665, 0.313, 0.770, and 0.688. Number of observations: 322875, 306149, 3221, and 3221 for columns 1 to 4 respectively.
Together with the portfolio return evidence in Table 9, these findings are consistent with the effects of a diminished trust in DJNW due to its political affiliation. They suggest that, even when alternative news sources are available, politically related losses of trust in a major news outlet can have a material impact on stock price informativeness.
VI. Conclusion
We study the stock market’s response to the political affiliation of news sources. We design our test around the acquisition of Dow Jones & Co. by News Corporation in 2007, which was viewed as introducing a right-wing affiliation into the traditionally unaffiliated Dow Jones outlets. Following the News Corporation acquisition, stock prices become less responsive to the sentiment content of news reports that appear on the Dow Jones Newswires (DJNW), Dow Jones’s leading business newswire, particularly for favorable DJNW news reports about Republican stocks and unfavorable reports about Democrat stocks. No comparable attenuation is observed in the stock price sensitivity to news reports in alternative sources, with similar characteristics as the DJNW (Reuters Newswire, Associated Press, and corporate press releases).
This evidence is consistent with a model where investors have a prior that, following the News Corporation acquisition, DJNW has a pro-Republican/anti-Democrat bias, and discount news reports that conform to the alleged bias. Several pieces of evidence suggest that, in so doing, investors fail to respond to potentially valuable information. Tests based on tone, coverage, and textual analysis of the language used by DJNW compared to alternative news sources do not detect evidence of biases in the DJNW news reports. A portfolio long Republican stocks with positive DJNW sentiment and short Democrat stocks with negative DJNW sentiment earns positive excess returns following the News Corporation acquisition.
Appendix. Variable Definitions
Political Affiliation Variables
- Republican:
-
Proxy for a given firm’s political affiliation. Defined as $ \frac{Rep_{it}}{Rep_{it}+{Dem}_{it}} $
 , the firm
$ i $
’s dollar contributions to the Republican party divided by the total contributions to Republican and Democrat parties in year
$ t $
. Data on firms’ political contributions are retrieved from the Federal Election Commission (FEC) detailed files (http://www.fec.gov/finance/-disclosure/ftpdet.shtml).
, the firm
$ i $
’s dollar contributions to the Republican party divided by the total contributions to Republican and Democrat parties in year
$ t $
. Data on firms’ political contributions are retrieved from the Federal Election Commission (FEC) detailed files (http://www.fec.gov/finance/-disclosure/ftpdet.shtml). - Lifetime political contributions:
-
Defined as $ \frac{\sum_{\tau =2003}^t{Rep}_{i\tau}}{\sum_{\tau =2003}^t{Rep}_{i\tau}+{\sum}_{\tau =2003}^t{Dem}_{i\tau}} $
, the firm
$ i $
’s cumulative dollar contributions to the Republican party up to a given year
$ t $
since the sample starts, divided by total cumulative contributions to Republican and Democrat parties. - Total political contributions:
-
Defined as $ \frac{\sum_{t=2003}^{2012}{Rep}_{it}}{\sum_{t=2003}^{2012}{Rep}_{it}+{\sum}_{t=2003}^{2012}{Dem}_{it}} $
, the firm
$ i $
’s total dollar contributions to the Republican party over the entire sample period, divided by total contributions to Republican and Democrat parties. - Employee contributions:
-
Defined as the firm’s employees’ dollar contributions to the Republican party, divided by the total contributions to Republican and Democrat parties. Data are shared and collected by Babenko et al. (Reference Babenko, Fedaseyeu and Zhang2020).
- CEO and employee contributions:
-
Defined as the firm’s CEO and employees’ dollar contributions to the Republican party, divided by the total contributions to Republican and Democrat parties. Data are shared and collected by Babenko et al. (Reference Babenko, Fedaseyeu and Zhang2020).
- Political sensitivity:
-
For each firm in each month, we estimate the coefficient $ {\theta}_i $
from the regression using a rolling window of past 180 months:$$ {R}_{it}-{r}_t={\alpha}_i+{\beta}_i\left({r}_{mkt,t}-{r}_t\right)+{\theta}_i{RepPresident}_t+{\varepsilon}_{it} $$
following Addoum and Kumar (Reference Addoum and Kumar2006). $ {R}_{it} $
is the monthly stock return,
$ {r}_t $
is the risk-free rate, and
$ {r}_{mkt,t} $
is the market return.
$ RepPresident $
is an indicator equal to 1 when the presidential party is Republican at the month
$ t $
, and 0 otherwise. We require the regressions to have at least 120 observations for estimation.


News Sentiment and Coverage Variables
-
$ DJ\_ Sent $
:
-
The decile rank of the average Event Sentiment Score ( $ ESS $
) provided by RavenPack for nonpress release articles in Dow Jones Newswire. -
$ PR\_ Sent $
:
-
The decile rank of the average Event Sentiment Score ( $ ESS $
) provided by RavenPack for press releases. -
$ DJ\_ Score $
:
-
The decile rank of the sentiment score for Dow Jones Newswire news pieces retrieved from Factiva. The sentiment score is computed as $ \left(P-N\right)/\left(P+N\right) $
, where
$ P $
and
$ N $
are the percentage of positive and negative words in Dow Jones newswires on firm
$ i $
on date
$ t $
. We adjust the frequency of a given positive or negative word using the term frequency–inverse document frequency (tf–idf) technique in the spirit of Loughran and McDonald (Reference Loughran and McDonald2011). Sentiment scores for Reuters Newswire and Associated Press are constructed similarly but using news articles from corresponding sources. The detailed construction is presented in Section D of the Supplementary Material. -
$ DJ\_ Coverage $
:
-
The number of DJNW news articles per firm at each news report date $ t $
. The variable is set to 0 for days when DJNW has no coverage while alternative sources (press release, Reuters, Associated Press) do. -
$ Textual\ Similarity $
:
-
The cosine similarity index between DJNW articles with the Reuters or the Associated Press. The higher the value of the index, the more similar the language used by DJNW is to the language used by the alternative news source. The detailed construction is presented in Section G of the Supplementary Material.


Firm Characteristics
-
$ Firmsize $
:
-
The natural logarithm of the market value of a given firm’s equity (defined as the product between the year-close stock price (Compustat item $ prcc\_f $
) and common shares outstanding (Compustat item
$ csho $
). - Book-to-market:
-
The ratio of the book value of equity over the market value of equity. Book value of a given firm’s equity is defined as: Stockholder’s equity (Compustat item $ seq $
) – Preferred Stock (Compustat item
$ pstkl $
) + Balance Sheet Deferred Taxes and Investment Tax Credit (Compustat item
$ txditc $
) – Post Retirement Asset (Compustat item
$ prba $
). -
$ Leverage $
:
-
The ratio of the firm’s debt (defined as the sum of the short-term debt (Compustat item $ dlc $
) and the long-term debt (Compustat item
$ dltt $
) over the book value of total assets (Compustat item
$ at $
). -
$ ROA $
:
-
The ratio of net income (Compustat item $ ni $
) over total assets (Compustat item
$ at $
). -
$ CAR\left(-11,-2\right) $
:
-
The 10-day cumulative abnormal return over the pre-news period. On a given day, the abnormal return is defined with respect to the Fama–French–Carhart 4-factor model, that is the difference between the stock’s return and the expected return estimated using the Fama–French–Carhart 4-factor model, using an estimation window over trading days (−200, −20) relative to the news date.
-
$ CAR\left(-1,+1\right) $
:
-
The 3-day cumulative abnormal return around the news release date. On a given day, the abnormal return is defined with respect to the Fama–French–Carhart 4-factor model, that is the difference between the stock’s return and the expected return estimated using the Fama–French–Carhart 4-factor model, using an estimation window over trading days (−200, −20) relative to the news date. Similarly, $ CAR\left(0,+1\right) $
is the 2-day cumulative abnormal return over the news release date and 1 day after the news release date.
$ CAR\left(0,0\right) $
is the abnormal return on the news release date.
$ CAR\left(-5,+5\right) $
is the 11-day cumulative abnormal return around the news release date.


Investor Trading, Analyst Recommendations, and Stock Price Information
- Following-DJNW (%):
-
The percentage of a given institutional investor’s trades that follow DJNW sentiment on a given date, over all trades that have a DJNW sentiment score. A trade follows DJNW sentiment if it is a (net) purchase on a Republican stock with the DJNW news sentiment $ ESS $
above 50, or if it is a (net) sale on a Democrat stock with the news sentiment
$ ESS $
below 50. -
$ Net\; buyer $
indicator:
-
A net buyer indicator, equal to 1 if the 3-day cumulative value of shares purchased by investors in the Ancerno database is larger than 3-day cumulative value of shares sold, and 0 otherwise.
-
$ Tradingimbalance $
:
-
Defined as the 3-day cumulative value of shares purchased by investors in the Ancerno database minus the 3-day cumulative value of shares sold, scaled by the sum of 3-day cumulative value of shares bought and sold. The 3-day cumulative value of shares bought (sold) is computed as the sum of the daily dollar amount of shares bought (sold) over 1 day before to 1 day after the news release date.
- Recommendation percentage change:
-
The percentage change of the average analyst recommendations relative to the previous month as $ \left({Rec}_t-{Rec}_{t-1}\right)/{Rec}_{t-1} $
. Recommendations have been coded on a scale from 1 to 5, such that 1 denotes a strong sell and 5 a strong buy (in contrast, IBES uses an inverted scale). - Recommendation Up% –Down%:
-
The difference between the percentage of “Up” recommendations and the percentage of “Down” recommendations, calculated as the difference between the number of “Up” recommendations and the number of “Down” recommendations, divided by the total number of recommendations.
- Standardized distance between DJNW sentiment and other sources:
-
For each firm-day on which alternative news sources (Reuters Newswire, Associated Press, corporate press releases) are available, we compute: i) the absolute difference between DJNW sentiment and the sentiment from each alternative source; and ii) the within-firm-day standard deviation of sentiment scores across all alternative sources. When only one alternative news source is available, the standard deviation is set to 0. Then, for each firm-day, we define the standardized divergence between DJNW sentiment and the sentiment from each of the alternative sources as the absolute sentiment differences divided by 1 plus the standard deviation. This measure increases when the distance between DJNW sentiment and alternative-source sentiment is larger and when there is stronger agreement among the alternative sources (i.e., a lower standard deviation). We classify a firm-day as a high-divergence case if any of the standardized absolute sentiment measures exceeds its median value, and 0 otherwise. For firm-days on which DJNW is the only available news source, we set the divergence indicator to 0.
- Return
$ {R}^2 $
:
-
For each stock each stock $ i $
and year
$ t $
, we estimate the R
2 from a regression of the daily stock return on the market and industry indexes, using days with available DJNW sentiment. - News commonality
$ {R}^2 $
:
-
For each stock $ i $
and year
$ t $
, news commonality
$ {R}_N^2 $
is computed as the R-squared from a regression of the daily
$ ESS $
of firm
$ i $
on the market’s
$ ESS $
and the industry’s
$ ESS $
in year
$ t $
.





Portfolios Used in Table 8
- Nonpolitical:
-
Return on a portfolio that tracks DJNW sentiment for nonpolitical stocks.
- RMD equal-weighted:
-
Return on an equal-weighted portfolio of long Republican and short Democrat stocks, regardless of the DJNW sentiment.
- Illiquidity:
-
Return on a portfolio based on the Amihud (Reference Amihud2002) illiquidity ratio.
- Industry:
-
Industry benchmark portfolio (average on all stocks in the same industry).
Supplementary Material
To view supplementary material for this article, please visit http://doi.org/10.1017/S002210902610297X.
Funding Statement
Luo gratefully acknowledges financial support from NWO Research Talent grant #406-13-060.


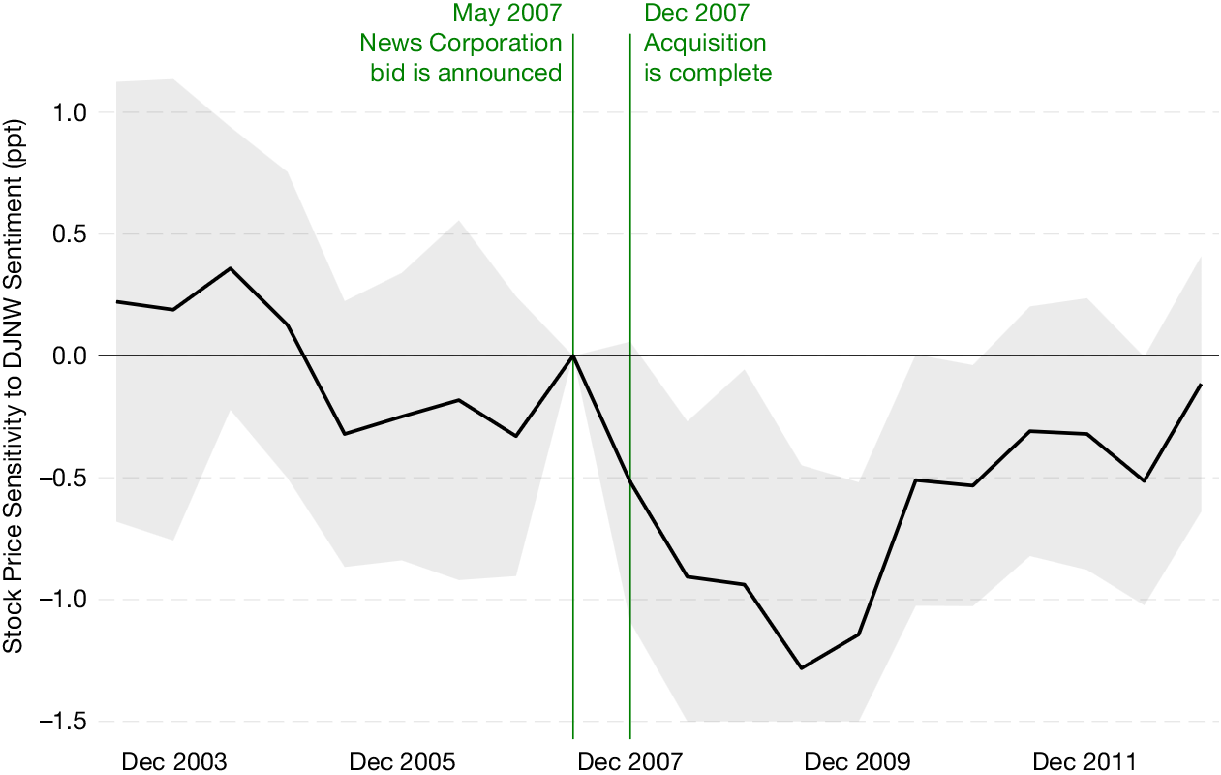


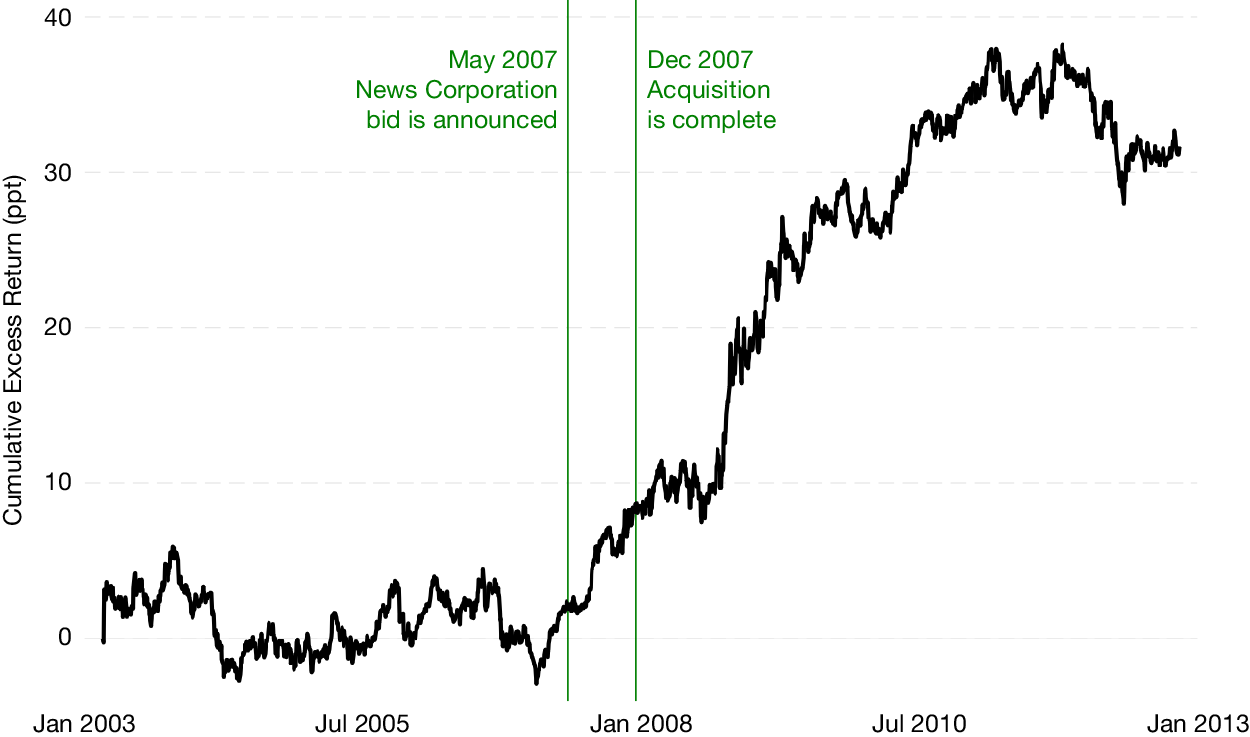
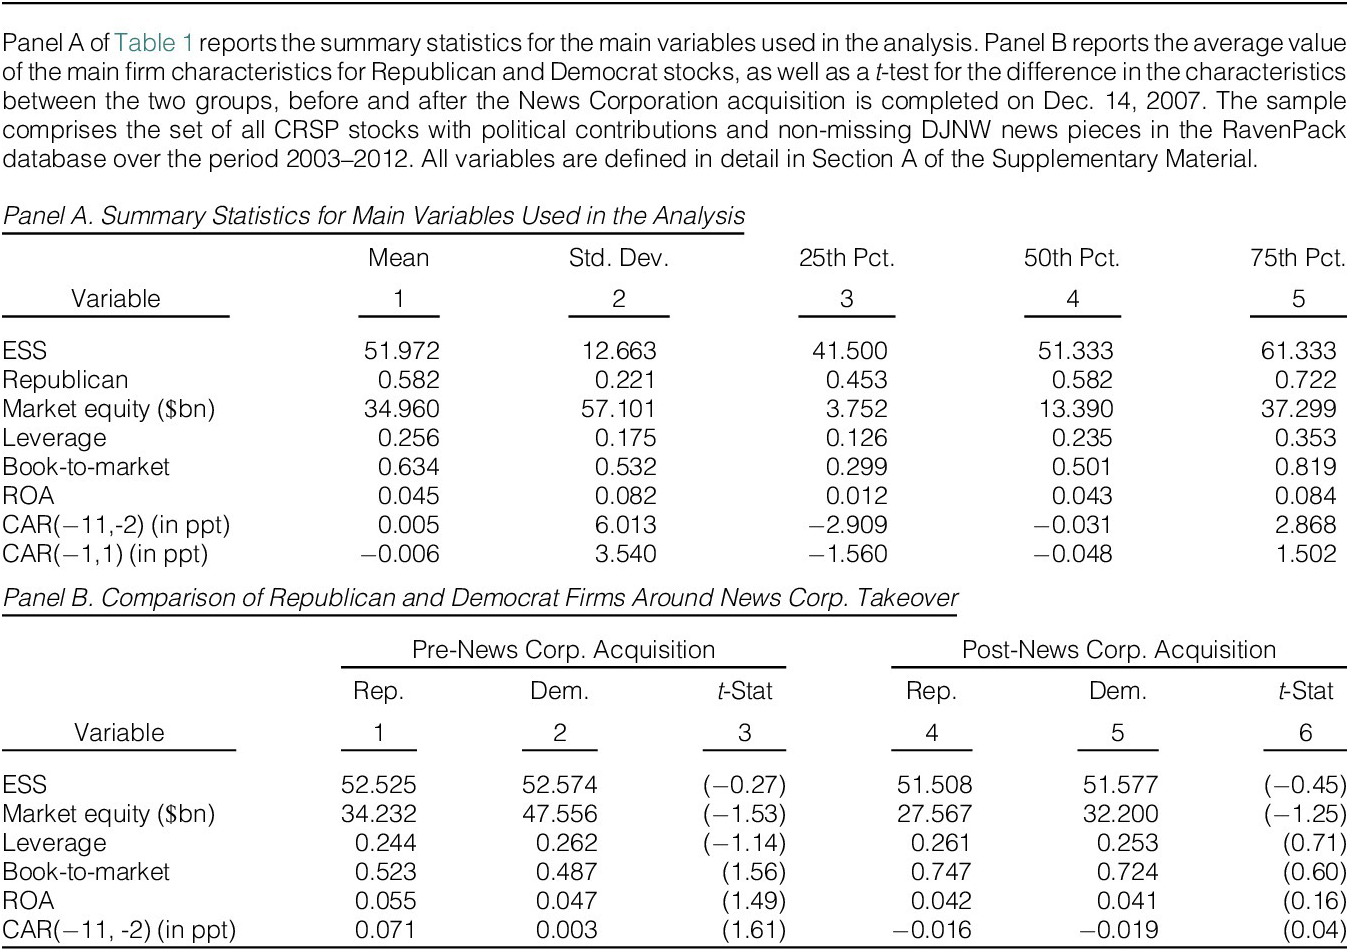
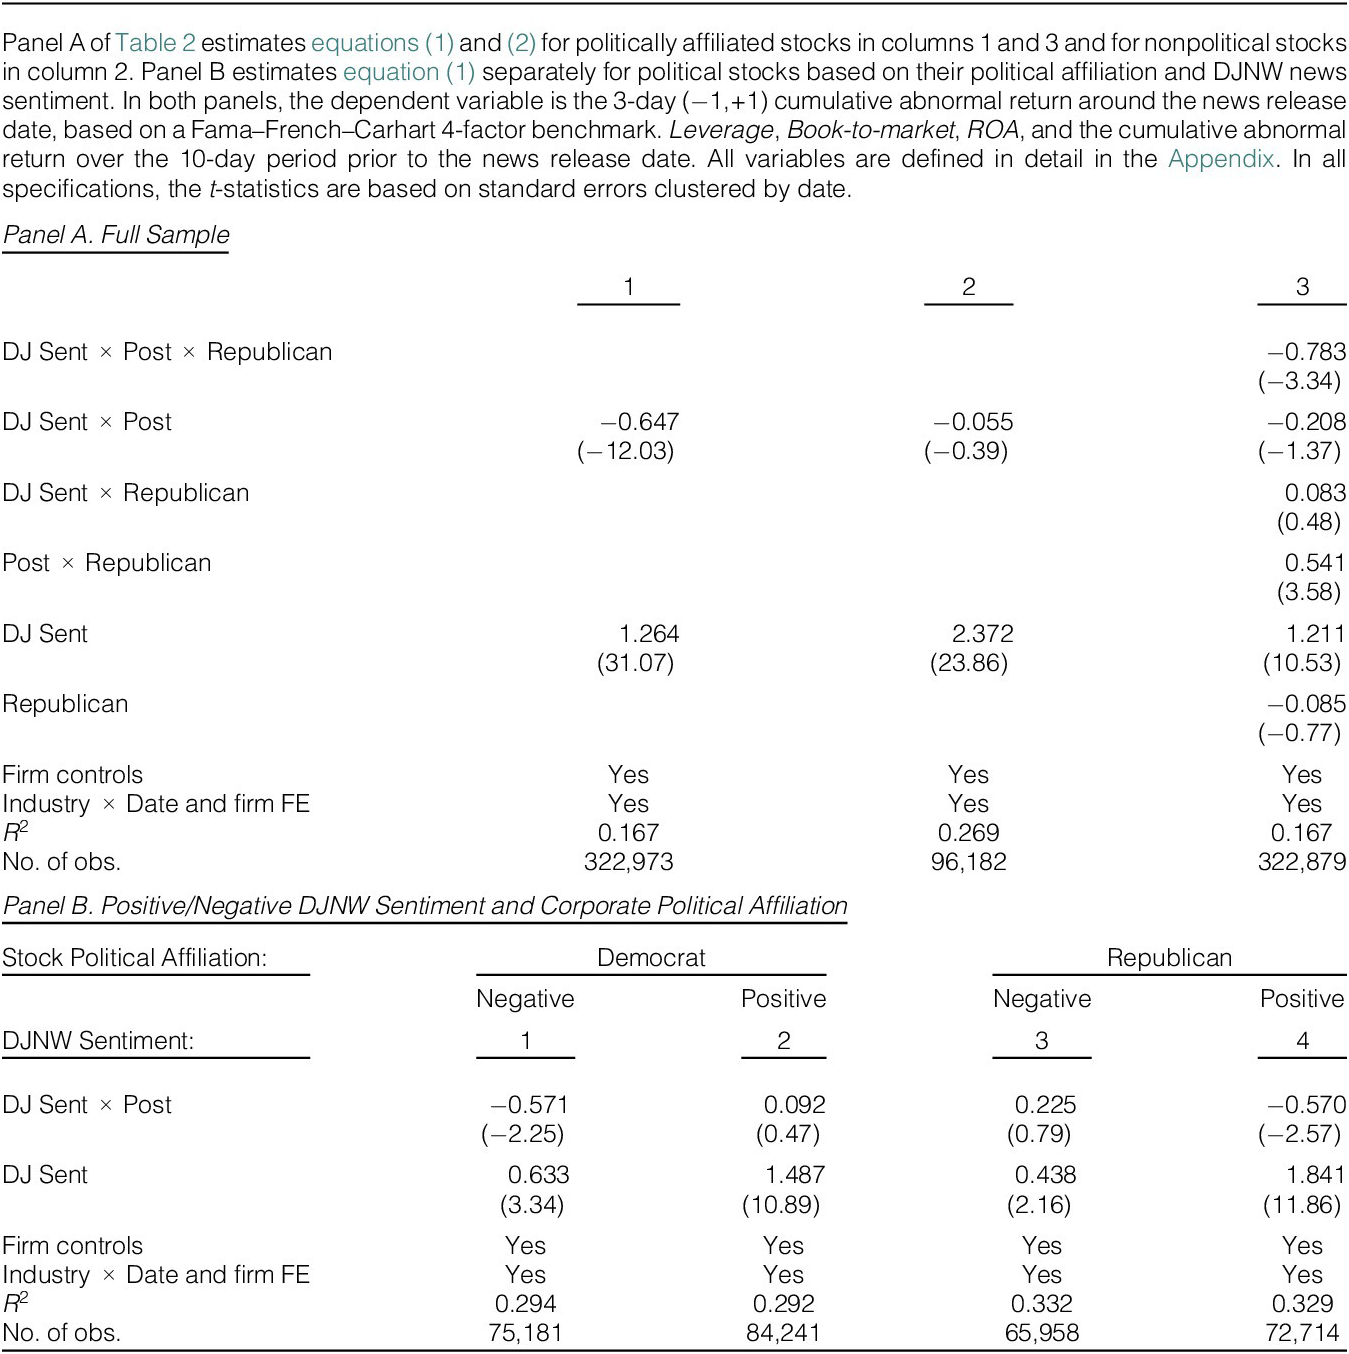
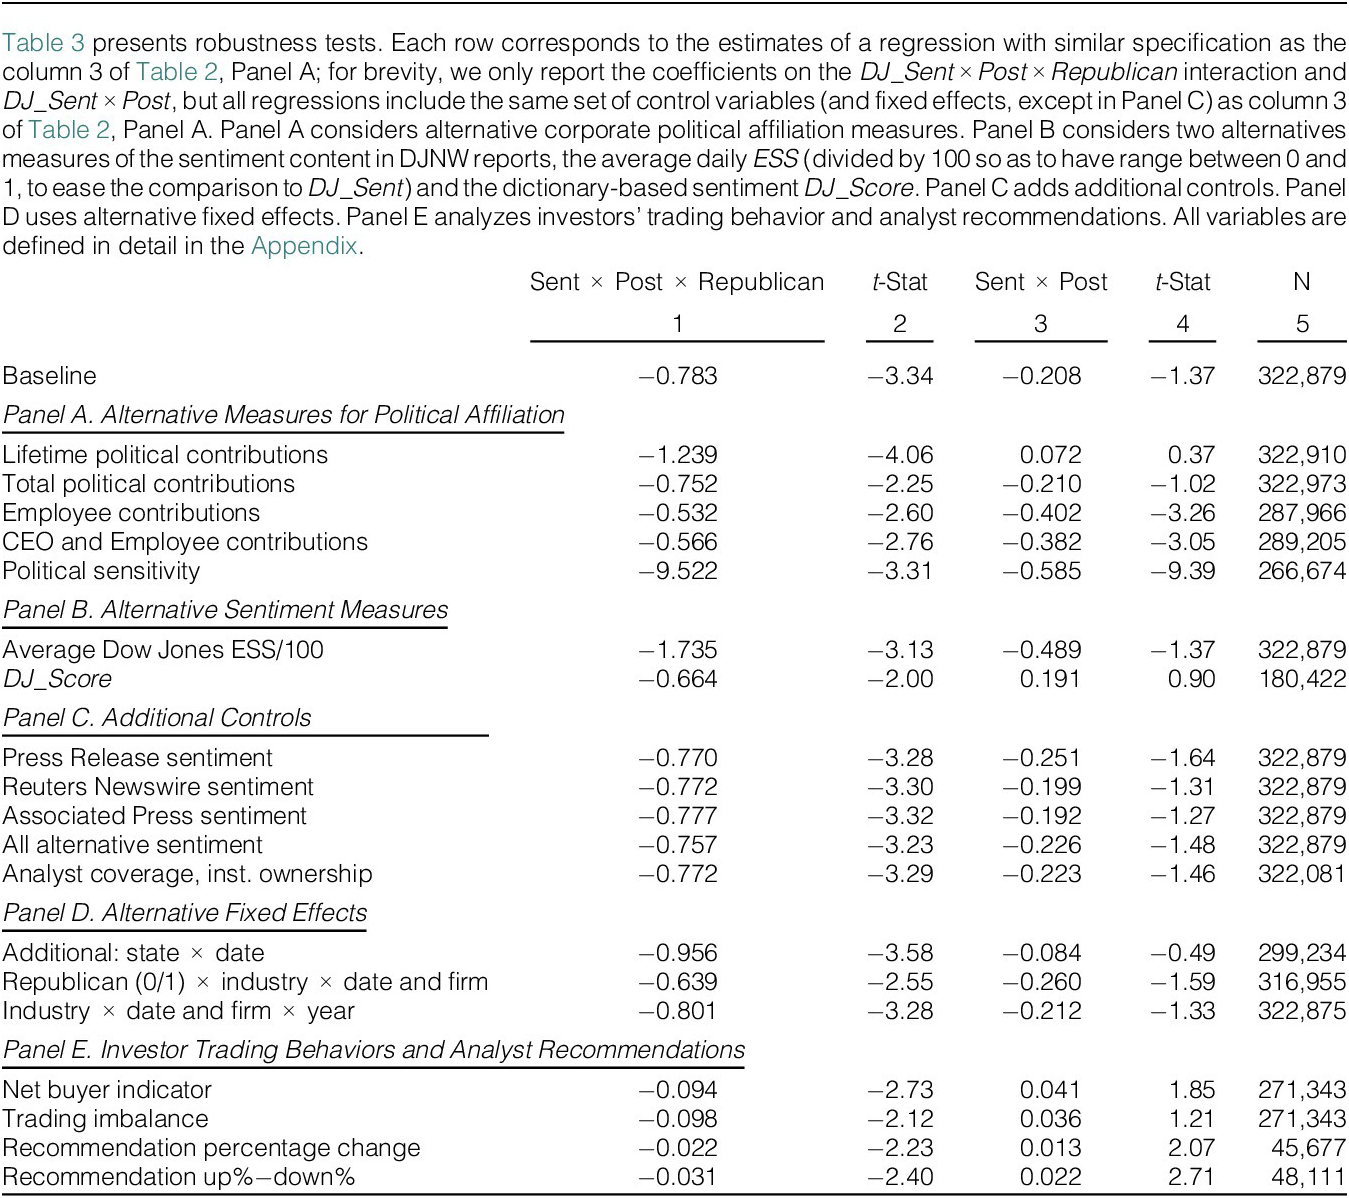
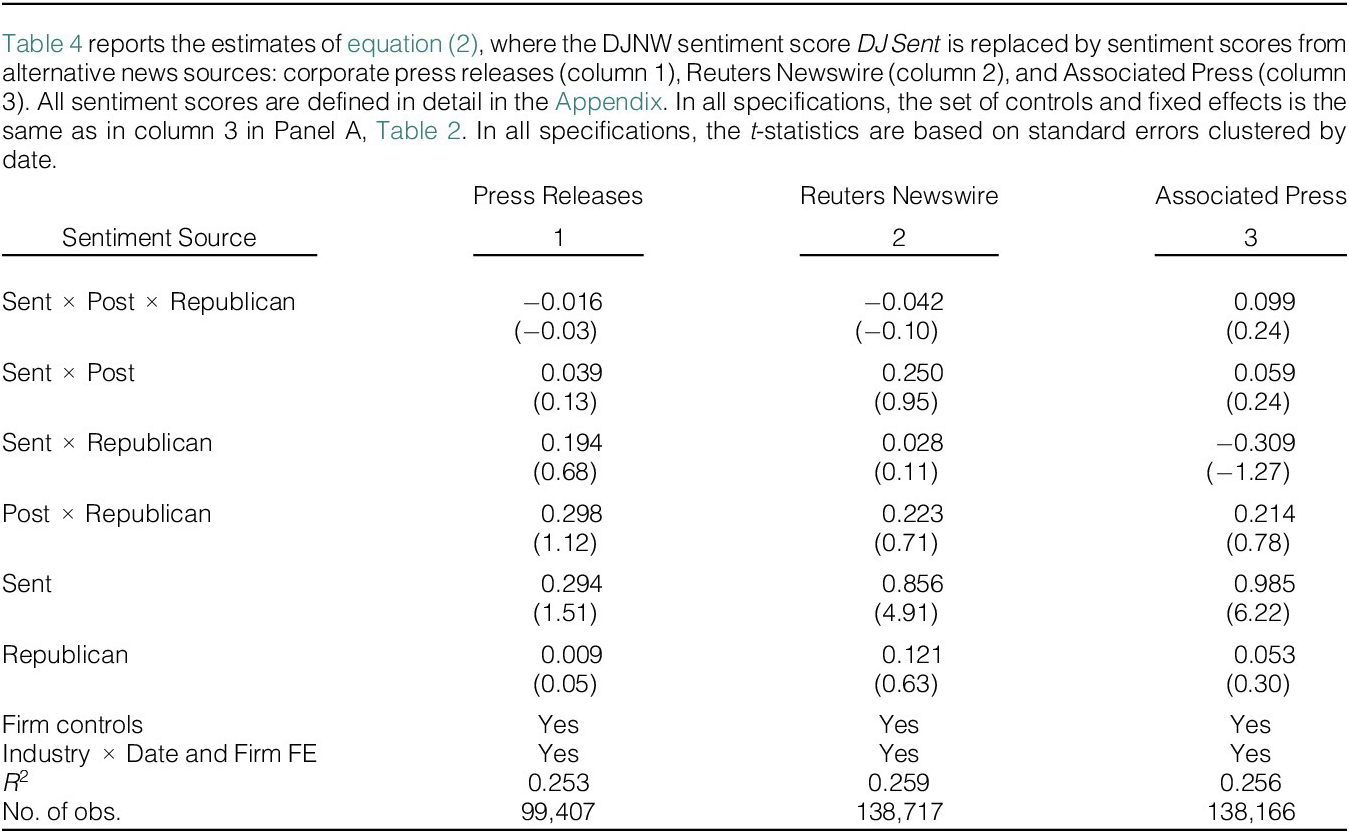
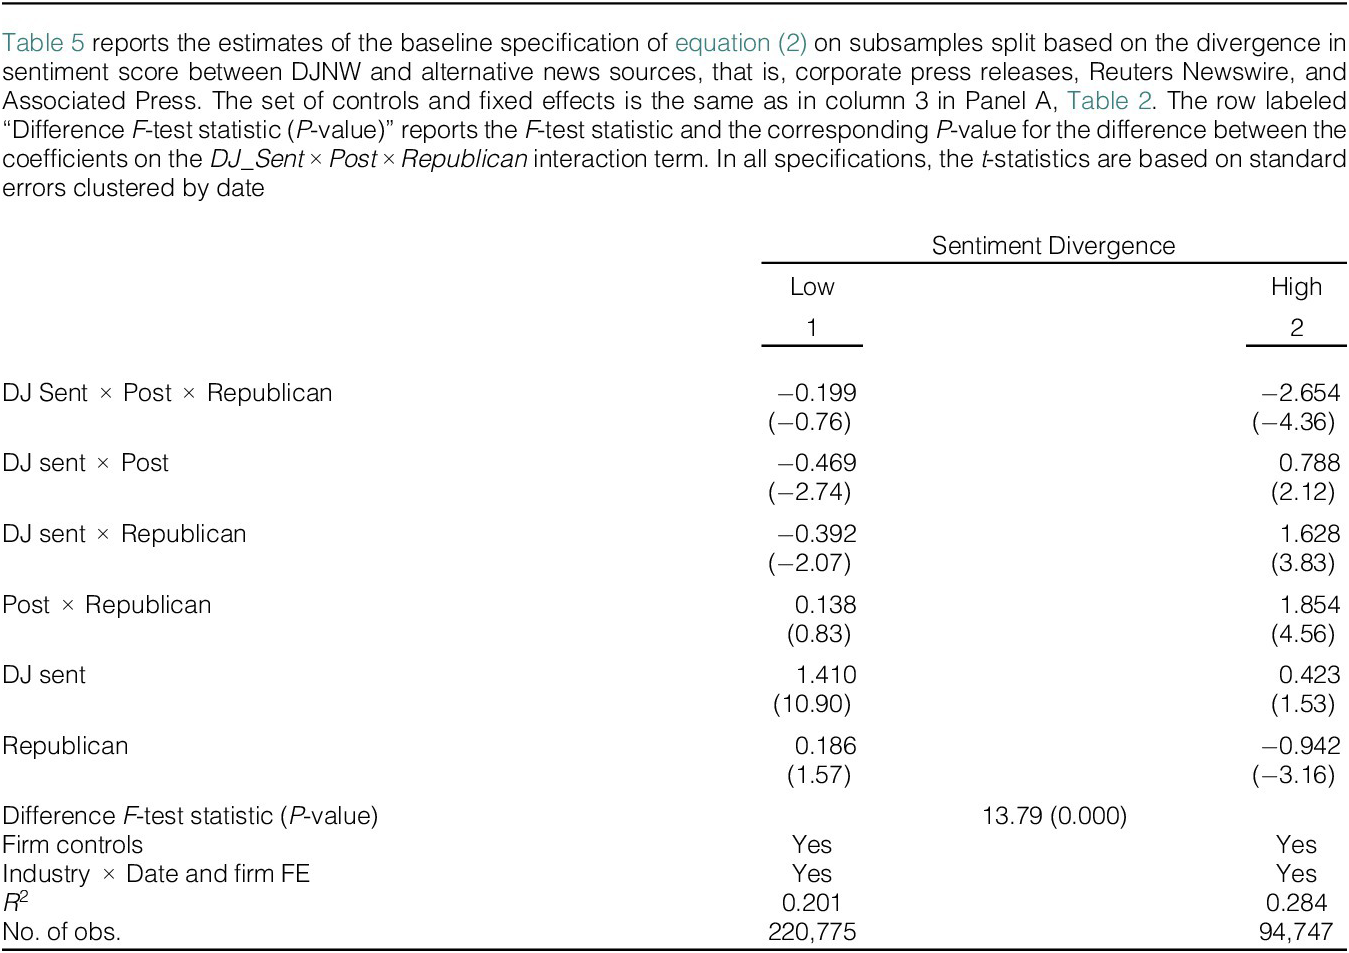
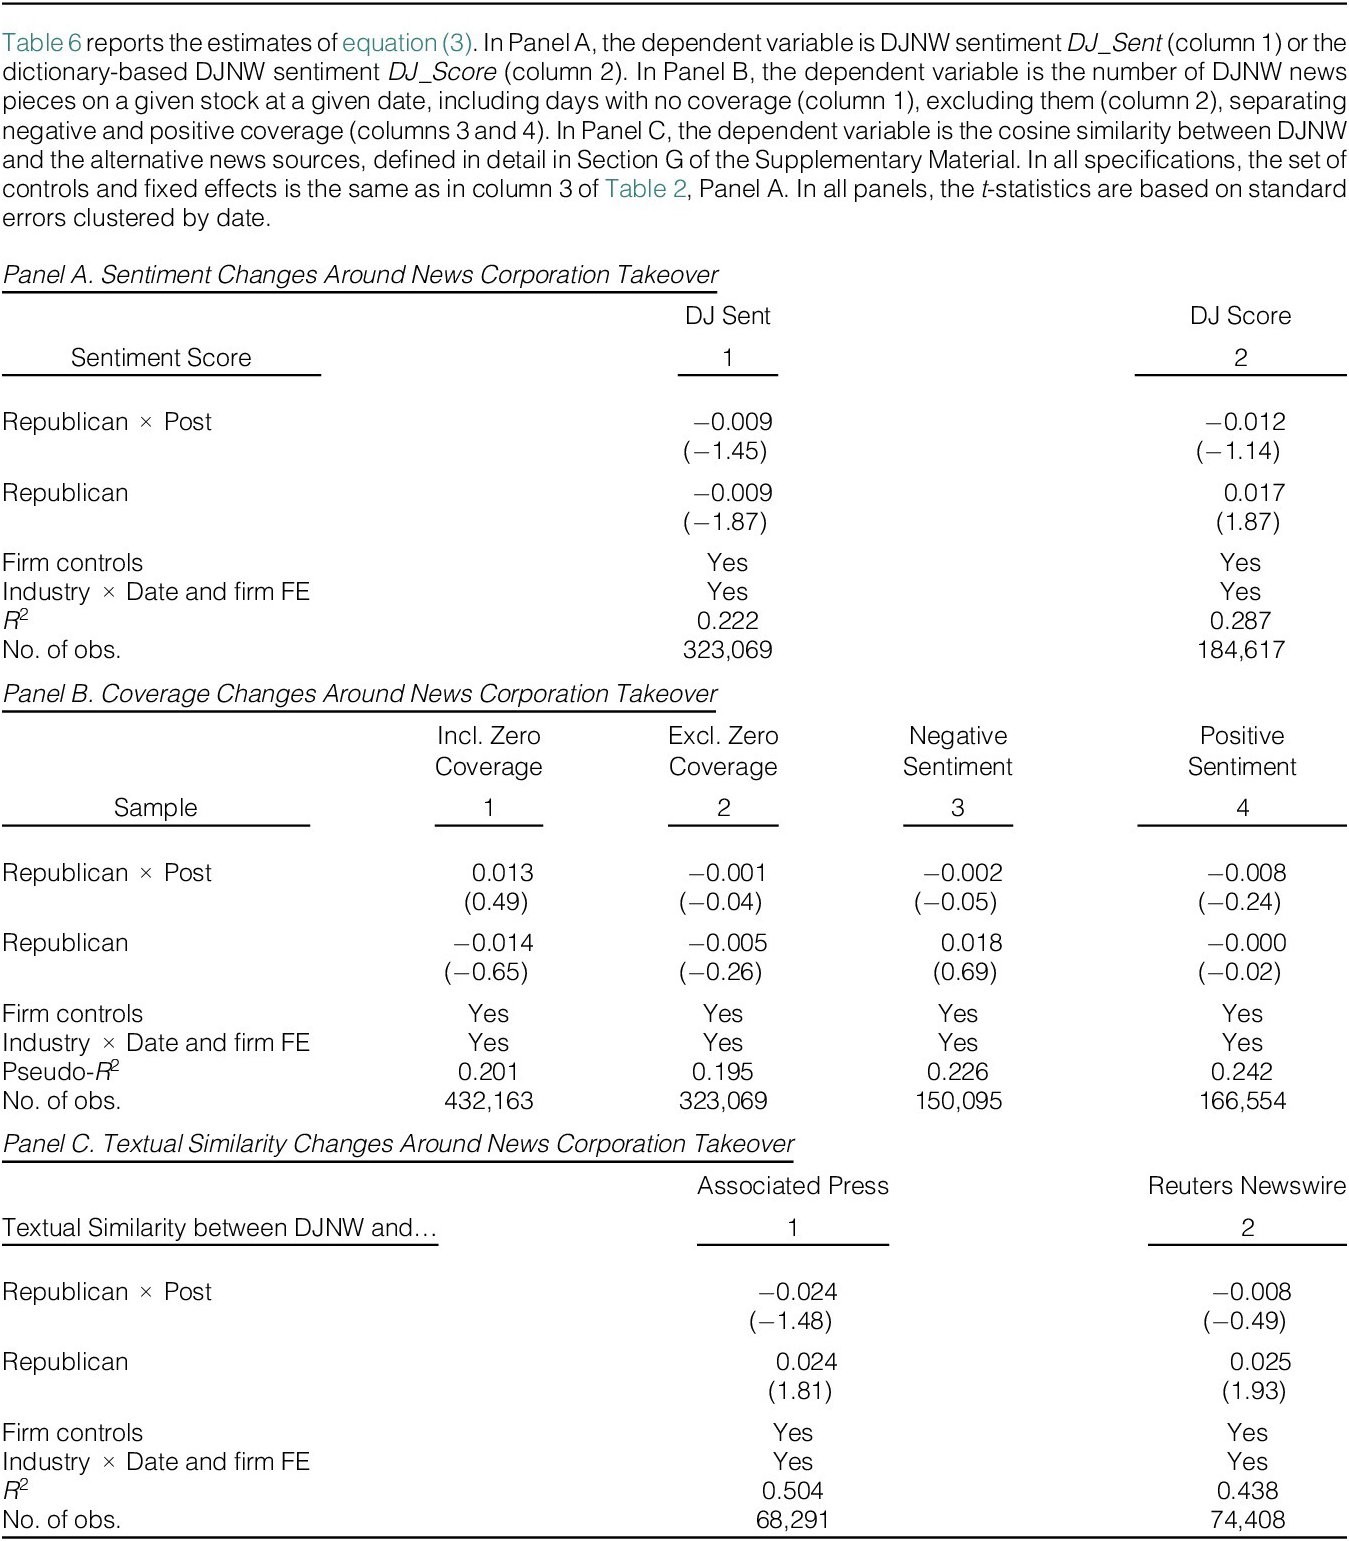
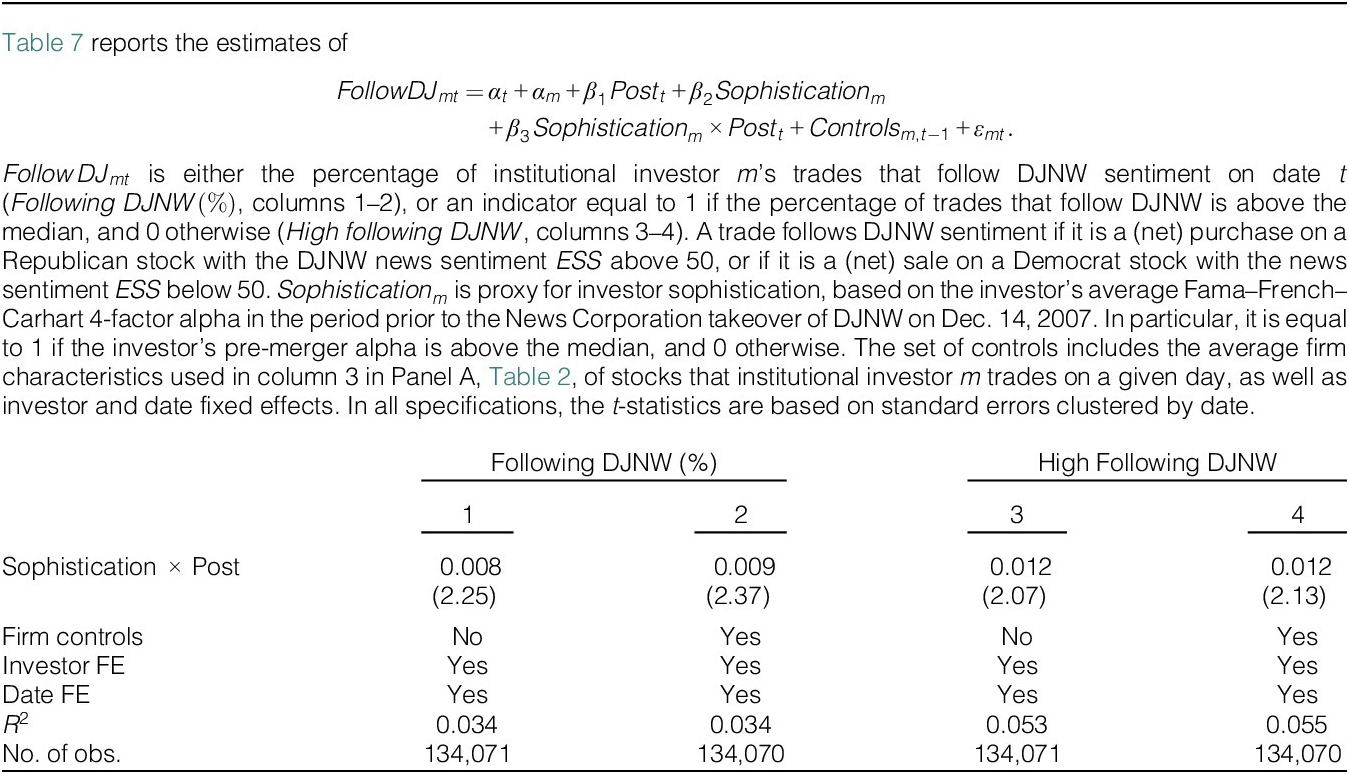
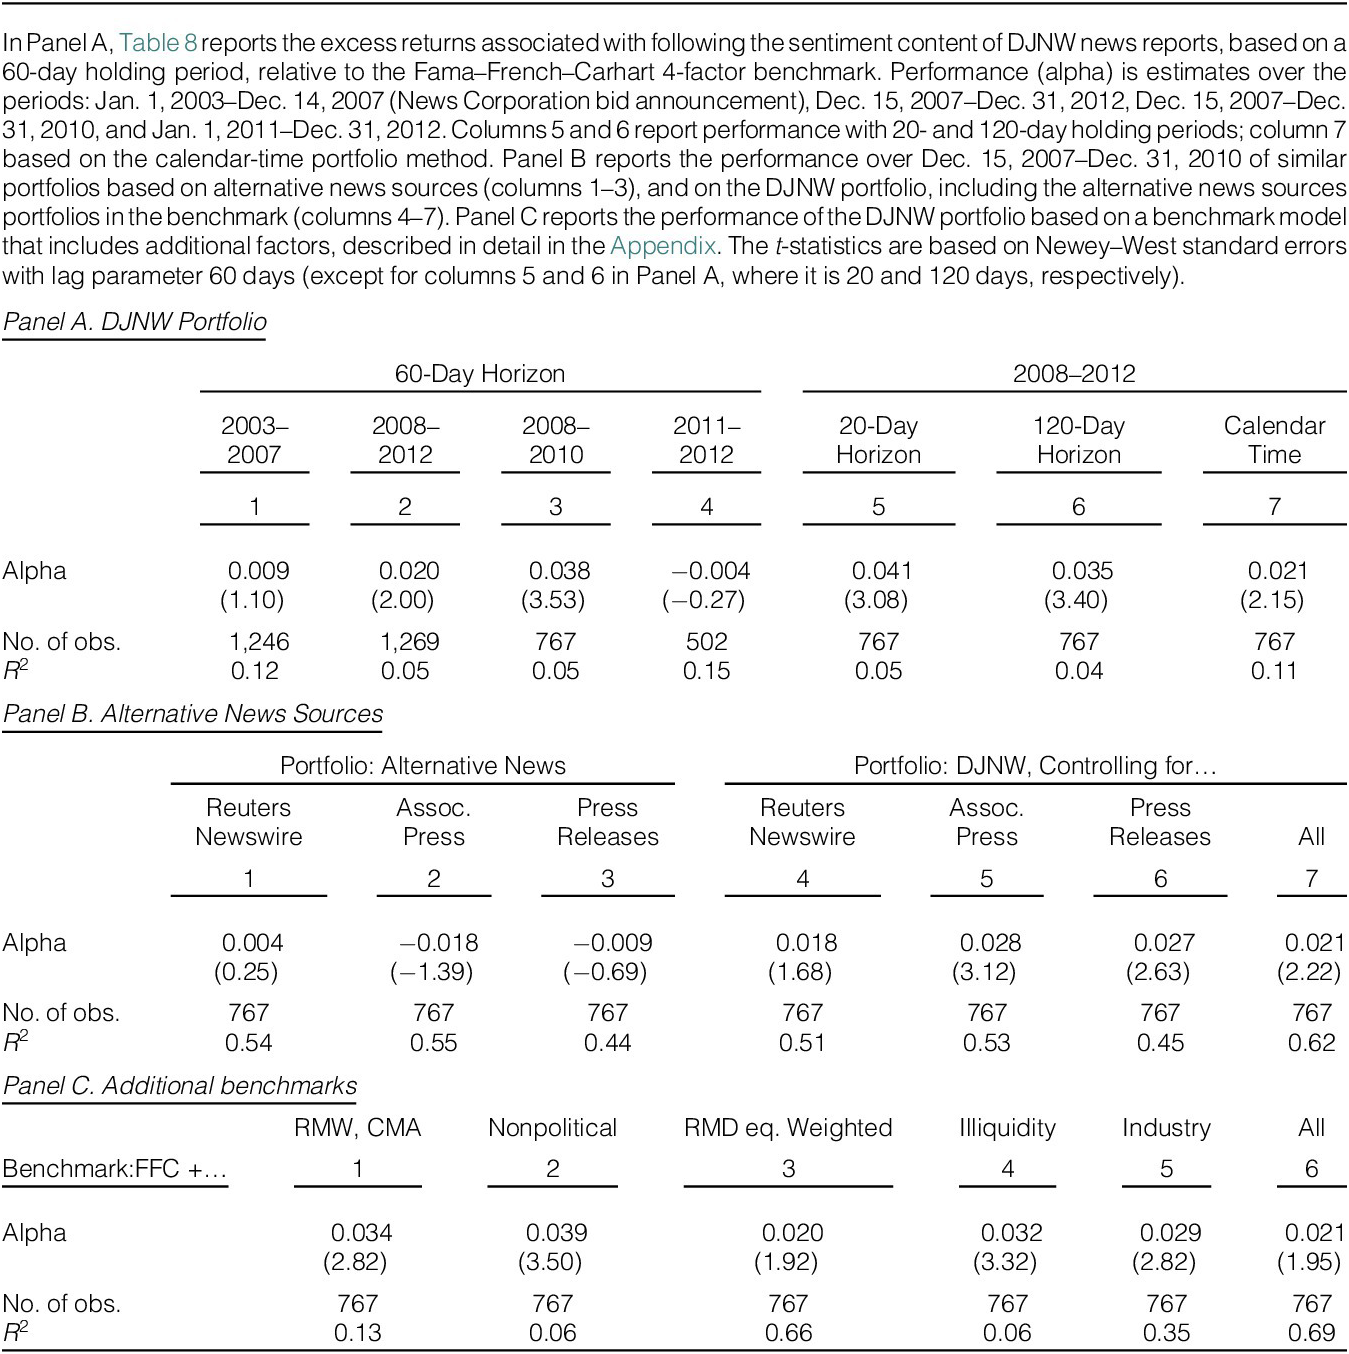
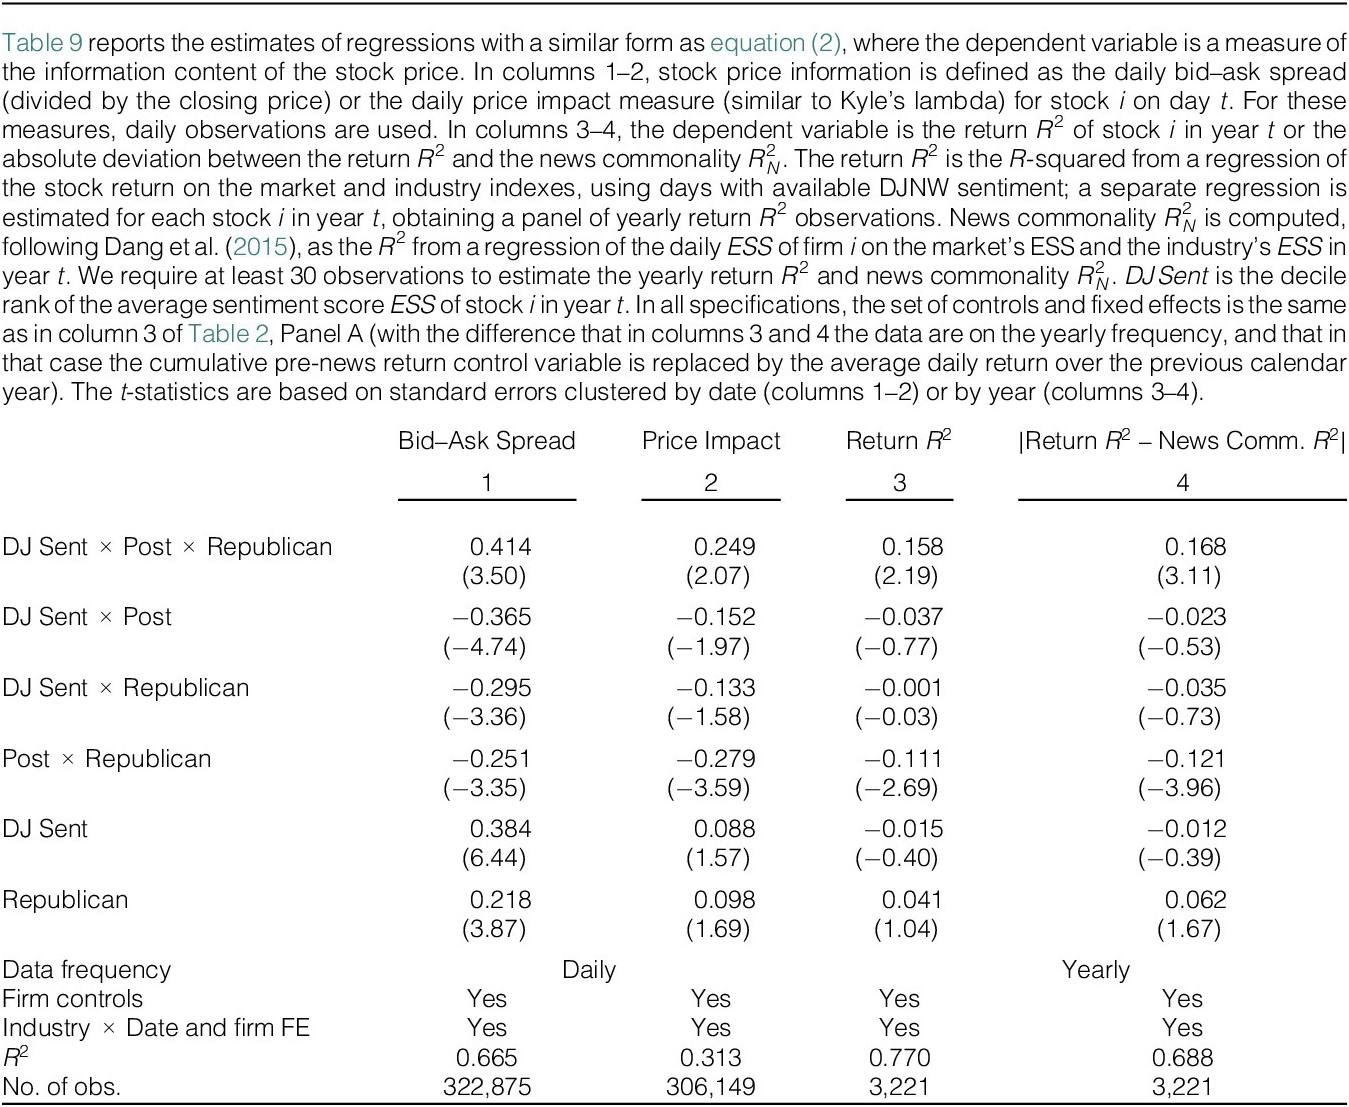


 Open access

