

INTRODUCTION
As the highest region of the East Antarctic ice sheet, Dome Argus (Dome A) is one of the most important candidate sites from which to acquire the oldest East Antarctic ice core (Ding and others, Reference Ding, Xiao, Yang and Wang2016). Information about surface topography, ice thickness, ice velocity, snow accumulation, and strain field is critical to the interpretation of ice core records (Wesche and others, Reference Wesche, Eisen, Oerter, Schulte and Steinhage2007; Xiao and others, Reference Xiao, Li, Allison and Hou2008; Yang and others, Reference Yang, Sun, Wang and Ding2014). Various scientific studies have been carried out at Dome A, since its summit was reached during the 21st Chinese National Antarctic Scientific Expedition (CHINARE) in 2005. The surface topography around the summit of Dome A was surveyed from real-time kinematic GPS in January 2005 (Zhang and others, Reference Zhang, E DC, Wang, Zhou and Shen2007). Differential GPS measurements were then carried out in January 2007 and 2013 (Cheng and others, Reference Cheng, Gong, Zhang, Sun and Wei2009; Yang and others, Reference Yang, Sun, Wang and Ding2014). In 2008, ice-sheet thickness and bed topography were measured by ground-based, ice-penetrating radar during the 24th CHINARE (Sun and others, Reference Sun, Martin, Simon, David and Shuji2009; Cui and others, Reference Cui, Sun, Tian and Tang2010). Steep bedrock valley walls beneath Dome A were reported, and freezing from the base has important effects on ice thickness and ice flow over Dome A (Bell and others, Reference Bell, Fausto, Creyts and David2011). Yang and others (Reference Yang, Sun, Wang and Ding2014) calculated the velocity and strain fields around Dome A using repeat GPS measurements at 12 poles occupied in 2008 and 2013.
In addition to surface topography and ice velocity, surface mass balance (SMB) and snow accumulation rate are key parameters for glaciological and meteorological studies (Ding and others, Reference Ding, Xiao, Yang and Wang2016). To estimate SMB, snow pits and stake arrays were measured on the northern peak of Dome A, and the results revealed an SMB value of 23 kg m−2 a−1 from 1966 to 2005 (Hou and others, Reference Hou, Li, Xiao and Ren2007). In January 2008, during the 24th CHINARE, 49 metal measuring poles were installed to measure the SMB across a 30 × 30 km2 area. Ding and others (Reference Ding, Xiao, Yang and Wang2016) used the data of a 49-stake network over this area from 2008 to 2013 and high-precision GPS measurements to calculate the annual mean SMB of Dome A. The result was 22.9 ± 5.9 kg m−2 a−1, which is in good agreement with the previous estimation based on β radioactivity (Hou and others, Reference Hou, Li, Xiao and Ren2007; Wang and others, Reference Wang, Sodemann, Hou and Masson-Delmotte2013).
During the 32nd CHINARE in January 2016, the positions of these 49 poles were surveyed by using static GPS measurements again. Compared with coordinates observed in 2008 and 2013, 47 repeat GPS observations of poles were conducted. This paper aims to present a more accurate and detailed velocity field using 2008, 2013, and 2016 GPS data, which is the longest observed in situ measurements over this region. Furthermore, we calculate and analyze the snow surface elevation change rate from 2013 to 2016, which may provide a reference for research about firn densification and basal melt, and field verification to the measurement provided by satellite altimetry.
GPS SURVEYING AND DATA PROCESSING
GPS data sources
In January 2008, 49 poles were set up to estimate SMB with 5 km × 5 km resolution, and to map the snow surface topography in a 30 km × 30 km area centered at the Kunlun station (as shown in Fig. 1). Given the lack of time, only 12 of the 49 poles were surveyed with static GPS measurements. A reference GPS station was established near the Kunlun station, and continuous measurements were performed from 13 to 26 January 2008 at 5 s intervals. Static GPS measurements were carried out at 12 poles for at least 20 min at 5 s intervals (Cheng and others, Reference Cheng, Gong, Zhang, Sun and Wei2009).
Sketch map showing the location of 49 poles in Dome A.

In January 2013, GPS measurements were made at 47 poles installed in 2008, using two Leica GS15 dual-frequency GPS receivers. Five reference GPS stations were set up and collected continuous data over 7–9 and 12–14 January 2013 at 1 s intervals. The other GPS receivers were used as roving receivers. The measurement at each pole lasted for at least 5 min, however, the P14 and P17 poles were not found. Thus, only 47 poles were measured. In addition to the five reference GPS stations, 30 of the 42 roving poles were measured for at least 10 min (Yang and others, Reference Yang, Sun, Wang and Ding2014). Yang selected two batches of data measured in 2008 and 2013 to calculate and analyze the ice-surface velocity and strain fields around Dome A.
In January 2016, static GPS differential observations were made at the 49 poles again, thereby resulting in 6 d spent in total from 6 to 11 January 2016 for the survey. Double-reference stations were set up, and continuous data were collected from each station in each day at 15 s intervals for at least 8 h (as shown in Fig. 1). Kunlun station was one of the two reference stations of each day, whereas P22, P24, P26, P27, P31, and P34 were the other reference stations from 6 to 11 January 2016, respectively. The remaining 42 poles were observed in more than 30 min at 15 s intervals. The vertical distance from the top of pole to snow surface at each site was also measured using a ruler. We measured at least three times around the pole and calculated the arithmetic mean as the final vertical distance. Among the 49 poles, P17 was missing. Therefore, a new GPS measuring pole was set up, and static observation was carried out at this site.
Data processing
Data processing is divided into two parts. In the first part, the GPS data from seven reference stations in Dome A were processed using GAMIT/GLOBK software. Several International GNSS (Global Navigation Satellite System) Service (IGS) stations around Antarctic, namely MAW1, CAS1, DAV1, DUM1, MCM4, OHI2, and SYOG were used as base stations for data processing. The following options were selected:
(1) Baseline solution type for relax, and simultaneously estimated the stations’ coordinates, parameters of satellite orbit, and the earth orientation.
(2) Single day solution adopted the ionosphere combination and auto repair cycle mode.
(3) IGS SP3 precise ephemerides were used.
(4) Epoch interval was set to 30 s and the altitude angle was set to 15°.
(5) Antenna-phase center variation corrections were applied.
(6) The tropospheric refraction model used the Saastamoinen model.
(7) Tidal correction utilized the FES2004 tidal model provided by GAMIT.
(8) GLOBK was used for net adjustment under the ITRF2008 reference framework, and global subnet h file was joined for adjustment (subnet IGS1–IGS9, a total of more than 1400 sites).
(9) Parts of GPS sites had a step because of earthquake or antenna changes, using the latest earthquake file itrf08_comb.eq of GAMIT 10.5 to correct coseismic displacement.
After the above data processing and item by item analysis, the precise geodetic coordinates of seven reference stations in Dome A were obtained.
The second part calculates the coordinates of 42 pole roving stations using Trimble Business Center (TBC) software. Version 2.50 of the software was used to obtain the baseline between a roving and a reference station. During data processing, IGS SP3 precise ephemerides were used, and an elevation cut-off angle of 15° was adopted. The fixed solutions were obtained for all baselines. After subtracting the previous vertical distance measured from the top of pole to snow surface, the final geodetic coordinates, snow surface elevations, and their std dev. (95% confidence interval) at 49 GPS sites in Dome A were calculated and are listed in Table 1. Furthermore, the ice-surface velocities and directions were calculated based on the site coordinates in 2008, 2013, and 2016. At the same time, the uncertainties of velocities and directions were estimated according to the law of error propagation and the std dev. of coordinates.
Estimated coordinates of 49 GPS sites in Dome A, where σ S, σ E, and σ Alt are std dev. (95% confidence interval) for Lat., Long., and surface elevation, respectively, while V and θ represent ice-surface velocities and directions, respectively. The vertical distances from the top of pole to snow surface are also listed

* Reference station.
Longer observation time generally means higher accuracy. Table 1 indicates that the highly accurate coordinates of seven reference stations are derived because of their longer continuous observation. As a rule, the vertical component from GPS has the worst accuracy among the 3-D components. The std dev. of these reference stations in the x and y directions are <0.6 cm, whereas the std dev. in the vertical direction are <2.5 cm. Among the remaining 42 roving stations, large differences occur in the 3-D precision. For example, the std dev. of P14, P32, P33, P40, and P46 are more than 10 cm in the horizontal direction and more than 27 cm in the vertical direction. The plane accuracies of the remaining sites are <6 cm and are basically higher than 10 cm in the vertical direction.
RESULTS AND ANALYSIS
Re-establishment of ice-surface velocity field around Dome A
The velocity time spans at the poles are from 2008 to 2016, which include P01, P03, P05, P07, P22, P24, P26, P28, P43, P45, P47, and P49, whereas the time spans of the remaining poles are from 2013 to 2016. Given that no observations were recorded at P14 and P17 in 2008 and 2013, the ice-surface velocities of 47 poles are calculated, as shown in Figure 2. The maximum velocity is at P01, which reached 28.7 ± 1.6 cm a−1, located in the northwest of Dome A. The minimum velocity is at P31, <1.0 cm a−1, located in the southwest of the Kunlun station. The mean ice-surface velocity of 47 poles is 10.4 ± 0.3 cm a−1. The surface velocities are perpendicular to the surface slope, and the smaller the gradient, the lower the velocity (Vittuari and others, Reference Vittuari, Vincent, Frezzotti and Mancini2004). The terrain around the Kunlun station is relatively gentle; therefore, the velocities are extremely small. When farther away from the Kunlun station, the ice-surface velocities are larger.
Surface topography and ice-surface velocity field over Dome A.
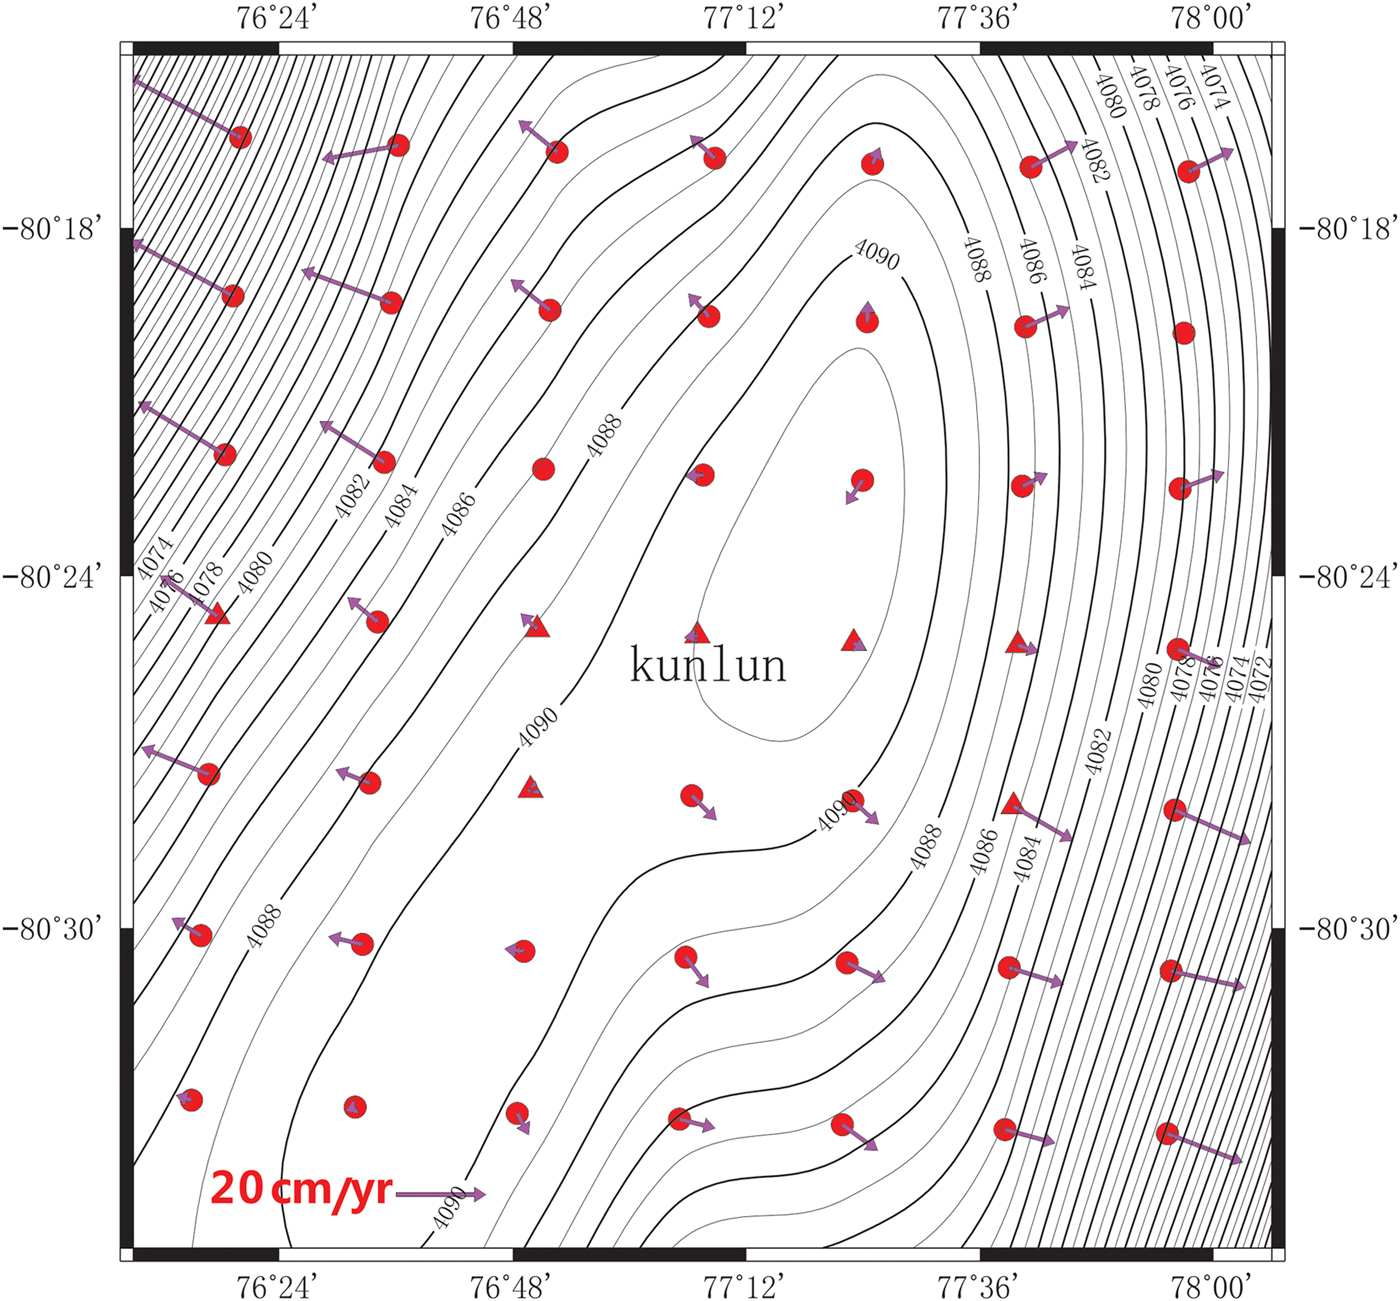
Snow surface elevation change
The surface topography in the study area was produced with the GPS geodetic height at the 49 poles in Table 1. Kriging was used to interpolate the 49 poles on a grid. Elevation contours around Dome A are plotted at 1 m interval, as shown in Figure 2. P19 is the highest point, and is located in the northeast of Kunlun station; its geodetic height is 4092.958 ± 0.056 m. Compared with the elevation observed by Yang (2014), the snow surface elevation difference at each pole can be obtained. However, because of the ice-surface velocity, the surface slope can also lead to an elevation change at each pole, which needs to be considered. According to the surface elevation at 49 sites in Dome A, we have interpolated and drawn the terrain slope map, which is shown in Figure 3.
Terrain slope in Dome A.

It can be seen that the terrain of Dome A is relatively flat, especially around the area of Kunlun station, and most slopes are <0.1°. Combining the slope information and the ice-surface velocity, the elevation change caused by terrain slope at each pole can be calculated and removed.
After removing the impact of slope factor, the surface elevation differences at 47 poles from 2013 to 2016 are obtained when compared with the elevation observed by Yang, and it is shown in Figure 4. Among these 47 differences, the maximum increase of snow surface elevation is P19, which is also the highest point in Dome A, and the increment is 84.8 cm. A few sites indicate a downward trend in the elevations, including P02, P09, P10, P12, P13, P30, P37, and P41. The magnitudes of P02, P09, P10, P12, and P30 show relatively minimal decreases, at a range of 2–7 cm, these small changes are indistinguishable from measurement error. In contrast, P13, P37, and P41 have a relatively large decline.
Elevation differences and error bars at 47 sites in Dome A.

Although a few sites’ elevations are in decline, most areas of Dome A presented a rising trend in elevation. According to the differences, the terrain change rate in Dome A was constructed, and it is shown in Figure 5. The average of change rates at these 47 sites in elevation is 6.6 ± 0.7 cm a−1 from 2013 to 2016.
Change rate of snow surface elevation in the Dome A area from 2013 to 2016, and red circles denote GPS roving sites and blue triangles denote GPS reference sites.

The SMB is measured at Dome A. The previous estimations of SMB that correspond to the different periods of Dome A are shown in Table 2.
Previous estimations of SMB for Dome A (Ding and others, Reference Ding, Xiao, Yang and Wang2016)

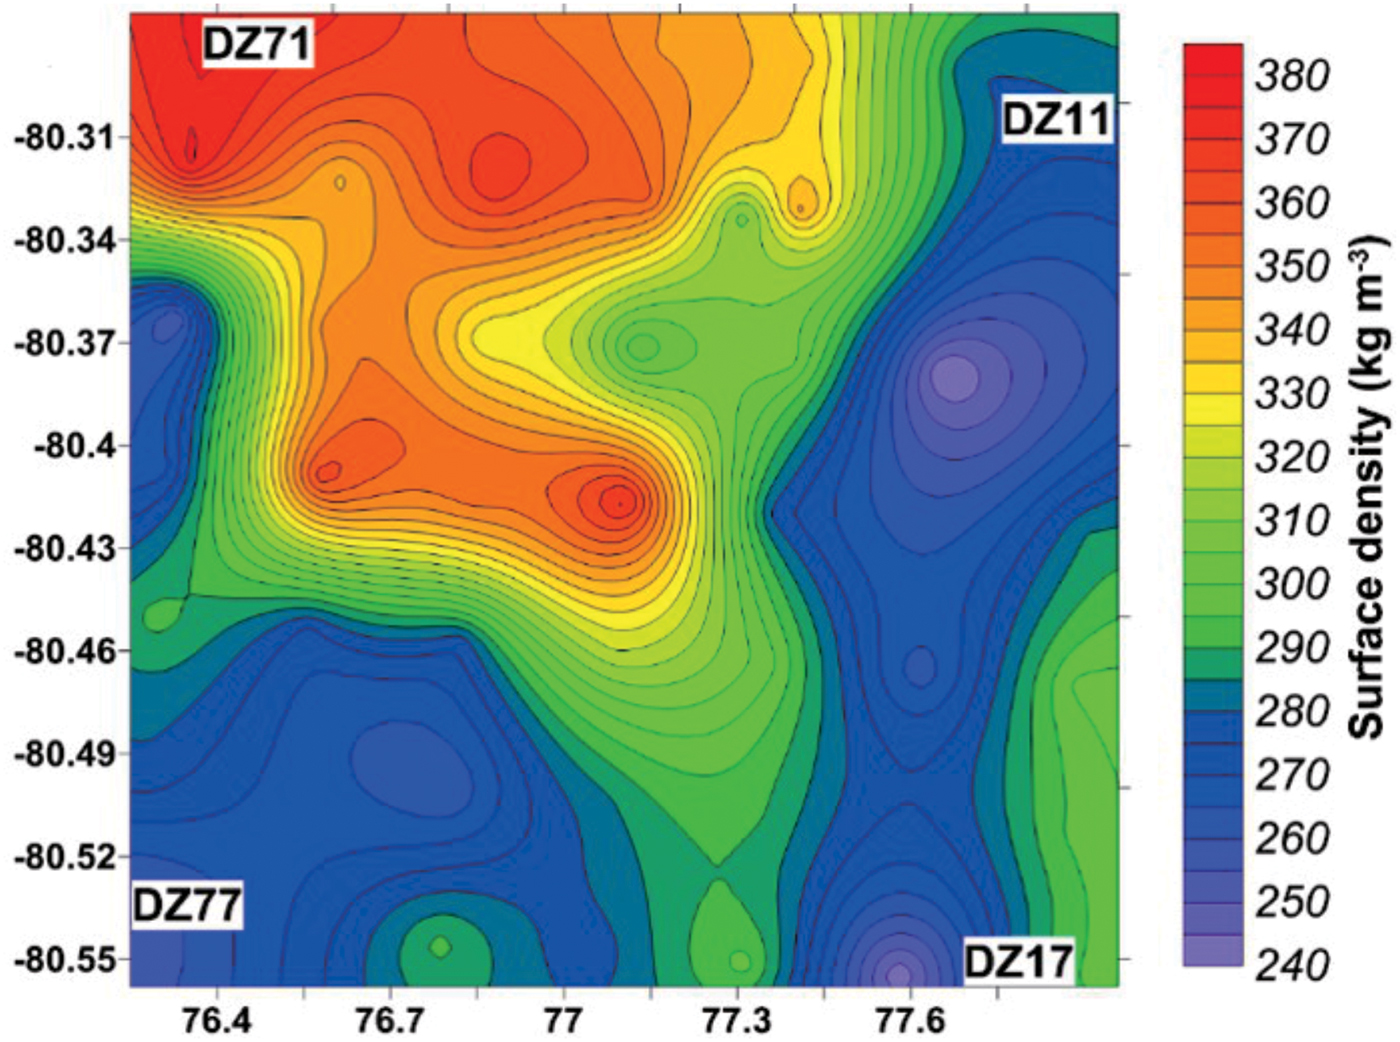
Snow density is necessary to translate SMB into the height change from the top of pole to snow surface. The surface snow density in Dome A is shown in Figure 6 (Ding and others, Reference Ding, Xiao, Yang and Wang2016). We calculated the mean surface density of Dome A, scilicet D mean = 302.765 kg m−3.
Map of surface snow density in Dome A (Ding and others, Reference Ding, Xiao, Yang and Wang2016).
The result of 31.7 kg m−2 a−1 calculated by AWS in Table 2 is considered overestimated for the 24th CHINARE finding, in which a snow dune formed just below the ultrasonic sounder in January 2008. By considering the time, we selected the SMB of 22.9 ± 5.9 kg m−2 a−1 from 2008 to 2013 (Ding and others, Reference Ding, Xiao, Yang and Wang2016) as the basis for calculating the height change from the top of pole to snow surface. Afterward, based on the mean surface density D mean, we calculated the height change rate as 7.6 ± 1.9 cm a−1, which is 1.0 cm a−1 difference compared with the snow surface elevation change rate derived from GPS.
The reasons for height change derived from SMB can be mainly attributed to be the snowfall. While, the reasons for the snow surface change calculated by GPS in the paper can be summarized as snowfall, possible basal melt, firn densification, post-glacial rebound, etc. However, given that Dome A is located in the stable East Antarctica and the highest point in Antarctic interior with perennial cold and dry environment, resulted in less snow melting and the magnitude of the post-glaciology rebound rates is very small, almost within 1 mm a−1 (Argus and others, Reference Argus, Peltier, Drummond and Moore2014). Therefore, the impact of post-glaciology rebound can be negligible. Interpretation of the data derived from Russian RES fieldwork between 1987 and 1990, across the Dome A and Dome F regions of East Antarctica, resulted in the identification of 18 new lakes (Siegert and others, Reference Siegert, Carter, Tabacco, Popov and Blankenship2005). Among these lakes, lake nos. 94 and 62 are next to Dome A, with the lengths of 5000 and 6700 m, respectively. It is possible to suspect that there is basal melt at the bottom of Dome A. Then, we compared these two results with show that the difference between them might be a combination of basal melt and firn densification. However, the data and information about the basal melt are very rare in Antarctic interior, especially in the area of Dome A. Therefore, we are still not sure how much the melt rate under Dome A. Similarly, there are very few firn densification models in Dome A, therefore, it is difficult to determine the snow surface change rate caused by densification. In other words, we still cannot distinguish them, and suspect that the 1 cm a−1 rate is the result of a combination of firn densification and basal melt for the present. In addition, given the high precision of GPS, the results of elevation change rate measured by GPS in this paper can be considered as the field test data to verify the results of satellite-altimetry measurements.
CONCLUSION
Centimeter-level accuracy geodetic coordinates and snow surface elevation in Dome A was obtained based on static GPS observations at 49 sites in January 2016. By comparing the coordinates derived from GPS in 2008, 2013, and 2016, we established the ice-surface velocity field, and calculated the snow surface elevation change rate in Dome A.
An accurate and detailed, ice-surface velocity field in Dome A was established; the field also indicated a long time span of 8 years. The maximum velocity is at P01, and reached 28.7 ± 1.6 cm a−1, and the minimum velocity is at P31, which was only 0.8 ± 0.3 cm a−1. The mean velocity over Dome A is 10.4 ± 0.3 cm a−1. This finding can extend our understanding of Dome A ice flow characteristics.
From 2013 to 2016, the snow surface elevation of most Dome A areas exhibits a rising trend. The maximum increase of terrain elevation is at P19, which is also the highest point in Dome A, and its value increases by 84.8 cm. The average snow surface elevation change rate derived from GPS around Dome A is 6.6 ± 0.7 cm a−1. There is a 1.0 cm a−1 difference between this result and change rate derived from SMB, and this difference is primarily suspected to be the combination of present-day firn densification and basal melt in Dome A.
ACKNOWLEDGEMENTS
We thank the Chinese Arctic and Antarctic Administration, and the State Oceanic Administration, for sponsoring the field survey and research work. This research is funded by the National Key Research and Development Program of China (2017YFA0603104), the National Natural Science Foundation of China (41531069 and 41506120), and Chinese Polar Environment Comprehensive Investigation and Assessment Programs (CHINARE2016-02-02).


 Open access