

The effects of dietary polyphenols on human health has primarily focused on outcomes associated with CVD( Reference Mubarak, Bondonno and Liu 1 ), type 2 diabetes( Reference van Dijk, Olthof and Meeuse 2 ) and neurodegenerative disorders( Reference Cropley, Croft and Silber 3 ), through the impact of derived metabolites on various cell populations after absorption. Coffee is a good source of polyphenols, in particular chlorogenic acids (CGA), with one cup delivering between 15 and 325 mg( Reference Richelle, Tavazzi and Offord 4 ), although coffee processing, in particular roasting, is known to dramatically reduce the levels of CGA in coffee( Reference Moon, Yoo and Shibamoto 5 ). However, CGA is poorly absorbed in the upper gastrointestinal tract, with studies conducted in ileostomy patients suggesting that only about one-third of ingested CGA is absorbed in the small intestine, with the remainder entering the large gut unmetabolised( Reference Olthof, Hollman and Katan 6 , Reference Stalmach, Steiling and Williamson 7 ). Further bacterial metabolism occurs here( Reference Farah, Monteiro and Donangelo 8 , Reference Monteiro, Farah and Perrone 9 ), with most undergoing cleavage of the ester link between quinic acid and caffeic acid. Released caffeic acid may be absorbed intact or, more probably, further metabolised to O-methylated, sulphated and glucuronidated derivatives( Reference Rechner, Spencer and Kuhnle 10 , Reference Stalmach, Mullen and Barron 11 ), as well as to dihydro metabolites such as dihydrocaffeic acid and dihydroferulic acid and their corresponding sulphates( Reference Stalmach, Mullen and Barron 11 ).
The colonic microbiota are thought to play a central role in human health, with links emerging with respect to disorders such as irritable bowel syndrome( Reference Kassinen, Krogius-Kurikka and Makivuokko 12 ), travellers' diarrhoea( Reference Hilton, Kolakowski and Singer 13 ), autism( Reference Finegold, Molitoris and Song 14 ) and obesity( Reference Zhang, DiBaise and Zuccolo 15 ).
As such, beneficial modulation of the gut bacteria may aid in the prevention of such diseases( Reference Wallace, Guarner and Madsen 16 ).
Prebiotics resist digestion/absorption in the upper gastrointestinal tract, and selectively stimulate the growth and/or activity of intestinal bacteria associated with health( Reference Gibson, Probert and Loo 17 ), leading to a healthier lower gut( Reference Van den Abbeele, Verstraete and El Aidy 18 ).
Notably, many prebiotics increase the levels of bifidobacteria( Reference Gibson, Beatty and Wang 19 , Reference Davis, Martinez and Walter 20 ) that are known to prevent colonisation of pathogens by competitive exclusion, to enhance epithelial barrier integrity, regulate the immune system and have an anti-inflammatory response (reviewed in Ng et al. ( Reference Ng, Hart and Kamm 21 )). However, other bacterial groups, such as Clostridium coccoides–Eubacterium rectale, may also act beneficially in the large intestine to prevent the development of obesity and other related diseases( Reference Neyrinck, Possemiers and Verstraete 22 ), and have been shown to increase post-consumption of polyphenols, namely isoflavones( Reference Clavel, Fallani and Lepage 23 ).
Previous data have highlighted the potential of polyphenol-containing foods/beverages, such as fruit, cocoa and wine, to modulate the microbiota in a beneficial way( Reference Tzounis, Vulevic and Kuhnle 24 – Reference Parkar, Stevenson and Skinner 27 ). As a high proportion of coffee CGA (55–67 %)( Reference Olthof, Hollman and Katan 6 , Reference Stalmach, Steiling and Williamson 7 ) reach the colon unmetabolised, there is a potential for them to exert prebiotic-like actions. In the present study, we exploit in vitro methods to investigate the colonic metabolism of coffee CGA and the subsequent effect of such metabolism on the growth of the human colonic microbiota.
Materials and methods
Chemicals and reagents
5-Caffeoylquinic acid (5-CQA), caffeine, zinc acetate, potassium ferrocyanide trihydrate, glacial acetic acid, sucrose, SDS, paraformaldehyde and lysosyme were obtained from Sigma-Aldrich. Ethanol, HPLC grade; methanol, acetonitrile and hydrochloric acid, liquid chromatography–MS (LC–MS) grade; formic acid, acetonitrile, methanol and water were obtained from Fisher Scientific. Peptone water, yeast extract, NaCl, dipotassium phosphate, monopotassium phosphate, sodium bicarbonate, magnesium sulphate heptahydrate, calcium chloride hexahydrate, Tween-80, haemin, phylloquinone (vitamin K1), l-cystine, bile salts, resazurin, PBS tablets were obtained from Oxoid Limited. ProLong® Gold antifade reagent was obtained from Invitrogen. Raftilose P95 FOS (a positive prebiotic control) was purchased from Orafti. Oligonucleotide probes (EUB338/II/III, CHIS150, LAB158, BAC303, EREC482 and BIF164) were commercially synthesised and labelled with Cy3 by MWG Biotech Limited. Aquasonic® 100 ultrasound gel was purchased from Parker Laboratories Inc. Deionised water was obtained using a Purite dispenser.
Coffee samples
Coffee was sourced commercially. Nescafé Green Blend, Nescafé Gold Blend and Nescafé Original were weighed in 1·2 g portions to represent an estimated equivalent of one cup of coffee, delivering 80·8, 33·9 and 33·8 mg CGA, respectively, as reported previously( Reference Mills, Oruna-Concha and Mottram 28 ). All coffee samples had a similar content of energy (4 kJ), protein (0·1 g), carbohydrate (0·1 g), fat (0 g) and fibre (0·1 g), although Nescafé Green Blend contained 0·05 g fibre per cup. All the three coffee samples contained similar levels of caffeine (53 (sem 0·4) mg).
Batch culture
Faecal samples were collected from three healthy individuals who had no known pre-existing gastrointestinal conditions, but all of whom were regular coffee consumers on experimental days and were processed immediately. Individuals who had ingested antibiotics or any other medicines known to affect the gastrointestinal tract, those who were regular consumers of pre- or probiotics, or who had taken part in a similar study at the University of Reading within the last 6 months were excluded from the study. Fibre or coffee intake was not restricted before donating faecal samples. Faecal samples were diluted at 1:10 (w/v) with anaerobic phosphate buffer (0·1 m; pH 7·4) and homogenised using a stomacher (Seward Stomacher® 80 Biomaster) for 2 min, and this faecal slurry was used to inoculate batch culture vessels. Batch culture vessels were prepared to mimic physico-chemical conditions in the distal region of the human colon. These culture vessels with a volume of 300 ml were sterilised and 135 ml of sterile basal nutrient medium (peptone water (2 g/l), yeast extract (2 g/l), NaCl (0·1 g/l), dipotassium phosphate (0·04 g/l), monopotassium phosphate (0·04 g/l), sodium bicarbonate (2 g/l), magnesium sulphate heptahydrate (0·01 g/l), calcium chloride hexahydrate (0·01 g/l), Tween-80 (2 ml/l), haemin (50 mg/l), phylloquinone (vitamin K1, 10 ml/l), l-cysteine (0·5 g/l), bile salts (0·5 g/l), resazurin (1 mg/l) and distilled water) were added to each vessel. The medium was set up with a flow of O2-free N2 gas (15 ml/min) for a minimum of 12 h in order to achieve an anaerobic environment. Before inoculation with the faecal material and coffee, the basal medium was maintained at 37°C and the pH was adjusted to pH 6·8 and was maintained between pH 6·7 and 6·9 using an Electrolab pH controller with feeds of 0·5 m-HCl and 0·5 m-NaOH, as appropriate. The coffee samples were added and the pH was allowed to adjust to the acceptable range. Finally, 15 ml of the faecal slurry were added to each of the vessels and allowed to run under the conditions as described for 24 h. During this period, 3 ml samples were taken from each of the vessels at 0, 4, 10 and 24 h for fluorescent in situ hybridisation analysis to assess quantitative changes in the gut microbiota, and for LC–MS and HPLC analysis to assess the metabolism of coffee polyphenols.
Bacterial enumeration
Samples taken from the batch culture vessels were added to cold 4 % (v/v) paraformaldehyde and stored for 4 h at 4°C to fix the bacteria. Following this, fixed samples were centrifuged at 1500 g for 15 min and washed twice with PBS (0·1 m; pH 7). Afterwards, the remaining pellets were resuspended in a PBS (99 %)–ethanol mixture (1:1, v/v) and stored at − 20°C for at least 1 h before fluorescent in situ hybridisation analysis. For hybridisation, samples were vortexed for 5 s and diluted, as appropriate, in a PBS–SDS solution (10 %, 1:1, v/v). The samples were vortexed and 20 μl were added to a well on a six-well plate (Tekadon, Inc.). Plates were dried using a desktop plate incubator (Grant Boekel ISO20) for 15 min at 48°C. Samples prepared for LAB158 were further treated to make bacterial cells more permeable to the probe. A 20 μl lysosyme solution (1 mg/ml sterile water) was applied to these wells, which were further incubated at 37°C for 15 min. Slides were exposed to 50, 80 and 96 % (v/v) ethanol for 3 min each and dried using a desktop incubator. Oligonucleotide probes (50 ng/μl), labelled with the fluorescent dye Cy3, were used to identify specific bacteria; they work by differentiating bacteria by targeting specific 16S rRNA sequences. The probes used for enumerating specific bacteria were as follows: BIF164 (for Bifidobacterium spp.)( Reference Langendijk, Schut and Jansen 29 ); BAC303 (for Bacteroides spp.)( Reference Manz, Amann and Ludwig 30 ); LAB158 (for Lactobacillus/Enterococcus spp.)( Reference Hermie, Harmsen, Frits and Gjalt W 31 ); EREC482 (for the C. coccoides–E. rectale group)( Reference Franks, Harmsen and Raangs 32 ); CHIS150 (for the C. histolyticum group); EUB338/II/III (for total bacteria)( Reference Daims, Brühl and Amann 33 ). A 50 μl probe solution (5 μl of probe in 50 μl of hybridisation buffer (5 m-NaCl, 1 m-Tris–HCl, deionised water, 10 % (w/v) SDS and formamide prepared according to the probe)) was added to each well. The wells were stored in an airtight container at the appropriate temperature (46 or 50°C) for 4 h. The slides were then washed with warm buffer (5 m-NaCl, 1 m-Tris–HCl (pH 8) and 0·5 m-EDTA (pH 8)) for 15 min and then immediately plunged into cold water. The slides were dried using compressed air before 5 μl of antifade and a cover slip was applied. All slides were stored for at least 8 h in the dark at 4°C before microscopic examination. For each well, bacterial counts were obtained in fifteen different fields of view using a Nikon Eclipse E400 microscope.
Liquid chromatography–MSn
The coffee samples and the inoculated batch culture media were analysed by LC–MS n using electrospray ionisation to identify principal CGA and key CGA metabolites (in the media). LC–MS analyses were performed using an Agilent 1200 Series LC system (Agilent) equipped with a binary pump, a degasser, an auto-sampler, a thermostat, a column heater, a photodiode array detector and an Agilent 1100 Series LC/MSD mass trap spectrometer. Separation of samples was achieved using a Zorbax SB C18 column (2·1 × 100 mm, 1·8 μm; Agilent), and LC conditions were as follows: injection volume, 10 μl; column temperature, 25°C; binary mobile system, (A) 0·1 % (w/v) of aqueous formic acid and (B) 0·1 % (w/v) of formic acid in acetonitrile; flow rate, 0·2 ml/min. A series of linear gradients was used for separation (min/%B): 0/0, 5/4, 40/25, 55/50 and 60/50. MS was performed in the negative-ion mode (scan range, m/z 100–800 Da; source temperature, 350°C). All solvents used were of LC–MS grade. The eluent was monitored by a photodiode array detector at 254, 280, 320, 370 and 520 nm, and spectra of products were obtained over the 220–600 nm range. All data were analysed using Bruker Daltonics Data Analysis 3.3.
HPLC
The coffee samples and the inoculated batch culture media were analysed by HPLC to quantify CGA, using an Agilent 1100 Series LC fitted with a C18 Nova Pak® column (250 × 4·6 mm inner diameter and 5 μm particle size) and a C18 Nova Pak® guard column (Waters Limited). The mobile phases consisted of 5 m-HCl (0·1 %) in 95 % water (phase A) and 5 % methanol, and 5 m-HCl (0·1 %) in 50 % acetonitrile and 50 % water (phase B) pumped through the column at 0·7 ml/min. An aliquot (50 μl) of the sample was injected and separated using a gradient system (min/%B): 0/5, 5/5, 40/50, 55/100, 59·9/100 and 60/5. The eluent was monitored by a photodiode array detector at 254, 280, 320, 370 and 520 nm, and spectra of the products were obtained over the 220–600 nm range. Quantification of CGA was obtained at 320 nm. A standard curve was produced using 5-CQA (00·1–0·6 mm), and a linear relationship was obtained with a correlation coefficient of >0·98. Quantity was expressed as 5-CQA and presented as an equivalent quantity as that found in the human colon after ingestion of one cup of coffee (assuming that two-thirds of CGA reach the colon). All data were analysed using Agilent Chem Station software.
Statistical analysis
A paired Student's t test was used to test for significant differences (P< 0·05) in bacterial enumeration between the 0 and 10 h time points, using XLSTAT statistical analysis add-in for Microsoft Excel 2010.
Results
Metabolism of chlorogenic acids by human faecal bacteria
In agreement with previous investigations( Reference Mills, Oruna-Concha and Mottram 28 ), eight CGA were identified in the faecal batch culture vessels inoculated with coffee (Fig. 1). At 0 h, these were as follows: 5, 4 and 3 isomers of CQA; 4 and 5 isomers of feruloylquinic acid; 3,4, 3,5 and 4,5 isomers of dicaffeoylquinic acid (diCQA; Fig. 1). Retention times and fragmentation patterns for the identification of CGA by LC–MS n are presented in Table 1. No CGA was detected in the control vessel (without coffee inoculation). All CGA underwent metabolism over the 24 h period of incubation with the faecal microbiota (Fig. 1; Table 2), with the majority of CGA being metabolised by 10 h of incubation. Parallel to the loss of CGA, a number of new peaks appeared over the 24 h period (peaks 2, 3 and 4; Fig. 2), which were identified as dihydrocaffeic acid ([M − H]– m/z MS1: 180·9, MS2: 136·8) (peak 2), dihydroferulic acid ([M − H]– m/z MS1: 194·8, MS2: 135·8) (peak 4) and an unknown compound ([M − H]– m/z MS1: 377·0, MS2: 202·2, 172·8) (peak 3). Caffeine levels were similar in all the three coffee samples (53 (sem 0·4) mg) and remained unmetabolised throughout the experiment (Fig. 2), suggesting the selective metabolism of CGA by the microbiota. Pure CGA (5-CQA isomer, 80·8 mg) was also rapidly metabolised to dihydrocaffeic acid ([M − H]– m/z 180·9, 136·8) and the unknown compound ([M − H]– m/z MS1: 377·0, MS2: 202·2, 172·8) being identified after incubation with the microbiota; however, dihydroferulic acid was not observed.
HPLC chromatograms at 320 nm of Nescafé Green Blend vessel samples demonstrating the depletion of chlorogenic acids over time: (a) 0 h, (b) 4 h, (c) 10 h and (d) 24 h. mAU, milli absorbance units; 1, 3-caffeoylquinic acid (3-CQA); 2, 5-CQA; 3, 4-CQA; 4, 5-feruloylquinic acid (5-FQA); 5, 4-FQA; 6, 3,4-diCQA; 7, 3,5-diFQA; 8, 4,5-FQA.

Negative-ion MS2 fragmentation data for identification of chlorogenic acids in coffee at 0 h
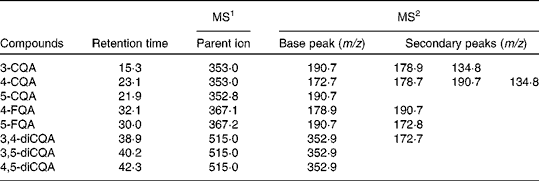
CQA, caffeoylquinic acid; FQA, feruloylquinic acid.
Chlorogenic acids (CGA) in Nescafé Green Blend, Nescafé Gold Blend and Nescafé Original at 0, 4, 10 and 24 h (Mean values with their standard errors)
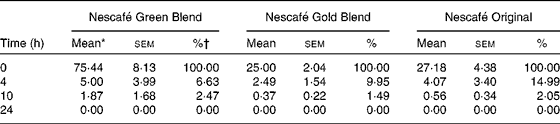
* mg CGA in the vessel (150 ml).
† % of CGA remaining in the vessel in comparison with that at 0 h.
(a–d) HPLC chromatograms at 280 nm (0, 4, 10 and 24 h, respectively) and (e–h) UV spectra of Nescafé Green Blend vessel samples demonstrating the formation of chlorogenic acid metabolites and the continued presence of caffeine. mAU, milli absorbance units. 1, Caffeine; 2, dihydrocaffeic acid; 3, unknown compound; 4, dihydroferulic acid.

Chlorogenic acids induce changes in bacterial groups
All coffee samples induced an increase in the growth of total bacteria (Fig. 3), at a similar magnitude to that observed with fructo-oligosaccharide (FOS), an established prebiotic, although this was only significant for Nescafé Green Blend and Nescafé Gold Blend (P< 0·05), relative to the control vessel. Nescafé Green Blend was the only coffee that induced a significant increase in the growth of Bifidobacterium spp., with a similar magnitude to that observed with FOS (Fig. 3). All coffee samples failed to alter the growth of Lactobacillus/Enterococcus spp. (unlike FOS) or the C. histolyticum group (unlike FOS that induced a decrease) (Fig. 3). However, two of the three coffee samples (Nescafé Gold Blend and Nescafé Original) significantly increased the growth of the C. coccoides–E. rectale group relative to the control vessel, although FOS decreased the growth of this bacterial group. Finally, Bacteroides spp. increased to a similar magnitude in all the three coffee treatments, whereas a decrease in the growth of these bacteria was observed in response to FOS, albeit not significant (Fig. 3). Similar to that observed with the coffee treatments, pure CGA (5-CQA) increased the growth of Bifidobacterium spp. (P< 0·05) and the C. coccoides–E. rectale group (P< 0·05) (Fig. 4), but there were no significant changes in the growth of total bacteria, Lactobacillus/Enterococcus spp., Bacteroides spp. or the C. histolyticum group, although it did induce a substantial decrease in the growth of the latter (Fig. 4). No significant changes were observed between the coffee treatments for any of the bacteria assessed.
Influence on colonic bacterial populations during the fermentation of FOS (![]() ), Nescafé Green Blend (
), Nescafé Green Blend (![]() ), Nescafé Gold Blend (
), Nescafé Gold Blend (![]() ) and Nescafé Original (
) and Nescafé Original (![]() ). Bacterial changes expressed as log10 cells/ml relative to the control vessel. Values are means, with their standard errors represented by vertical bars (n 3). *Mean value was significantly different from that of the control vessel (P< 0·05). EUB, total bacteria; BIF, Bifidobacterium spp.; LAB, Lactobacillus/Enterococcus spp.; CHIS, Clostridium histolyticum group; EREC, C. coccoides–Eubacterium
rectale group; BAC, Bacteroides spp.
). Bacterial changes expressed as log10 cells/ml relative to the control vessel. Values are means, with their standard errors represented by vertical bars (n 3). *Mean value was significantly different from that of the control vessel (P< 0·05). EUB, total bacteria; BIF, Bifidobacterium spp.; LAB, Lactobacillus/Enterococcus spp.; CHIS, Clostridium histolyticum group; EREC, C. coccoides–Eubacterium
rectale group; BAC, Bacteroides spp.

Influence on colonic bacterial populations during the fermentation of FOS (![]() ) and pure CGA (
) and pure CGA (![]() ). Bacterial changes expressed as log10 cells/ml relative to the control vessel. Values are means, with their standard errors represented by vertical bars (n 3). *Mean value was significantly different from that of the control vessel (P< 0·05). EUB, total bacteria; BIF, Bifidobacterium spp.; LAB, Lactobacillus/Enterococcus spp.; CHIS, Clostridium histolyticum group; EREC, C. coccoides–Eubacterium
rectale group; BAC, Bacteroides spp.
). Bacterial changes expressed as log10 cells/ml relative to the control vessel. Values are means, with their standard errors represented by vertical bars (n 3). *Mean value was significantly different from that of the control vessel (P< 0·05). EUB, total bacteria; BIF, Bifidobacterium spp.; LAB, Lactobacillus/Enterococcus spp.; CHIS, Clostridium histolyticum group; EREC, C. coccoides–Eubacterium
rectale group; BAC, Bacteroides spp.

Discussion
Prebiotics in the form of indigestible polysaccharides, predominantly inulin-type fructans( Reference Kolida and Gibson 34 ) and galacto-oligosaccharides( Reference Sako, Matsumoto and Tanaka 35 ), have been widely studied for their ability to positively modulate the profile of the human colonic microbiota. However, there are various other food components that reach the colon largely unmetabolised from the upper gastrointestinal tract, including polyphenols, which are known to undergo only limited absorption in the small intestine( Reference Tzounis, Vulevic and Kuhnle 24 – Reference Queipo-Ortuño, Boto-Ordóñez and Murri 26 ). A regular coffee consumer may consume up to 1 g CGA/d, with approximately 51–67 % of these being estimated to reach the colon( Reference Olthof, Hollman and Katan 6 , Reference Stalmach, Steiling and Williamson 7 ). As such, coffee-derived CGA may represent a potential candidate for inducing a ‘non-polysaccharide’-based prebiotic effect. In support of this, we show that coffee, equivalent to an oral dose of one cup (1·2 g instant powder), increases the growth of total bacteria to a similar magnitude to that observed with FOS. These changes were accompanied by the rapid and complete (by 24 h) metabolism of CGA and 5-CQA. Notably, exposure of coffee to the microbiota led to the detection of two metabolites, dihydrocaffeic acid and dihydroferulic acid( Reference Stalmach, Mullen and Barron 11 ), along with another unidentified metabolite. These metabolites were also detected following exposure to pure 5-CQA, although dihydroferulic acid was not produced in high amounts, perhaps because it is entirely or partially derived from an alternative CGA or a different CQA isomer.
All coffee samples increased the growth of Bifidobacterium spp., although the Nescafé Green blend coffee, which contained the highest amounts of CGA, was the only one to induce this growth significantly (P< 0·05). In support of CGA being the mediating compounds for these effects, an equivalent amount of 5-CQA (the most abundant CGA in coffee) also induced a significant increase in the growth of Bifidobacterium spp. Such increases in growth are biologically relevant as Bifidobacterium spp. have long been associated with positive health outcomes in the gut, through an enhancement of saccharolytic metabolism( Reference Woodmansey, McMurdo and Macfarlane 36 ), the production of organic fatty acids such as acetate and lactate, and their inherent anti-pathogenic capabilities( Reference Collado, Gueimonde and Hernandez 37 ). Furthermore, some species of Bifidobacterium have been noted for their ability to inhibit the proliferation of colon cancer cells( Reference Singh, Rivenson and Tomita 38 ), particularly in elderly individuals( Reference Gill, Rutherfurd and Cross 39 , Reference Vulevic, Drakoularakou and Yaqoob 40 ). Our data are in agreement with similar experiments using anthocyanins( Reference Hidalgo, Oruna-Concha and Kolida 41 ) and (+)-catechin( Reference Tzounis, Vulevic and Kuhnle 24 ), and with human intervention studies using flavanol-rich cocoa( Reference Tzounis, Rodriguez-Mateos and Vulevic 25 ) and coffee( Reference Jaquet, Rochat and Moulin 42 ) interventions. In support of our findings with respect to bacterial levels, the rapid metabolism of CGA upon exposure to the microbiota suggests that specific bacterial groups are capable of metabolising CGA. Indeed, Bifidobacterium spp. have previously been reported to exert esterase activity and, thus, would be capable of cleaving the caffeic acid moiety from its quinic acid counterpart( Reference Couteau, McCartney and Gibson 43 ).
In contrast, neither the coffee treatments nor 5-CQA affected the growth of Lactobacillus/Enterococcus spp., highlighting the difference between them and classical polysaccharide prebiotics. Previous investigations with polyphenols suggest that increases in the growth of Lactobacillus/Enterococcus spp. are possible with anthocyanins( Reference Hidalgo, Oruna-Concha and Kolida 41 ) and high-flavanol cocoa( Reference Salminen, Bouley and Boutron 44 ), although our data are consistent with previous coffee data( Reference Jaquet, Rochat and Moulin 42 ). Furthermore, in contrast to the changes in bacterial growth after exposure to FOS, all the three coffee treatments induced an increase in the growth of the C. coccoides–E. rectale group. Although these increases in growth proved to be not significant after exposure to Nescafé Green Blend due to a large variation, numbers of this bacterial group increased by approximately 0·4 log, greater than that observed with the other coffee treatments containing lower amounts of CGA. In support of this change, pure 5-CQA induced a significant increase in the growth of this bacterial group (P< 0·05), relative to the control vessel. E. rectale are known to possess butyrogenic potential. Butyrate is considered to have anti-inflammatory effects, as well as an ability to modulate the immune system and protect against oxidative stress( Reference Canani, Costanzo and Leone 45 ), and unlike other clostridia (C. coccoides (XIA cluster) analysed here, it also possess the ability to ferment polysaccharides and disaccharides( Reference Duerre 46 ) and, therefore, may well have the ability to metabolise CGA. The C. coccoides–E. rectale group, as a whole, has been observed to be reduced in patients with ulcerative colitis, and increasing the colonisation is considered to be beneficial to this bacterial group specifically( Reference Vermeiren, Van den Abbeele and Laukens 47 ). An increase in the growth of this bacterial group has previously been observed in response to (+)-catechin and (–)-epicatechin( Reference Tzounis, Vulevic and Kuhnle 24 ) and in vivo after an intervention with cocoa flavanols( Reference Tzounis, Rodriguez-Mateos and Vulevic 25 ).
The increase in the growth of Bacteroides spp. observed after exposure of the microbiota to coffee may be relevant to human health as this genus is known to be capable of fermenting polysaccharides to yield organic acids( Reference Hughes, Shewry and Li 48 ). As all the three coffee treatments increased the growth of this bacterial group to a similar magnitude, the changes may result due to other components than CGA, as 5-CQA had no significant influence on the growth of this bacterial group, in a similar manner to that observed with FOS. Similar observations were observed with respect to the growth of C. histolyticum, a bacterial group considered to be pathogenic, which did not alter in response to coffee treatment, but significantly decreased following exposure to 5-CQA. Previous data suggest that polyphenols consistently induce a decrease in the growth of the C. histolyticum group, for example malvadin-3-glucoside, enocianin (and gallic acid)( Reference Hidalgo, Oruna-Concha and Kolida 41 ) as well as the flavanols (–)-epicatechin and (+)-catechin( Reference Tzounis, Vulevic and Kuhnle 24 ), although in vivo flavanols have been shown to induce the growth of this bacterial group( Reference Tzounis, Rodriguez-Mateos and Vulevic 25 ).
In summary, our data suggest that coffee intake may be beneficial to the host via the potential of CGA (and potentially other coffee components) to selectively modulate the colonic microbiota. However, we accept that this is a preliminary investigation that is limited by a small donor number and although a robust model for the distal region of the colon, limitations of such investigations still prevail. A full colonic model, including pre-digestion of the coffee, would increase the validity of the work. Further in vivo work in this field is necessary to confirm these findings, although the present data provide an initial insight into the potential of CGA to act as a potential ‘prebiotic’ in the human large intestine.
Acknowledgements
The present study was supported by the Biotechnology and Biological Sciences Research Council's (BBSRC) Diet and Health Research Industry Club (DRINC) grant no. BB/G530133/1. The BBSRC DRINC had no role in the design and analysis of the study or in the writing of this article.
The authors' contributions are as follows: C. E. M. was responsible for all the experimental work and drafting of the manuscript; G. R. G. was the co-principal investigator of the project and manuscript drafting; X. T. assisted with the experimental work; M.-J. O.-C., post-doctoral research assistant, assisted with the experimental work; D. S. M. was the co-principal investigator of the project and manuscript drafting; J. P. E. S. was the principal investigator of the project, experimental design and manuscript drafting.
There are no conflicts of interest to declare.


