


Introduction
Since the 1990s, research into the relationship between ecosystem services and human well-being, including poverty alleviation, has blossomed (Sandifer et al., Reference Sandifer, Sutton-Grier and Ward2015; Grima et al., Reference Grima, Fisher, Ricketts and Sonter2019). This burgeoning literature owes its existence, in part at least, to the scientific foundations laid by the Millennium Ecosystem Assessment (2005), and to a number of research programmes, including the Natural Capital Project (at Stanford University, USA, from 2006) and the Ecosystem Services for Poverty Alleviation programme, established in the UK in 2008 (Ecosystem Services for Poverty Alleviation Programme, 2018; Natural Capital Project, 2019). By mid 2019 the Natural Capital Project had produced > 600 publications and the Ecosystem Services for Poverty Alleviation programme > 400. Other research programmes exploring linkages between ecosystem services and well-being include the Valuing Nature Network in the UK, and several funding calls under the EU's 7th Framework, Horizon 2020 and Biodiversa programmes.
It is increasingly recognized that it matters where and how knowledge about society and environment is generated (Müller, Reference Müller2021) and there is increasing attention to the role of international scientific networks in producing knowledge about global environmental problems and influencing policy-making (Mitchell et al., Reference Mitchell, Cash and Dickson2006). Patterns in the production of knowledge about ecosystems services and poverty are of particular relevance as poverty rates and direct dependence on ecosystem services are highest in the Global South (Suich et al., Reference Suich, Howe and Mace2015), yet many researchers are based in the Global North. The most highly cited articles (i.e. those with > 100 citations) on global ecosystem services were written by authors from the USA, Canada and the EU (Zhang et al., Reference Zhang, Estoque, Xie, Murayama and Ranagalage2019). Analyses of the Intergovernmental Science-Policy Platform on Biodiversity and Ecosystem Services (IPBES) has shown that the balance of regions, genders, disciplines and knowledge systems is still disproportionally dominated by male natural scientists from the Global North (Montana & Borie, Reference Montana and Borie2016; Timpte et al., Reference Timpte, Montana, Reuter, Apkes and Borie2017; Díaz-Reviriego et al., Reference Díaz-Reviriego, Turnhout and Beck2019), patterns previously observed within the Intergovernmental Panel on Climate Change (Hulme & Mahoney, Reference Hulme and Mahoney2010; Castree et al., Reference Castree, Adams, Barry, Brockington, Büscher and Corbera2014; Corbera et al., Reference Corbera, Calvet-Mir, Hughes and Paterson2016; Gay-Antaki & Liverman, Reference Gay-Antaki and Liverman2018).
Researching the linkages between ecosystems, development and poverty ideally requires an interdisciplinary approach, combining natural science with the insights of economics and other social sciences (Daw et al., Reference Daw, Brown, Rosendo and Pomeroy2011; Howe et al., Reference Howe, Suich, Vira and Mace2014; Chaigneau et al., Reference Chaigneau, Brown, Coulthard, Daw and Szaboova2019). We, for example, have backgrounds in environmental science, geography, anthropology and zoology. Yet research on the values of nature can be dominated by particular disciplines, such as economics, at the expense of other forms of evaluation (Kallis et al., Reference Kallis, Gómez-Baggethun and Zografos2013; Hansjürgens et al., Reference Hansjürgens, Schröter-Schlaack, Berghöfer and Lienhoop2017). Disciplinary backgrounds shape and potentially limit the understanding of what poverty means (for example, with respect to gender; Agarwal, Reference Agarwal2010), which dimensions of poverty count, which aspects of ecosystem services matter and the nature of the multiple relationships between poverty and ecosystem services (Howe et al., Reference Howe, Corbera, Vira, Brockington and Adams2018). Understanding how knowledge about ecosystem services and poverty alleviation is generated is therefore important.
Here we apply social network analysis to the production of scientific knowledge on ecosystem services and poverty alleviation. We investigate who wrote the most cited peer-reviewed publications during January 1990–May 2016 and where they have published; which collaborative networks have emerged and how these relate to the authors' disciplinary backgrounds and country of employment; and which institutions and funding sources have supported the reported research. We pay particular attention to the role played by the Natural Capital Project and the Ecosystem Services for Poverty Alleviation programme because of the breadth and size of their published outputs up to May 2016 (> 700 papers).
Methods
To identify the most relevant producers of academic knowledge in the field of ecosystem services and poverty, we conducted a multi-stage data selection and screening process. We conducted a term-based search in Web of Science (Clarivate Analytics, Philadelphia, USA) of all published academic documents (peer reviewed journal articles, books, book chapters and conference proceedings) in English, published during January 1990–May 2016 that contained at least one combination of key terms in the abstract and/or main text: (ecosystem service*, OR environment* service*, OR ecosystem* approach*, OR ecosystem good*, OR environment* good*, OR environment* benefit*, OR ecosystem benefit*) AND (poverty, OR poverty eradicat*, OR poverty alleviat*, OR poverty eliminat*, OR poverty reduc*, OR anti-poverty, OR pro-poor, OR well-being, OR wellbeing, OR prosperity, OR equality, OR inequality).
We selected this period to reflect the increase of literature on ecosystem services and poverty, and the work of the Natural Capital Project and Ecosystem Services for Poverty Alleviation programme before the rise of IPBES and its development of new terminology based on the concept of nature's contributions to people (Pascual et al., Reference Pascual, Balvanera, Díaz, Pataky, Roth and Stenseke2017).
The search returned 1,430 publications. We recognize that our search excluded papers published in languages other than English, and that alternative search terms could have been used. However, we are confident that our sample is sufficiently comprehensive to allow us to address our research questions. For each publication, we extracted the following information: author(s), title, outlet, number of citations received by each paper at the time of collection, year, volume, issue, pages, digital object identifier, funding and acknowledgements (Supplementary Material 1). Additionally, we noted if the article had been funded by the Natural Capital Project and/or the Ecosystem Services for Poverty Alleviation programme by examining whether these programmes were mentioned in the articles’ funding or acknowledgements sections, as well as by comparing the titles from our primary search with the overall published outputs of both programmes, as available on the programmes’ websites in May 2016.
The 1,430 publications involved 4,849 authors. We ranked these authors by the total number of citations that their articles in the sample had received, distinguishing between authors who had published only one article and those who had published more than one (Supplementary Material 1, Supplementary Fig. 1). We then noted the point at which the curve of those who had written more than one publication started to decline steadily, which corresponded to the author with 24 citations and ranked in the 409th position. In doing so we aimed to exclude authors who, for example, had participated in only one highly cited publication or whose work had not been extensively cited. We thus consider these top 409 authors as those more relevant in the production of knowledge on ecosystem services and poverty.
We read the abstracts of the articles written by these 409 authors to ensure that the articles dealt with both ecosystem services and poverty (or a similar concern or qualification, such as equality or inequality, and poverty alleviation). We found two articles focused on other topics, and thus excluded the authors of these articles. We then collected professional data for the remaining 407 authors, using their most recent curriculum vitae, accessed through the public webpage of their institution or other public webpages (ResearchGate, Google Scholar, Academia). If a curriculum vitae was not available, we extracted information from the author's institutional webpage or from other sources referring to the researcher (e.g. professional biographies for conferences). If we could not locate all of the required information for an author, we corresponded with them, explaining our research and requesting their latest curriculum vitae. We could not obtain professional data for 6 authors, resulting in a final sample of 401 authors.
For these 401 authors, we collected data on their gender based on photographs available online. We recognize the problems of using this method and binary classification, but authors' pronouns were not generally available. We recorded each author's PhD granting institution and country, with countries further coded using the United Nations country group categories: EU, North America, Latin America (including Mexico), Sub-Saharan Africa, Middle East and North Africa, Asia, and Oceania. We recorded the authors' academic discipline based on their PhD subject area, as ecology and conservation biology, biological sciences (other than ecology and conservation biology), physical sciences, humanities, social sciences (excluding economics), economics, and engineering. We collected data on both past and current employment institutions, including name and country, as well as participation in international research initiatives, such as IPBES. Authors for whom we could not locate data on their PhD country, PhD region or PhD discipline were treated as missing data (recorded as ‘no data’ in the results, below). In the case of 23 authors we were unable to locate a complete history of post-PhD employment institutions. To examine co-authorship patterns, we identified the number of publications that each of the 401 authors had written with others from within the sample of 401 authors. We also classified the outlets where the articles of the primary search had been published and ranked these in terms of occurrences and the total number of citations received by the articles of each outlet (Supplementary Material 1).
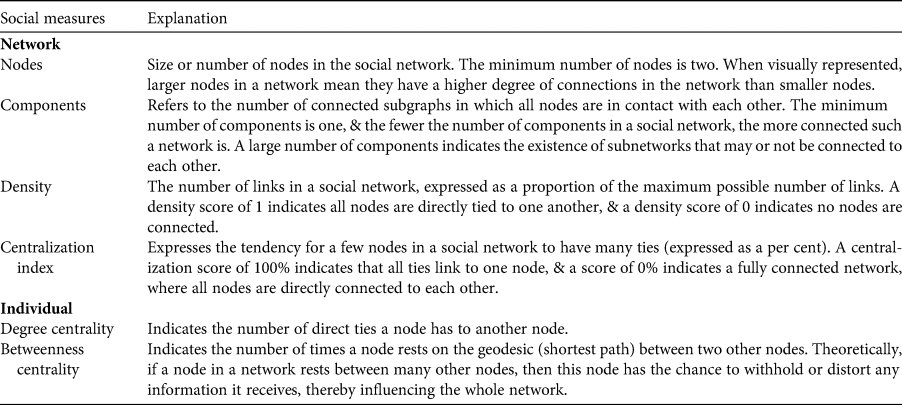
We used Ucinet6 (Borgatti et al., Reference Borgatti, Everett and Freeman2002) and Netdraw (Borgatti, Reference Borgatti2002) to examine how the 401 authors collaborated with each other, and which institutions and career pathways the authors shared. We calculated four network-level measures (Table 1), examining the level of cohesion or fragmentation and the existence of leaders in terms of connectivity (Borgatti et al., Reference Borgatti, Mehra, Brass and Labianca2009). We also calculated two individual-level centrality measures, widely recognized as reliable indicators of prestige: degree centrality (Wasserman & Faust, Reference Wasserman and Faust1994) and brokering capability (betweenness centrality; Burt et al., Reference Burt, Kilduff and Tasselli2013). In social network theory, nodes with high degree centrality in the network are those with a high number of ties and that are key in mobilizing the network and bringing other nodes together. Nodes with high betweenness centrality are those that more frequently bridge across two other nodes. Here, authors with high degree centrality represent those who have more connections with other authors in the network (e.g. in terms of shared publications), and institutions with high betweenness centrality are those that more often connect two other institutions through the authors' career pathways. These authors and institutions can be considered as important individuals and places in terms of knowledge production, circulation and dissemination, and in the formation of epistemic communities (Phelps et al., Reference Phelps, Heidl and Wadhwa2012). We developed three types of network: the co-authoring network of the 401 authors, by gender; the co-authoring network of the 30 highest-ranked authors in terms of the total citations to their papers in the primary search sample, by gender and employment region; and the network of the 30 institutions that more often act as key bridges in the authors’ career pathways, by betweenness score (Supplementary Material 1).
Social network measures considered in this research.
Results
Authors' publishing outlets, disciplines and institutional backgrounds
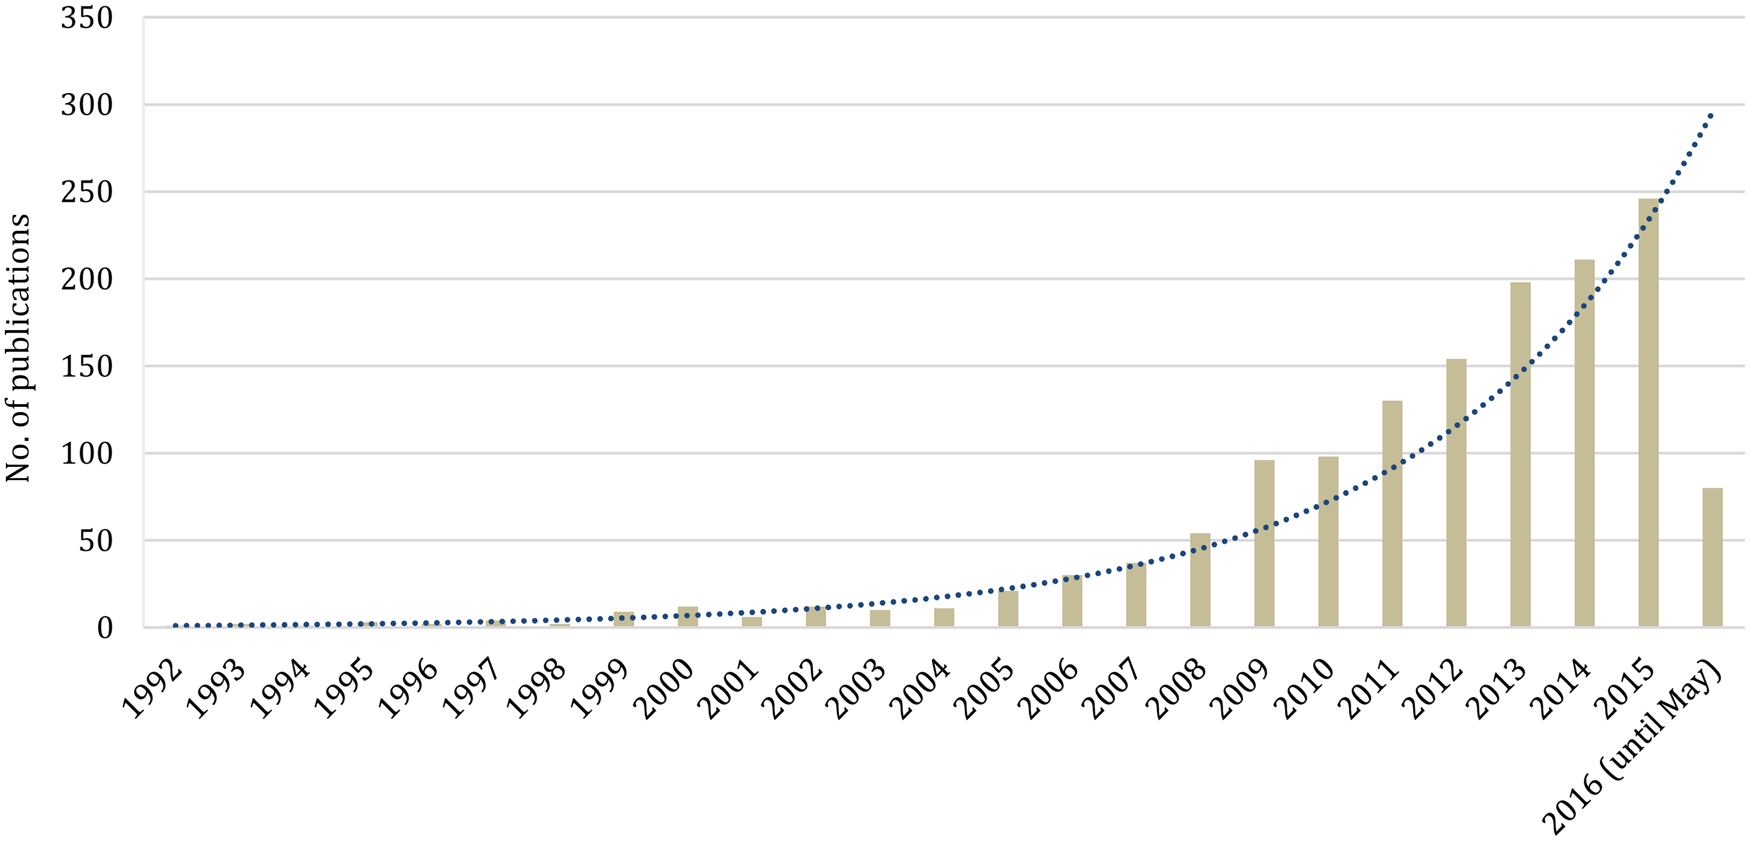
The total sample of searched articles shows an exponential growth in publication volume, particularly from 2009 onwards (Fig. 1). These articles have been published in a total of 537 outlets or academic proceedings, across a wide range of disciplines. However, almost half of the publications (602 of 1,430) were published in only 29 journals, which represent 61% of the total number of citations that the 1,430 articles accumulated over the study period (12,771 of 20,938). The top-10 journals in terms of number of articles published were (in order): Ecological Economics, Ecology & Society, Ecosystem Services, Land Use Policy, Proceedings of the National Academy of Sciences of the United States of America (PNAS), Ecological Indicators, PLOS ONE, BioScience, Global Environmental Change, and Landscape and Urban Planning. The top-10 journals in terms of accumulated citations were (in order): PNAS, Ecological Economics, Ecology & Society, Conservation Biology, Frontiers in Ecology and the Environment, Ecology Letters, World Development, Science, BioScience and the Philosophical Transactions of the Royal Society B—Biological Sciences. The lead authors were unevenly distributed geographically: 27% were based in North American institutions (Canada, 3%; USA, 24%), 38% in Europe, 7% in Australia, 14% in Asia, Latin America, Middle East and North Africa, and Sub-Saharan Africa, 3% in international institutions, and we could not find affiliation information for 11% of the authors (Supplementary Material 1).
Number of publications in the primary search article sample by year. Note that we searched only up to May 2016. The dotted line is an exponential trend line.
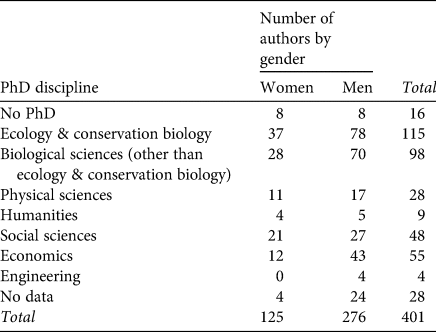
Of the 401 authors with at least two publications and ≥ 24 citations, 69% were men and 31% women, and 60% had a background in ecology and conservation biology, biological sciences or physical sciences, followed by economics (14%; Table 2). There were few authors from the humanities. The gender imbalance was greater amongst those with an ecology, biological or physical sciences background and less so in those from the social sciences and humanities (Table 2). Approximately 80% of these 401 authors received their PhD from academic institutions in the EU, USA or Canada. The most common countries of PhD training were the USA (126 authors) and the UK (79 authors; Table 3). There was a similar pattern regarding employment: 80% were based in the EU or North America, with 120 and 76 in the USA and UK, respectively. This mirrors the geographical distribution of the lead authors in the full sample of articles. Regarding mobility between PhD training and current employment, 80 and 85% of the authors received their PhD in the EU or in North America, respectively, and are currently working in the same region; 58% of those who work in Sub-Saharan Africa, and 30% of those who work in Latin America, received their PhD in EU- or USA-based institutions (Table 3).
Gender and PhD discipline of the 401 authors with at least two publications and ≥ 24 citations.
The PhD and employment regions of the 401 authors with at least two publications and ≥ 24 citations.
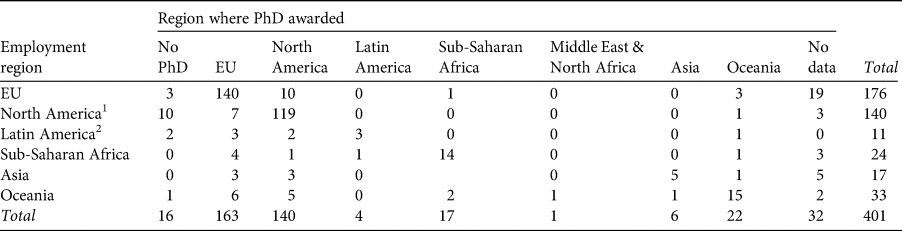
1 USA and Canada.
2 Including Mexico.
Collaboration patterns and institutional trajectories
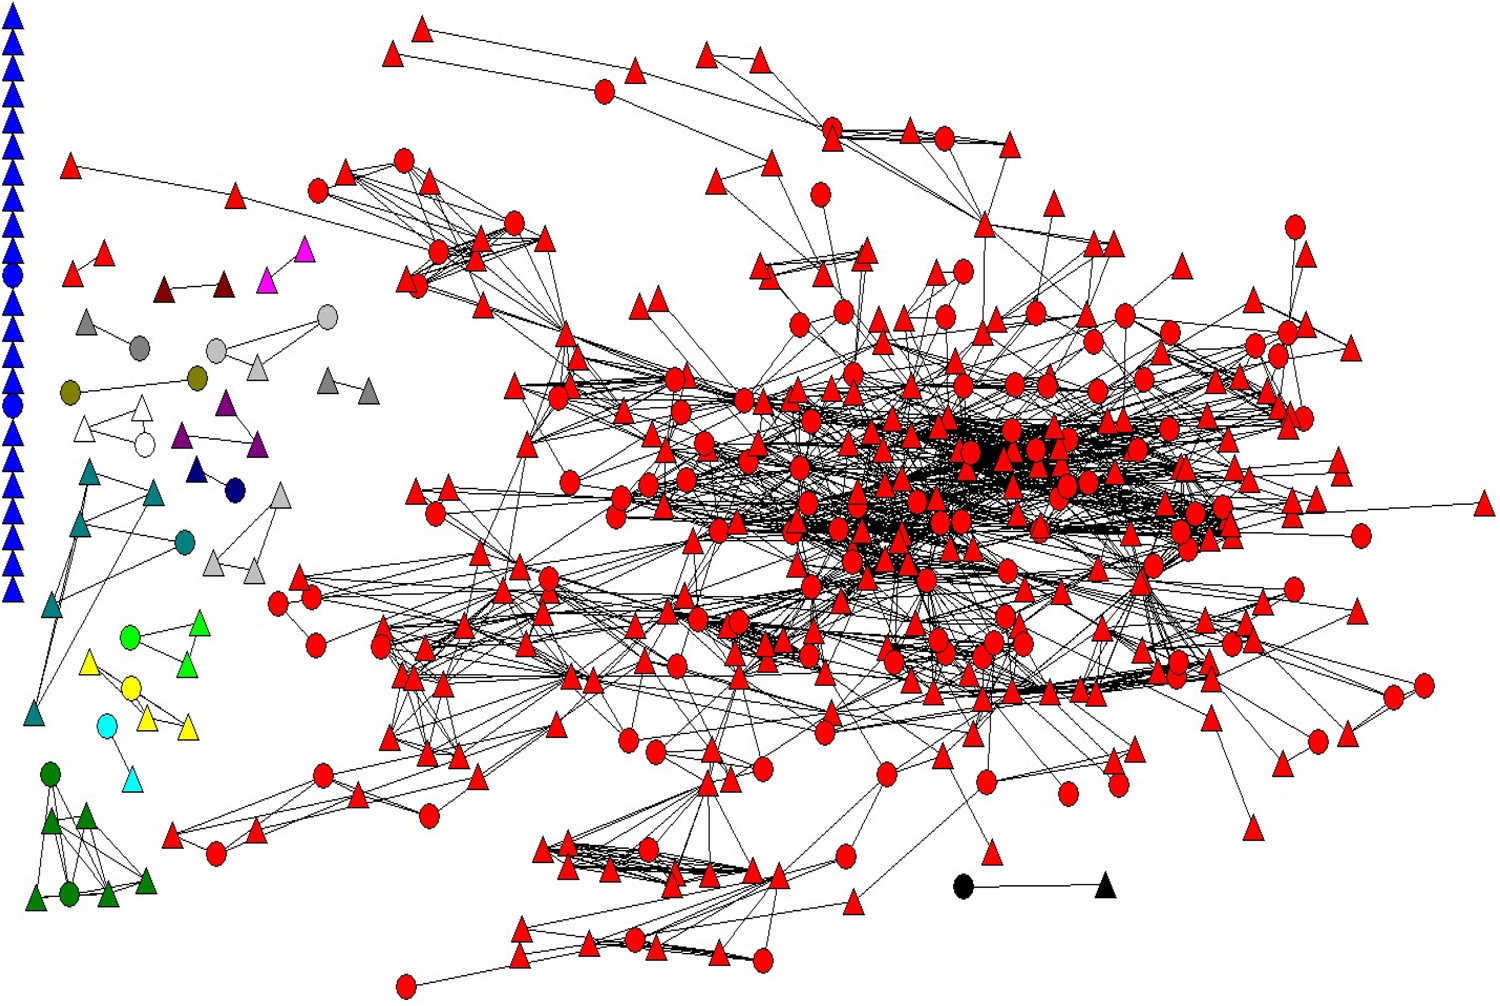
The 401 nodes (i.e. authors) of the co-authorship network (Fig. 2) fell into 41 components. Overall the network was not strongly centralized: its centralization index was 2.16%, reflecting a lack of dominant authors. Its density of 0.0287 indicates a modest but significant number of ties between authors. The main component of the network comprised 328 authors who had co-authored more than one paper together, reflecting a strongly collaborative network. The figure has a few standalone components indicating smaller communities of authors who have published together but are disconnected from the central component. Twenty-three authors had not co-authored with others and constituted a single component each.
Co-authoring network of the 401 authors with at least two publications and ≥ 24 citations, by gender (triangles, men; circles, women). Each node represents an author and a line between two nodes indicates that the authors co-authored at least one paper together. Colours distinguish the network's components, with red indicating the component involving the large majority of authors with more frequent co-authorship, and blue indicating the 23 authors who have not co-authored with others. Other colours identify smaller components involving authors who have co-authored together but have not co-authored with those of the central component.
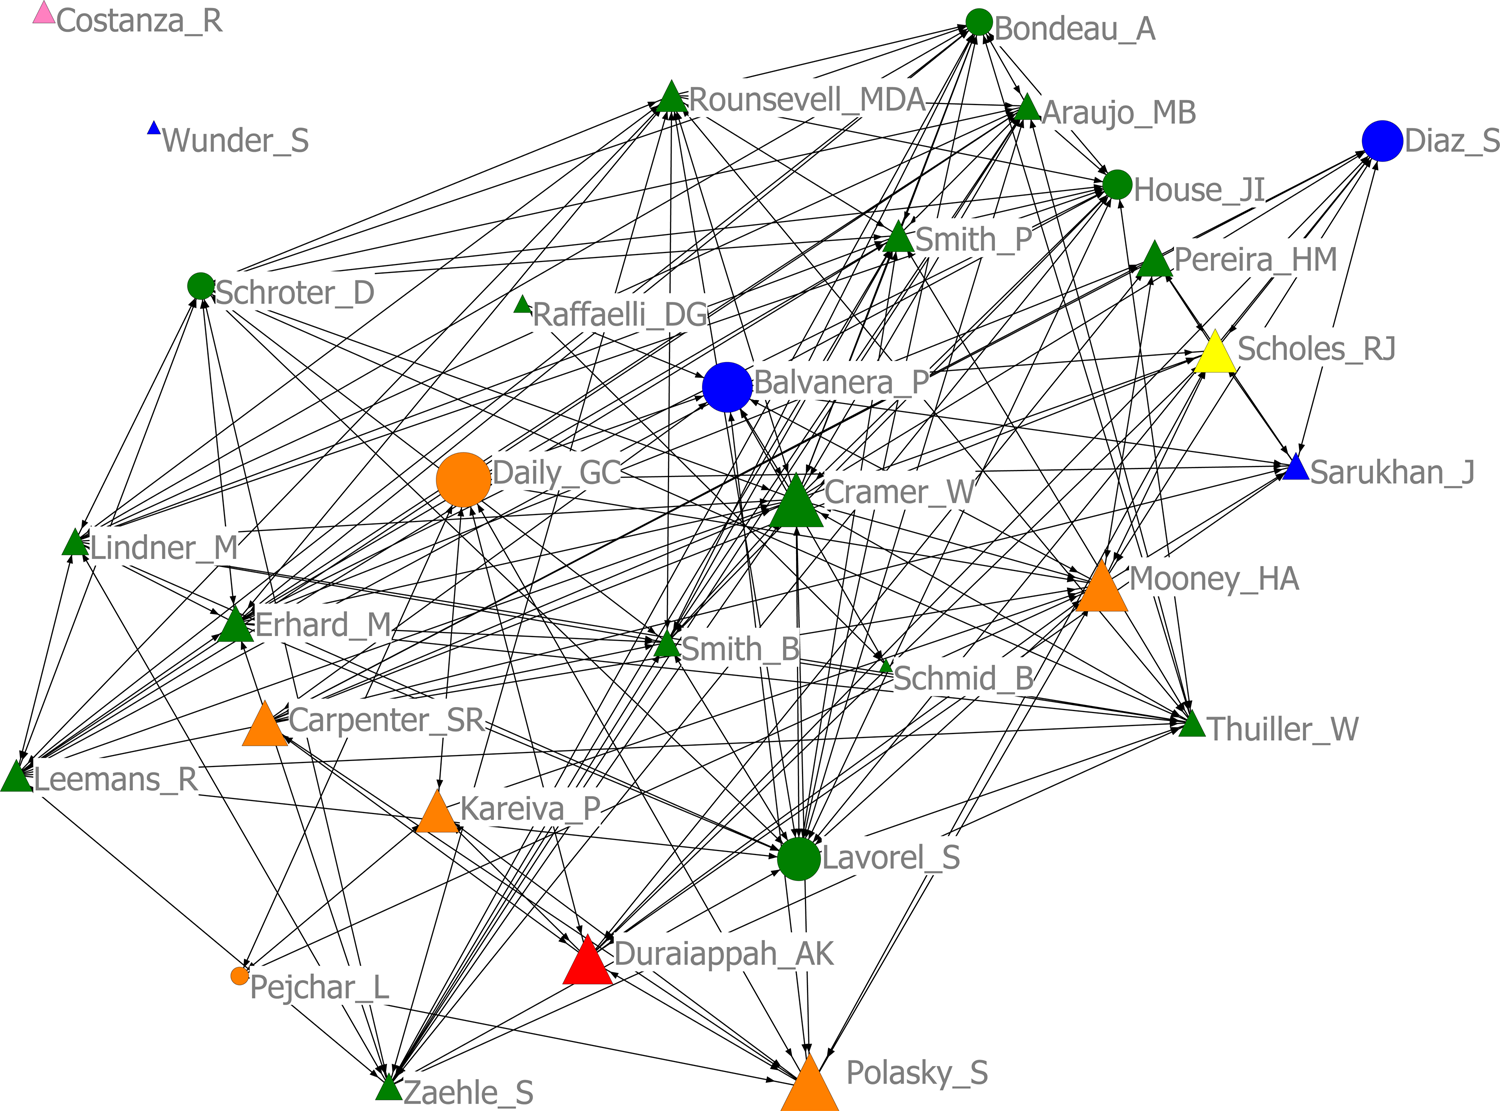
In the co-authoring network of the 30 authors whose articles of the primary search sample had received more citations overall (eight women and 22 men), most were based in the EU and North America (Fig. 3). Authors based in North America had co-authored more with other top-cited authors. Three people (Daily, Balvanera and Cramer) had the highest level of collaboration and appeared centrally in the network, followed by Mooney, Lavorel, Duraiappah and Kareiva.
Co-authoring network of the 30 highest-ranked authors in terms of the number of citations received by their articles (first column, Table 4), by gender (triangles, men; circles, women) and employment country (green, Europe; orange, North America; blue, Latin America (including Mexico); yellow, Sub-Saharan Africa; red, Asia; pink, Oceania). Each node represents an author and lines between nodes indicate that the two authors co-authored at least one paper together. Node size indicates degree score: larger nodes represent those who have co-authored more with others and smaller nodes represent those who have co-authored less. The authors displayed belong to the central network component (in red) of Fig. 2.
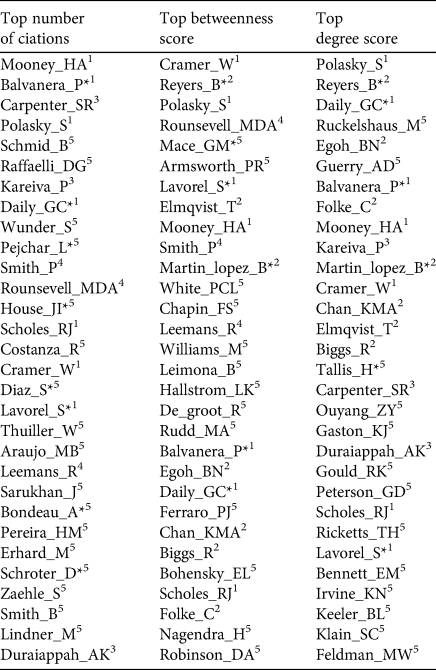
By comparing these 30 most-cited authors with the authors who had highest degree and betweenness scores we can examine the relationships between citations, collaboration and brokering (Table 4). Seven authors (Mooney, Balvanera, Polasky, Daily, Scholes, Cramer, Lavorel) were particularly well-cited, co-authored extensively, and acted as bridges across the overall authoring network (with high degree and betweenness centrality scores). Three other authors (Smith, Rounsevell, Leemans) were well-cited and acted as network-brokering nodes but had not co-authored as much as others (in the top categories for citations and betweenness; Table 4). Three other authors (Carpenter, Duraiappah, Kareiva) featured in the top cited and top degree lists (i.e. they were well-cited and co-authored extensively). Seven authors (Folke, Biggs, Chan, Egoh, Reyers, Elmqvist, Martin-López) featured in the top degree and betweenness lists; i.e. they published many joint papers and were key network-brokering nodes in the authorship network. In these patterns, forms of academic authority and influence (e.g. in terms of citations, level of collaboration and brokering capability) are not necessarily correlated.
Top 30 authors ranked according to the number of citations received by their articles, and their betweenness and degree scores, in decreasing order. For the full data set, see Supplementary Material 1.
*Author is a woman.
1Present in all three categories.
2Present in the top betweenness and degree categories.
3Present in the top cited and degree categories.
4Present in the top cited and betweenness categories.
5Present in only one of the three categories.
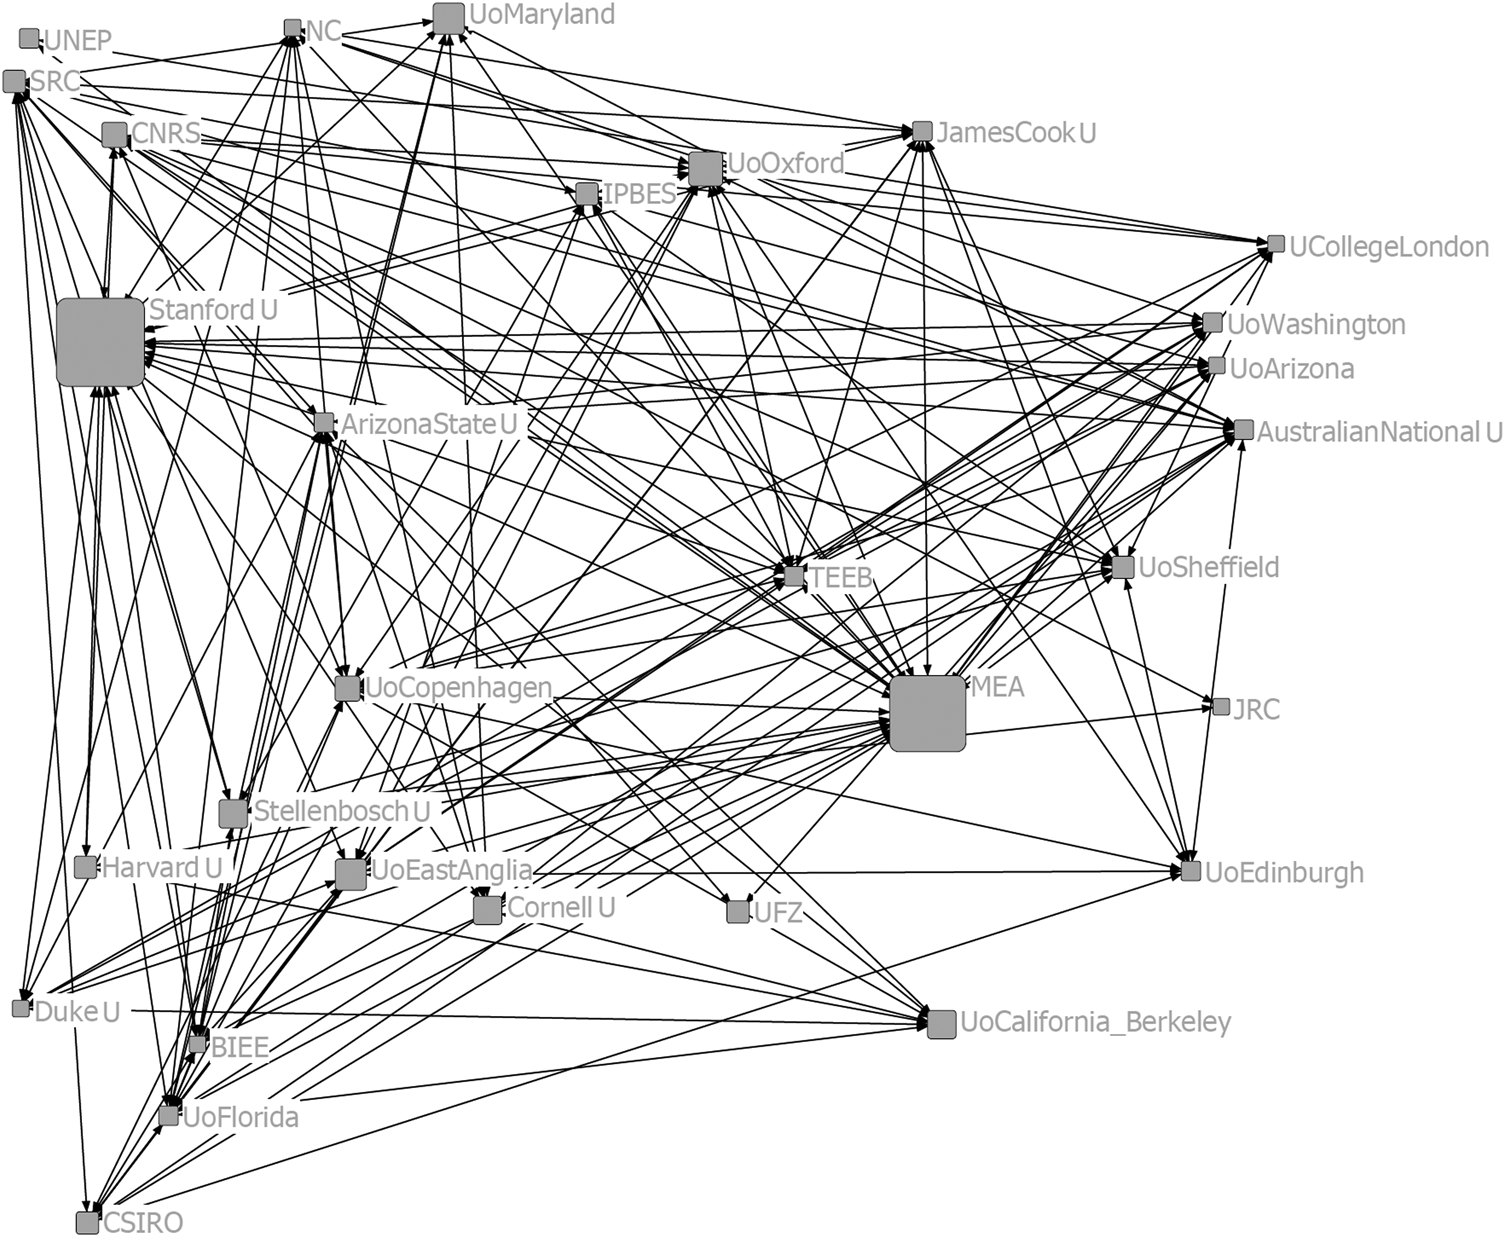
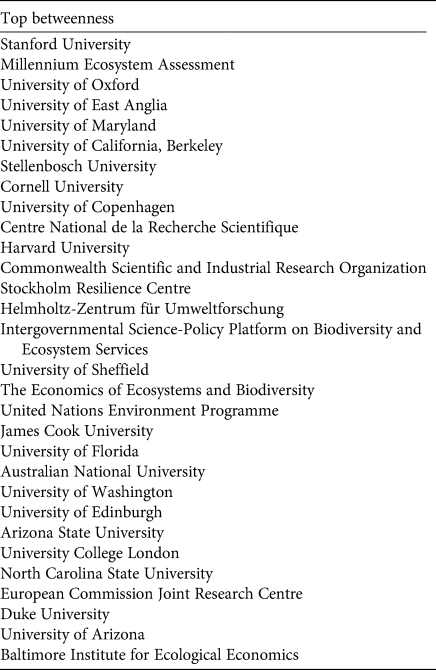
With respect to authors’ career trajectories, including the institutions within which they undertook their PhD and where they have worked, the top five institutions were the Universities of Stanford, Oxford, East Anglia, Maryland and California (Berkeley) (Fig. 4). Most of the top-30 institutions in terms of betweenness centrality scores were located in the USA and the EU. Only Stellenbosch University, and four international research initiatives (the Millennium Ecosystem Assessment, United Nations Environment Programme, IPBES, and The Economics of Ecosystems and Biodiversity), had a similar degree of influence (Table 5).
Network of the top 30 institutions and organizations based on their betweenness scores. Lines between institutions indicate that at least one author has been in both institutions throughout their career. Node size indicates betweenness scores: larger nodes represent institutions that more frequently act as a bridge between two other institutions in the authors’ careers and smaller nodes represent those that appear less frequently.
The top 30 institutions and organizations ranked according to their betweenness score, in decreasing order. For the full data set, see Supplementary Material 1.
Influence of the Natural Capital Project and the Ecosystem Services for Poverty Alleviation programme
By the time we collected our data (May 2016) the Natural Capital Project and the Ecosystem Services for Poverty Alleviation programme had resulted in 374 and 343 peer-reviewed articles, respectively. In our sample of 1,430 papers, only 28 (written by 165 authors) were supported by funding from the Natural Capital Project and only 19 (87 authors) were supported by funding from the Ecosystem Services for Poverty Alleviation programme; i.e. only c. 3% of the articles we identified acknowledged support from these two funding programmes.
Only one of the authors funded by the Ecosystem Services for Poverty Alleviation programme (Rounsevell) was in the 30 top cited authors, six were in the 30 top betweenness authors (Biggs, Mace, Martin, Reyes, Rounsevell, Williams), and four were in the 30 top degree authors (Biggs, Martin, Petersen, Reyes). For authors funded by the Natural Capital Project, 10 are in the 30 top cited authors (Balvanera, Carpenter, Cramer, Daily, Duraiappah, Kareiva, Mooney, Pejchar, Polasky, Scholes), 15 are in the 30 top betweenness authors and 24 in the 30 top degree authors. Only three authors among the 30 top betweenness and degree scores (Biggs, Martin, Reyers) have authored articles funded by at least one of the funding schemes, and only seven authors contributed to articles funded by both programmes (Biggs, Brown, Johnson, Martin, Reyers, Vira, Wang).
Discussion
The first finding from our analysis is that most knowledge produced on ecosystem services and poverty within our sample was authored by scholars based in the EU and North America. This reflects the strong Northern bias common in the peer-reviewed scientific literature. Countries, institutions and authors based in the Global North act as hubs in the production of knowledge across disciplines and issues (Pasgaard et al., Reference Pasgaard, Dalsgaard, Maruyama, Sandel and Strange2012; Manzano-Agugliaro et al., Reference Manzano-Agugliaro, Alcayde, Montoya and Zapata-Sierra2013; Pan & Vira, Reference Pan and Vira2019; Ramos et al., Reference Ramos, Koterba, Rosi Júnior and Teixeira2019; Ramos-Rincón et al., Reference Ramos-Rincón, Pinargote-Celorio, Belinchón-Romero and González-Alcaide2019). In some fields of enquiry, such as renewable energy, this pattern may be changing as researchers in China, India, Brazil and South Africa increase participation in international research networks and publish in more highly cited journals (Rizzi et al., Reference Rizzi, van Eck and Frey2014). However, we did not find such a trend in our analysis, nor is this the case in the ecosystem services literature more broadly (Zhang et al., Reference Zhang, Estoque, Xie, Murayama and Ranagalage2019).
Our second finding is the centrality of ecology, biological and physical sciences, and economics to research on the links between ecosystem services and poverty. The social sciences have made limited contributions. Thus, as in other fields where more multidisciplinary and multi-country research efforts would seem to be called for, social scientists (with the exception of economists) and scholars from the humanities have had a minimal role (Castree et al., Reference Castree, Adams, Barry, Brockington, Büscher and Corbera2014; Vadrot et al., Reference Vadrot, Jetzkowitz and Stringer2016). The distribution of skills and expertise also suggests that the networks producing most research on ecosystem services and poverty alleviation have concentrated on the natural science and economic questions around ecosystem services rather than the social science questions around poverty alleviation. Social science disciplines, such as sociology, psychology, political science or geography, can offer valuable insights into poverty dynamics and their intersection with ecosystem services (e.g. issues of gender, resource governance, law, policy, livelihoods and cultural understandings of nature). Neglect of these issues is a recognized problem in research on natural resource governance for both conservation and development (Brockington et al., Reference Brockington, Adams, Agarwal, Agrawal, Büscher and Chhatre2018). Research on ecosystem services and poverty alleviation may require wider interdisciplinary collaborations than have so far dominated.
Our third finding is that there is a gender gap in the production of knowledge about ecosystem services and poverty. The dominance of men among authors and across all backgrounds reflects the pattern observed in most scientific disciplines and in the publication of peer-reviewed articles (Barrios et al., Reference Barrios, Villarroya, Ollé and Ortega2013; Astegiano et al., Reference Astegiano, Sebastián-González and Castanho2019), although the pattern does not hold for all academic fields: e.g. molecular biology and psychology include more women than men, at least at PhD level (Leslie et al., Reference Leslie, Cimpian, Meyer and Freeland2015). However, our analysis also shows that a small number of female authors are highly cited and play a key role in the networks producing knowledge. Again, this reflects broader patterns in science; the citation-based impact of the research conducted by the two genders is similar (Barrios et al., Reference Barrios, Villarroya, Ollé and Ortega2013; Astegiano et al., Reference Astegiano, Sebastián-González and Castanho2019). In the context of IPBES, it has been argued that the dominance of natural scientists (and the limited involvement of women and Indigenous people) may have foreclosed ‘the option of including incommensurable and dissenting perspectives and knowledges’ (Díaz-Reviriego et al., Reference Díaz-Reviriego, Turnhout and Beck2019, p. 6), with implications for the depth and breadth of insights, as well as for the social legitimacy and representativeness of policy recommendations emerging (Banerjee & Bell, Reference Banerjee and Bell2007; MacGregor, Reference MacGregor2009; Carey et al., Reference Carey, Jackson, Antonello and Rushing2016). Understanding of the role of ecosystem services in poverty alleviation may require more gender-balanced collaborations than have so far been achieved.
Our fourth finding, unexpectedly, is that the Natural Capital Project and the Ecosystem Services for Poverty Alleviation programme have had relatively little impact on the number of peer-reviewed publications about ecosystem services and poverty over the study period. Neither initiative is strongly represented in the literature we analysed (having apparently supported the research published in < 3 % of the articles in our sample of 1,430), or to have strongly influenced patterns of collaboration amongst authors. Neither appears to have played a foundational role in the co-authoring network. The Natural Capital Project is linked to more papers, which is not that surprising as it began 2 years earlier. Authors funded by it are strongly represented among the most cited authors, with half acting as key network brokers and > 75% being among the most collaborative, but most papers in our sample derived funding from other sources. It appears that most of the research funded by these initiatives in our sample did not have a central analytical focus on poverty. This is surprising, given that both aimed to produce research concerned with human well-being and poverty alleviation, and because many of the authors in these networks did obtain funding from these programmes. This may reflect the practical difficulties of making the connection between ecosystem services and poverty alleviation, and/or that more specialized research to advance understanding of ecosystems tends to be published before research on their contribution to poverty alleviation. However, we concluded our data collection in 2016, before all the outputs of the Ecosystem Services for Poverty Alleviation programme had been published, and as a result we may not have captured all papers reporting funded research that focused on poverty issues.
In conclusion, our findings suggest that a range of changes are required to the way the production of knowledge on ecosystem services and poverty is organized. There is a need to broaden the geography of knowledge production and the disciplinary range of research, and to address gender gaps and to focus research funding on issues of poverty as well as on ecosystem science. In particular, we identify four opportunities to improve the system of knowledge production on ecosystem services and poverty. Firstly, we see potential for more extensive collaboration and knowledge co-production across disciplines, as the study of the relationship between ecosystem services and poverty requires an interdisciplinary lens to be fully understood and acted upon. Secondly, we see a need to increase the involvement and centrality of researchers based in the Global South in publication networks, suggesting that increasing no-fee access to high impact factor journals, and efforts by Northern researchers to read and cite the work of scholars outside the Northern scientific mainstream are important. Thirdly, there is a need to promote the role of Southern researchers in research design and leadership. There is a role here for funding programmes to actively seek inputs from these individuals to research agenda design, and to encourage them to lead research projects. Fourthly, we see potential to draw activists and practitioners, especially from traditionally disempowered minorities, into the production of knowledge about ecosystem services and poverty, to maximize the range of insights brought to understanding this critical conservation and development problem.
Acknowledgements
This research was funded with support from the Ecosystem Services for Poverty Alleviation programme (Grant number NE/M007561/1), which is funded by the UK Department for International Development, the Economic and Social Research Council and the Natural Environment Research Council. EC and SMA note that this article contributes to ICTA-UAB ‘María de Maeztu Unit of Excellence’ (MDM-2015-0552; MDM-2019-0940). Data collection was supported by Samuel Murphy. We thank Daniel Corbacho-Monné for his help in preparing the figures.
Author contributions
Study design: all authors; data collection: SM-A, CH; data analysis: SM-A, LC-M, EC, DB; writing: EC, DB, WMA, with contributions from the other authors.
Conflicts of interest
The collection and interpretation of data about the Ecosystem Services for Poverty Alleviation programme that has funded this research and appears in the article, has been conducted independently and objectively. We have been free to analyse the programme's academic outputs, and have not shared the manuscript of this paper with programme managers prior to submission. William M. Adams is an Oryx Senior Editor.
Ethical standards
This research was approved by the Ethics Committee on Animal and Human Research of the Universitat Autònoma de Barcelona, and otherwise abided by the Oryx guidelines on ethical standards. Data underlying the study are third-party data downloaded from the Web of Science database. The curriculum vitae of the studied authors were obtained through their institutional or personal public websites, and in a few cases they were requested by e-mail and obtained with consent.


 Open access