





1. Introduction
Deciphering boiling in liquids has been pursued for decades through both experimental and theoretical analysis aimed at quantifying heat transfer and the dynamics of nucleated bubbles (Zhang et al. Reference Zhang2023). The motivation is clear: boiling is technologically pivotal across scales and sectors, from nuclear power plants (Wu et al. Reference Wu, Luo, Wang, Hou, Su, Tian and Qiu2018) to next-generation thermal management in high-power-density microelectronics (Cho et al. Reference Cho, Preston, Zhu and Wang2016; Jones et al. Reference Jones2018; Fan & Duan Reference Fan and Duan2020). While the macroscopic behaviour of fully formed bubble populations is comparatively well understood (Georgoulas et al. Reference Georgoulas, Koukouvinis, Gavaises and Marengo2015; Abbondanza et al. Reference Abbondanza, Gallo and Casciola2023a ; Abbondanza, Gallo & Casciola Reference Abbondanza, Gallo and Casciola2024; Darshan, Magnini & Matar Reference Darshan, Magnini and Matar2024), what happens before bubbles appear – i.e. the incipient stages that trigger nucleation and set the subsequent dynamics – remains a compelling open question. This knowledge gap lies between atomistic and continuum descriptions of fluids (Lohse & Prosperetti Reference Lohse and Prosperetti2016), precisely where phase change emerges and organises. In practice, the seemingly simple question ‘at what temperature does a liquid boil under constant pressure?’ has a surprisingly complex answer. Experiments show that the onset temperature depends on both the imposed heat flux – faster heating leads to higher boiling temperatures – and the surface chemistry, with hydrophobic substrates nucleating earlier than hydrophilic ones (Bourdon et al. Reference Bourdon, Bertrand, Di Marco, Marengo, Rioboo and De Coninck2015). These two trends can be rationalised physically: higher heat fluxes shorten the time available for rare nucleation events to occur, while hydrophilic walls increase the free-energy cost of bubble formation. However, such effects are very difficult to incorporate in conventional hydrodynamic (continuum) models in an operational and predictive manner, where the liquid to vapour phase-change threshold is empirically identified, and the system is initialised with pre-existing embryos of the new phase (Chakraborty et al. Reference Chakraborty, Gallo, Marengo, De Coninck, Casciola, Miche and Georgoulas2024). These approaches have a limited predictability of boiling processes since they cannot establish the proper thermodynamic conditions at which phase change starts to take place. This atomistic feature can be captured by molecular dynamics (Menzl et al. Reference Menzl, Gonzalez, Geiger, Caupin, Abascal, Valeriani and Dellago2016), but for computational reasons, it leaves unexplored the mesoscale window (from nanometres to microns) where critical aspects of the transformation unfold. Mesoscale models therefore provide a natural framework for investigating these phenomena. Such models aim to capture the emergent behaviour originating at the microscopic (granular) scale, and to transport it to larger scales through appropriately constructed free-energy functionals, which in turn form the basis for both deterministic and stochastic extensions out of equilibrium. On the deterministic side, diffuse-interface models of the van der Waals type have proven capable of accurately describing single-component two-phase systems (Anderson, McFadden & Wheeler Reference Anderson, McFadden and Wheeler1998; Espanol Reference Espanol2001; Onuki Reference Onuki2005) as well as multicomponent mixtures (Liu, Amberg & Do-Quang Reference Liu, Amberg and Do-Quang2016; Mukherjee & Gomez Reference Mukherjee and Gomez2022; Benilov Reference Benilov2023) across a wide range of problems, from the dynamics of cavitation bubbles (Magaletti et al. Reference Magaletti, Marino and Casciola2015b , Reference Magaletti, Gallo, Marino and Casciola2016; Hu, Wang & Gomez Reference Hu, Wang and Gomez2023) to boiling (Laurila et al. Reference Laurila, Carlson, Do-Quang, Ala-Nissila and Amberg2012; Lombard, Biben & Merabia Reference Lombard, Biben and Merabia2015) and condensation (Benilov Reference Benilov2024). Within the mesoscale modelling of multiphase systems, the lattice Boltzmann method has also emerged as a powerful approach. Rooted in a kinetic description of fluids, it operates at an intermediate level between microscopic particle methods and macroscopic continuum equations (Swift et al. Reference Swift, Orlandini, Osborn and Yeomans1996; Benzi et al. Reference Benzi, Biferale, Sbragaglia, Succi and Toschi2006; Sbragaglia et al. Reference Sbragaglia, Chen, Shan and Succi2009; Falcucci et al. Reference Falcucci, Ubertini, Biscarini, Di Francesco, Chiappini, Palpacelli, De Maio and Succi2011; Biferale et al. Reference Biferale, Perlekar, Sbragaglia and Toschi2012). However, mesoscale models intended to describe phase change must also incorporate thermal fluctuations, which are ultimately responsible for the activated nature of the phase-change process.
The theory of fluctuating hydrodynamics (FHD) provides a systematic framework to account for such effects. Originally proposed by Landau on phenomenological grounds, it was later given a proper microscopic foundation through coarse-graining procedures and projection-operator techniques à la Zwanzig (Zubarev & Morozov Reference Zubarev and Morozov1983; Español et al. Reference Español, Anero and Zúñiga2009).
Over the years, this formalism has been extended to multiphase settings, including diffuse-interface models (Chaudhri et al. Reference Chaudhri, Bell, Garcia and Donev2014; Gallo et al. Reference Gallo, Magaletti and Casciola2018b ) and phase-field formulations (Barker, Bell & Garcia Reference Barker, Bell and Garcia2023; Bell et al. Reference Bell, Nonaka and Garcia2025a , Reference Bell, Nonaka and Garciab ), and has also been incorporated within lattice Boltzmann approaches (Lulli et al. Reference Lulli, Biferale, Falcucci, Sbragaglia, Yang and Shan2024). In this context, ensuring thermodynamic consistency between the prescribed free-energy functional, the dissipative structure of the equations, and the statistics of the stochastic forcing is essential in order to recover the correct Einstein–Boltzmann equilibrium distribution and, consequently, physically meaningful phase-change pathways (Gallo et al. Reference Gallo, Occhioni, Daniele and Casciola2026). Multiphase FHD has been employed to investigate equilibrium and near-equilibrium properties of complex fluids, including the measurement of static structure factors and quench-induced spinodal decomposition from supercritical states (Chaudhri et al. Reference Chaudhri, Bell, Garcia and Donev2014), as well as the estimation of critical exponents and phase separation (Lulli et al. Reference Lulli, Biferale, Falcucci, Sbragaglia, Yang and Shan2024). Some of these authors have further applied this framework to cavitation phenomena, both in quiescent conditions (Gallo et al. Reference Gallo, Magaletti and Casciola2018b , Reference Gallo, Magaletti and Casciola2021) and in flowing liquids (Couette flow) (Gallo & Casciola Reference Gallo and Casciola2024). In these earlier studies, nucleation was typically analysed by preparing the system in an initially metastable state, such as a liquid under tension, and allowing thermal fluctuations to trigger the transition following a quasi-equilibrium approach. In such settings, the metastable basin is well defined, and the activation process can be interpreted as a fluctuation-driven escape governed primarily by the underlying free-energy or quasi-potential landscape. In the context of boiling, however, the situation is intrinsically more complex. A liquid initially at saturation is subjected to rapid heating and therefore follows a strongly non-equilibrium path through a progressively increasing metastability. The evolution results from the competition between deterministic thermal forcing and stochastic fluctuations, with a strong and non-trivial coupling to heat transfer. In a recent study (Gallo et al. Reference Gallo, Magaletti, Georgoulas, Marengo, De Coninck and Casciola2023), we demonstrated that stochastic thermal fluctuations, together with sparse defects on structured hydrophobic/hydrophilic surfaces, are essential to reproduce key macroscopic boiling observables. In particular, even small patches of hydrophobic material, when combined with thermal noise, can significantly accelerate boiling onset in a manner that is highly sensitive and difficult to control, possibly explaining the experimental ambiguity of boiling onset. These findings have opened the way towards a fluctuation-consistent description of boiling far from equilibrium, and have highlighted the effectiveness of FHD as a predictive framework for nucleation processes under strongly non-equilibrium conditions.
Building on this foundation, in this work, we combine large-scale FHD direct simulations with rare-event analysis to chart the complete liquid-to-vapour transformation, from the earliest nucleation inception to bubble growth and interactions. By performing simulations over spatially extended domains, we access system sizes that are large enough to obtain robust spatial statistics. Our approach quantifies the temporal evolution of the probability distributions of temperature and density fields, revealing an unprecedented statistical description of non-equilibrium phase change. At the same time, it resolves the hydrodynamic fields that mediate bubble growth and interaction. We further gain access to valuable information that can be transferred to macroscopic models that do not explicitly resolve nucleation. This includes nucleation times, the formation of microscopic vapour films, and the statistical distribution of nucleation events. Finally, we focus on the role of wettability, and characterise different nucleation pathways by computing the minimum free-energy paths (MFEPs) through rare-event techniques. Although these techniques rely on quasi-equilibrium constructions, they provide a powerful interpretative framework for the inherently non-equilibrium dynamics observed in boiling. The results align with both experimental observations and molecular dynamics benchmarks – across equilibrium features (such as wettability effects on boiling) and non-equilibrium dynamical scalings of boiling (onset dependence on heating rate and bubble dynamics) – thereby unifying diverse pieces of evidence into a coherent picture. Altogether, we advance a predictive framework for the incipient stages of phase change and their subsequent evolution, also providing a consistent energetic interpretation of nucleation and growth dynamics. By closing a crucial mesoscale gap, this enables principled multiscale strategies for boiling simulations and thermal system design.
2. Methodology
2.1. Fluctuating hydrodynamics
The mesoscale model that we employ to investigate the boiling process of a fluid initially at saturation (stable equilibrium), and subsequently heated at constant pressure into a metastable state, combines the Landau–Lifshitz–Navier–Stokes equations with diffuse-interface thermodynamics (Gallo, Magaletti & Casciola Reference Gallo, Magaletti and Casciola2021):
 \begin{align} \frac {\partial \rho }{\partial t} + \boldsymbol{\nabla } \boldsymbol{\cdot }(\rho \boldsymbol{v}) = 0 , \\[-28pt] \nonumber \end{align}
 \begin{align} \frac {\partial \rho \boldsymbol{v}}{\partial t} + \boldsymbol{\nabla } \boldsymbol{\cdot }(\rho \boldsymbol{v} \otimes \boldsymbol{v}) = \boldsymbol{\nabla } \boldsymbol{\cdot }\boldsymbol{\varSigma } + \boldsymbol{\nabla }\boldsymbol{\cdot } \delta \boldsymbol{\varSigma } , \\[-28pt] \nonumber \end{align}
 \begin{align} \frac {\partial E}{\partial t} + \boldsymbol{\nabla } \boldsymbol{\cdot }(\boldsymbol{v} E) = \boldsymbol{\nabla } \boldsymbol{\cdot }[\left (\boldsymbol{\varSigma } + \delta \boldsymbol{\varSigma }\right )\boldsymbol{\cdot }\boldsymbol{v} - \boldsymbol{q} + \delta \boldsymbol{q}], \\[0pt] \nonumber \end{align}
where $\rho (\boldsymbol{x}, t)$
is the mass density,
$\rho (\boldsymbol{x}, t)$
is the mass density, $\boldsymbol{v}(\boldsymbol{x}, t)$
is the velocity field, and
$\boldsymbol{v}(\boldsymbol{x}, t)$
is the velocity field, and $E(\boldsymbol{x}, t)$
is the total energy density, defined as
$E(\boldsymbol{x}, t)$
is the total energy density, defined as
 \begin{equation} E=u_b(\rho , T)+\frac {1}{2} \rho\, |\boldsymbol{v}|^{2} + \frac {\lambda }{2} |\boldsymbol{\nabla } \rho |^{2}. \end{equation}
Here, $u_b(\rho , T)$
is the bulk internal energy density,
$u_b(\rho , T)$
is the bulk internal energy density, $T(\boldsymbol{x}, t)$
is the temperature, and
$T(\boldsymbol{x}, t)$
is the temperature, and $\lambda$
is the capillary coefficient. In this framework, the balance equations for mass, momentum and energy are augmented by stochastic fluxes that account for thermal fluctuations arising from the granular nature of matter, as well as by capillary contributions that modify the structure of both the stress tensor and the heat flux.
$\lambda$
is the capillary coefficient. In this framework, the balance equations for mass, momentum and energy are augmented by stochastic fluxes that account for thermal fluctuations arising from the granular nature of matter, as well as by capillary contributions that modify the structure of both the stress tensor and the heat flux.
The deterministic stress tensor and energy flux (Anderson et al. Reference Anderson, McFadden and Wheeler1998; Magaletti et al. Reference Magaletti, Gallo, Marino and Casciola2016; Giovangigli Reference Giovangigli2020) are
 \begin{align} \boldsymbol{{\varSigma }} = \left [ -p + \frac {\lambda }{2}\, \vert \boldsymbol{\boldsymbol{\nabla }}\!\rho \vert ^2 + \rho \boldsymbol{\boldsymbol{\nabla }}\boldsymbol{\cdot }(\lambda\, \boldsymbol{\boldsymbol{\nabla }}\!\rho )\right ]& \boldsymbol{I} - \lambda\, \boldsymbol{\boldsymbol{\nabla }}\!\rho \otimes \boldsymbol{\boldsymbol{\nabla }}\!\rho +\eta _1(\boldsymbol{\boldsymbol{\nabla }}\boldsymbol{v} + \boldsymbol{\boldsymbol{\nabla }}\boldsymbol{v}^{\rm T}) + \eta _2\, \boldsymbol{\boldsymbol{\nabla }}\boldsymbol{\cdot }\boldsymbol{v}\boldsymbol{I}, \\[-12pt]\nonumber \end{align}
 \begin{align} \boldsymbol{q} =& \lambda \rho\, \boldsymbol{\boldsymbol{\nabla }}\!\rho\, \boldsymbol{\boldsymbol{\nabla }}\boldsymbol{\cdot }\boldsymbol{v} - k\, \boldsymbol{\boldsymbol{\nabla }} T , \end{align}
where $p(\rho , T)$
is the bulk pressure,
$p(\rho , T)$
is the bulk pressure, $\boldsymbol{I}$
is the identity matrix,
$\boldsymbol{I}$
is the identity matrix, $\eta _1(\rho , T)$
and
$\eta _1(\rho , T)$
and $ \eta _2(\rho , T)$
are the viscosity coefficients,
$ \eta _2(\rho , T)$
are the viscosity coefficients, $\eta_2 = \eta_v - ({2}/{3}) \eta_1$
, with
$\eta_2 = \eta_v - ({2}/{3}) \eta_1$
, with $\eta_1$
the shear viscosity and
$\eta_1$
the shear viscosity and $\eta_v$
the bulk viscosity, and
$\eta_v$
the bulk viscosity, and $k(\rho , T)$
is the thermal conductivity.
$k(\rho , T)$
is the thermal conductivity.
The stochastic fluxes (Chaudhri et al. Reference Chaudhri, Bell, Garcia and Donev2014; Gallo et al. Reference Gallo, Magaletti and Casciola2021) are Gaussian processes with zero mean and correlation:
 \begin{align} \langle \delta \boldsymbol{\varSigma }(\hat {\boldsymbol{x}},\hat {t})\otimes \delta \boldsymbol{\varSigma }^\dagger (\tilde {\boldsymbol{x}},\tilde {t}) \rangle = \boldsymbol{Q^\varSigma }\delta (\hat {\boldsymbol{x}}-\tilde {\boldsymbol{x}}) \delta (\hat {t}-\tilde {t}), \\[-28pt] \nonumber \end{align}
 \begin{align} \langle \delta \boldsymbol{q}(\hat {\boldsymbol{x}},\hat {t}) \otimes \delta \boldsymbol{q}^\dagger (\tilde {\boldsymbol{x}},\tilde {t})\rangle = \boldsymbol{Q^q}\,\delta (\hat {\boldsymbol{x}}-\tilde {\boldsymbol{x}})\, \delta (\hat {t}-\tilde {t}) , \\[0pt] \nonumber \end{align}
where $\delta (\boldsymbol{x})$
and
$\delta (\boldsymbol{x})$
and $\delta (t)$
are the spatial and temporal Dirac delta functions, respectively,
$\delta (t)$
are the spatial and temporal Dirac delta functions, respectively, $\dagger$
denotes the Hermitian adjoint and
$\dagger$
denotes the Hermitian adjoint and
 \begin{align} \boldsymbol{Q^\varSigma }_{\alpha \beta \nu \eta } =& 2{{k}}_B T \left [\eta _1( \delta _{\alpha \nu }\delta _{\beta \eta }+\delta _{\alpha \eta }\delta _{\beta \nu }) + \eta _2\delta _{\alpha \beta }\delta _{\nu \eta } \right ]\!, \\[-12pt]\nonumber \end{align}
 \begin{align} &\qquad \boldsymbol{Q^q}_{\alpha \beta } = 2{{k}}_B T^2 k\delta _{\alpha \beta } , \\[10pt] \nonumber \end{align}
for ${{k}}_B$
the Boltzmann constant, and
${{k}}_B$
the Boltzmann constant, and $\delta _{\alpha \beta }$
the Kronecker delta symbol. The noise amplitudes follow from the fluctuation–dissipation theorem, which ensures that the hydrodynamic description reproduces the equilibrium fluctuations of the underlying molecular system, consistent with the Einstein–Boltzmann distribution. Their intensity is directly determined by the transport coefficients, such as viscosity and thermal conductivity, reflecting the fundamental link between dissipation and spontaneous fluctuations in statistical mechanics (Kubo Reference Kubo1966). When in contact with a solid wall, the boundary condition for the mass density of the fluid is related to the fluid–solid wettability (Gallo et al. Reference Gallo, Magaletti and Casciola2021),
$\delta _{\alpha \beta }$
the Kronecker delta symbol. The noise amplitudes follow from the fluctuation–dissipation theorem, which ensures that the hydrodynamic description reproduces the equilibrium fluctuations of the underlying molecular system, consistent with the Einstein–Boltzmann distribution. Their intensity is directly determined by the transport coefficients, such as viscosity and thermal conductivity, reflecting the fundamental link between dissipation and spontaneous fluctuations in statistical mechanics (Kubo Reference Kubo1966). When in contact with a solid wall, the boundary condition for the mass density of the fluid is related to the fluid–solid wettability (Gallo et al. Reference Gallo, Magaletti and Casciola2021),
 \begin{equation} \lambda\, \boldsymbol{\nabla } \rho \boldsymbol{\cdot }\hat {\boldsymbol{n}} = \cos \phi\, \sqrt {2 \lambda \left (\omega _b\left ({\rho }, T\right ) - \omega _b\left (\rho _V^{\textit{sat}}\right )\right )}, \end{equation}
where $\phi$
is the Young contact angle,
$\phi$
is the Young contact angle, $\omega _b(\rho , T) = f_b - \rho (\partial f_b/\partial \rho )_{\textit{sat}}$
and
$\omega _b(\rho , T) = f_b - \rho (\partial f_b/\partial \rho )_{\textit{sat}}$
and $f_b(\rho , T)$
are the Landau and Helmholtz bulk free-energy densities, respectively,
$f_b(\rho , T)$
are the Landau and Helmholtz bulk free-energy densities, respectively, $\hat {\boldsymbol{n}}$
is the unit normal vector, and the quantities labelled ‘sat’ refer to saturation values; see § 3. The bulk energies
$\hat {\boldsymbol{n}}$
is the unit normal vector, and the quantities labelled ‘sat’ refer to saturation values; see § 3. The bulk energies $u_b, f_b, \omega _b$
and the pressure
$u_b, f_b, \omega _b$
and the pressure $p$
, as well as the surface tension, are identified by a proper equation of state (EoS) (Benilov Reference Benilov2020; Magaletti, Gallo & Casciola Reference Magaletti, Gallo and Casciola2021). These equations are very robust for describing the dynamics of bubbles. In fact, in the deterministic limit, they can reproduce the Rayleigh–Plesset behaviour and cavitation dynamics (Magaletti et al. Reference Magaletti, Gallo, Marino and Casciola2015a
,
Reference Magaletti, Marino and Casciolab
; Abbondanza et al. Reference Abbondanza, Gallo and Casciola2023b
), as well as the Hertz–Knudsen scaling (Benilov Reference Benilov2024) for the condensation of a planar interface. Beyond the deterministic limit, FHD provides a physically consistent framework that links thermal fluctuations to macroscopic fluid behaviour (Chaudhri et al. Reference Chaudhri, Bell, Garcia and Donev2014; Donev, Fai & Vanden-Eijnden Reference Donev, Fai and Vanden-Eijnden2014; Gallo et al. Reference Gallo, Magaletti and Casciola2018a
; Magaletti, Georgoulas & Marengo Reference Magaletti, Georgoulas and Marengo2020; Bandak et al. Reference Bandak, Goldenfeld, Mailybaev and Eyink2022; Bell et al. Reference Bell, Nonaka, Garcia and Eyink2022; Eyink & Jafari Reference Eyink and Jafari2022, Reference Eyink and Jafari2024; Barker et al. Reference Barker, Bell and Garcia2023; Bussoletti et al. Reference Bussoletti, Gallo, Jafari and Eyink2025, Reference Bussoletti, Gallo, Jafari and Eyink2026; Teodori et al. Reference Teodori, Abbondanza, Gallo and Casciola2025). It is therefore particularly well suited to investigate systems in which slow macroscopic (hydrodynamic) modes are intertwined with fast microscopic dynamics (atomistic fluctuations), as occurs in phase-change phenomena, especially under non-equilibrium conditions.
$p$
, as well as the surface tension, are identified by a proper equation of state (EoS) (Benilov Reference Benilov2020; Magaletti, Gallo & Casciola Reference Magaletti, Gallo and Casciola2021). These equations are very robust for describing the dynamics of bubbles. In fact, in the deterministic limit, they can reproduce the Rayleigh–Plesset behaviour and cavitation dynamics (Magaletti et al. Reference Magaletti, Gallo, Marino and Casciola2015a
,
Reference Magaletti, Marino and Casciolab
; Abbondanza et al. Reference Abbondanza, Gallo and Casciola2023b
), as well as the Hertz–Knudsen scaling (Benilov Reference Benilov2024) for the condensation of a planar interface. Beyond the deterministic limit, FHD provides a physically consistent framework that links thermal fluctuations to macroscopic fluid behaviour (Chaudhri et al. Reference Chaudhri, Bell, Garcia and Donev2014; Donev, Fai & Vanden-Eijnden Reference Donev, Fai and Vanden-Eijnden2014; Gallo et al. Reference Gallo, Magaletti and Casciola2018a
; Magaletti, Georgoulas & Marengo Reference Magaletti, Georgoulas and Marengo2020; Bandak et al. Reference Bandak, Goldenfeld, Mailybaev and Eyink2022; Bell et al. Reference Bell, Nonaka, Garcia and Eyink2022; Eyink & Jafari Reference Eyink and Jafari2022, Reference Eyink and Jafari2024; Barker et al. Reference Barker, Bell and Garcia2023; Bussoletti et al. Reference Bussoletti, Gallo, Jafari and Eyink2025, Reference Bussoletti, Gallo, Jafari and Eyink2026; Teodori et al. Reference Teodori, Abbondanza, Gallo and Casciola2025). It is therefore particularly well suited to investigate systems in which slow macroscopic (hydrodynamic) modes are intertwined with fast microscopic dynamics (atomistic fluctuations), as occurs in phase-change phenomena, especially under non-equilibrium conditions.
Here, the system (2.1)–(2.3) is closed through the van der Waals EoS relating the thermodynamic potentials, e.g. free-energy densities or pressure, to the density and temperature fields. In particular, keeping the same notation, we rewrite both $p$
and
$p$
and $u_b$
in reduced variables by normalising pressure, temperature and density by their corresponding critical values
$u_b$
in reduced variables by normalising pressure, temperature and density by their corresponding critical values $p_c$
,
$p_c$
, $T_c$
and
$T_c$
and $\rho _c$
, while the critical pressure normalises the internal energy density:
$\rho _c$
, while the critical pressure normalises the internal energy density: $p = 8\rho T/(3-\rho ) - 3\rho ^{2}$
,
$p = 8\rho T/(3-\rho ) - 3\rho ^{2}$
, $u_b = 8\rho /(3\delta ) T - 3\rho ^{2}$
. Here,
$u_b = 8\rho /(3\delta ) T - 3\rho ^{2}$
. Here, $ \delta = 0.112$
is chosen to recover the specific heat for water.
$ \delta = 0.112$
is chosen to recover the specific heat for water.
2.2. The FHD simulations
The equations are integrated numerically with boundary conditions representative of the boiling configuration, as shown in figure 1.
Sketch of the computational set-up. The computational domain is a cubic box with side length $L$
. A constant heat flux is imposed at the bottom (
$L$
. A constant heat flux is imposed at the bottom ( $z=0$
) solid wall together with the proper wettability conditions. At the top boundary (
$z=0$
) solid wall together with the proper wettability conditions. At the top boundary ( $z=L$
), pressure and temperature are fixed to the saturation values. Periodic conditions are imposed on the lateral boundaries of the domain.
$z=L$
), pressure and temperature are fixed to the saturation values. Periodic conditions are imposed on the lateral boundaries of the domain.

All simulations are performed in a cubic domain of side length $L$
, discretised into uniform cubic cells of volume
$L$
, discretised into uniform cubic cells of volume $\varDelta ^3$
, so that
$\varDelta ^3$
, so that $L^3 = N_c \varDelta ^3$
, where
$L^3 = N_c \varDelta ^3$
, where $N_c$
is the total number of grid cells. In the present case,
$N_c$
is the total number of grid cells. In the present case, $L = 2.25 \,{\unicode{x03BC}}\mathrm{m}$
and
$L = 2.25 \,{\unicode{x03BC}}\mathrm{m}$
and $N_c = 500^3$
. The vertical coordinate
$N_c = 500^3$
. The vertical coordinate $\boldsymbol{z}$
is oriented normal to the wall, with
$\boldsymbol{z}$
is oriented normal to the wall, with $z=0$
corresponding to the heated surface in contact with the solid rigid wall, and
$z=0$
corresponding to the heated surface in contact with the solid rigid wall, and $z=L$
to the top boundary of the domain. The other two directions,
$z=L$
to the top boundary of the domain. The other two directions, $\boldsymbol{x}$
and
$\boldsymbol{x}$
and $\boldsymbol{y}$
, are parallel to the wall, and periodic boundary conditions are imposed.
$\boldsymbol{y}$
, are parallel to the wall, and periodic boundary conditions are imposed.
In pool boiling, the fluid far from the wall is maintained at saturation conditions; therefore, pressure and temperature are prescribed at the top boundary. On the wall, a constant heat flux is imposed, i.e. $ -\boldsymbol{q}\boldsymbol{\cdot }\boldsymbol{z} = Q$
. No-slip and impermeable boundary conditions are applied to the velocity field at the wall. The normal derivative of the density satisfies the solid–fluid boundary condition discussed above. At the top boundary (
$ -\boldsymbol{q}\boldsymbol{\cdot }\boldsymbol{z} = Q$
. No-slip and impermeable boundary conditions are applied to the velocity field at the wall. The normal derivative of the density satisfies the solid–fluid boundary condition discussed above. At the top boundary ( $z=L$
), non-reflecting conditions are enforced to prevent spurious reflection of pressure waves (Poinsot & Lele Reference Poinsot and Lele1992; Delgado-Buscalioni & Dejoan Reference Delgado-Buscalioni and Dejoan2008). The numerical scheme follows Gallo et al. (Reference Gallo, Magaletti and Casciola2018b
) and employs a staggered finite differences discretisation with second-order spatial accuracy and a second-order Runge–Kutta time integrator. Due to the staggering of the discretisation, values of temperature and density at the wall – identified by the subscript ‘wall’ in § 3 – are extrapolated from the closest computational cell consistently with the imposed boundary conditions.
$z=L$
), non-reflecting conditions are enforced to prevent spurious reflection of pressure waves (Poinsot & Lele Reference Poinsot and Lele1992; Delgado-Buscalioni & Dejoan Reference Delgado-Buscalioni and Dejoan2008). The numerical scheme follows Gallo et al. (Reference Gallo, Magaletti and Casciola2018b
) and employs a staggered finite differences discretisation with second-order spatial accuracy and a second-order Runge–Kutta time integrator. Due to the staggering of the discretisation, values of temperature and density at the wall – identified by the subscript ‘wall’ in § 3 – are extrapolated from the closest computational cell consistently with the imposed boundary conditions.
2.3. The MFEP and string method
The system (2.1)–(2.3) provides a stochastic hydrodynamic description of the non-equilibrium evolution of a heated phase-changing fluid. In this framework, bubble nucleation emerges as a rare event driven by thermal fluctuations and coupled to the underlying hydrodynamic fields. A natural first step towards rationalising this process is to adopt a purely thermodynamic viewpoint, in which nucleation is interpreted as a fluctuation that drives the system across a free-energy barrier separating the metastable liquid from the stable vapour phase. Within this quasi-static picture, the central quantity is the free-energy cost of forming a critical nucleus. This is identified by the saddle point of an appropriate constrained functional, thereby prescribing the transition pathway. However, boiling is inherently a dynamical, out-of-equilibrium phenomenon. In this context, rare transitions are more fundamentally described in terms of the probability of entire trajectories, which is governed by a dynamical action, for instance within the Freidlin–Wentzell or Onsager–Machlup formalism (Grafke, Grauer & Schäfer Reference Grafke, Grauer and Schäfer2015; Zakine & Vanden-Eijnden Reference Zakine and Vanden-Eijnden2023; Gallo et al. Reference Gallo, Occhioni, Daniele and Casciola2026). Extending such a large-deviation framework to the fully non-isothermal FHD of (2.1)–(2.3) remains, however, a formidable theoretical and computational challenge. For this reason, as a first step, we resort to a free-energy-based description that, despite its quasi-equilibrium character, is expected to retain key features of the incipient phase-change process. As will be shown in § 3, this approach correctly predicts the existence of a critical nucleus, captures the scaling of nucleation barriers, and provides a consistent energetic interpretation of the transition pathways observed in our FHD simulations, as well as in recent molecular dynamics studies (Zou, Gupta & Maroo Reference Zou, Gupta and Maroo2018; Sullivan, Dockar & Pillai Reference Sullivan, Dockar and Pillai2025). Within this framework, the thermodynamic evolution of the heated liquid is interpreted as a sequence of quasi-equilibrium states of a Landau free-energy functional, each defined by contact with a reservoir imposing fixed temperature and chemical potential. In this grand-canonical setting, we evaluate, for each state, both the energetic cost associated with bubble formation and an approximation of the corresponding most probable transition pathway.
The Landau free energy of the mesoscale liquid–vapour system is modelled using the van der Waals squared-gradient approximation,
 \begin{equation} \varOmega [\rho ] = \int _{\mathcal{V}} \left ( f_b(\rho ) + \frac {\lambda }{2}\, |\boldsymbol{\nabla }\rho |^2 - \mu _{\textit{ext}} \rho \right ) {\rm d}V + \int _{\mathcal{A}} f_w(\rho ) \, {\rm d}A , \end{equation}
where $\mathcal{V}$
and
$\mathcal{V}$
and $\mathcal{A}$
indicate the domain and the bottom solid wall, respectively,
$\mathcal{A}$
indicate the domain and the bottom solid wall, respectively, $\mu _{\textit{ext}}$
denotes the equilibrium chemical potential, and
$\mu _{\textit{ext}}$
denotes the equilibrium chemical potential, and $f_w(\rho )$
is the wall free-energy contribution,
$f_w(\rho )$
is the wall free-energy contribution,
 \begin{equation} f_w(\rho ) = -\cos (\phi ) \int _{\rho _V^{\textit{sat}}}^\rho \sqrt {2 \lambda \left (\omega _b\left ({\rho }, T\right ) - \omega _b\left (\rho _V^{\textit{sat}}\right )\right )} + f_w(\rho _V^{\textit{sat}}) , \end{equation}
with $\rho _V^{\textit{sat}}$
the vapour density at saturation (Gallo et al. Reference Gallo, Magaletti and Casciola2021).
$\rho _V^{\textit{sat}}$
the vapour density at saturation (Gallo et al. Reference Gallo, Magaletti and Casciola2021).
Although originally introduced on phenomenological grounds, this functional can now be derived within rigorous statistical-mechanical frameworks (Espanol Reference Espanol2001; Lutsko Reference Lutsko2011). It is worth noting that the functional derivative of the energy in (2.12), $\delta \varOmega /\delta \rho = \mu - \mu _{\textit{ext}}$
, which represents the driving force of the system (i.e. the chemical potential difference), also appears in the non-equilibrium dynamics (2.1)–(2.3); this is because the reversible part of the stress tensor
$\delta \varOmega /\delta \rho = \mu - \mu _{\textit{ext}}$
, which represents the driving force of the system (i.e. the chemical potential difference), also appears in the non-equilibrium dynamics (2.1)–(2.3); this is because the reversible part of the stress tensor
 \begin{align} \varSigma _{{rev}} = \left [ -p + \frac {\lambda }{2}\, \vert \boldsymbol{\boldsymbol{\nabla }}\!\rho \vert ^2 + \rho \boldsymbol{\boldsymbol{\nabla }}\boldsymbol{\cdot }(\lambda\, \boldsymbol{\boldsymbol{\nabla }}\!\rho )\right ] \boldsymbol{I} - \lambda\, \boldsymbol{\boldsymbol{\nabla }}\!\rho \otimes \boldsymbol{\boldsymbol{\nabla }}\!\rho \end{align}
obeys
 \begin{align} \boldsymbol{\nabla }\boldsymbol{\cdot }\varSigma _{{rev}} = -\rho\, \boldsymbol{\nabla } \left (\frac {\delta \varOmega }{\delta \rho } \right ) \end{align}
at constant temperature; see Abbondanza et al. (Reference Abbondanza, Gallo and Casciola2024) for further details.
The metastable homogeneous liquid and the stable vapour phase correspond to local minima of $\varOmega [\rho ]$
. The transition between these states is represented by a path composed of a sequence of density fields. Assuming that the evolution is effectively dominated by the free-energy gradient, this sequence defines an MFEP, which provides an approximation of the most probable transition pathway for a thermally fluctuating system (Gallo et al. Reference Gallo, Occhioni, Magaletti and Casciola2025). In the present case, the MFEP describes the nucleation of a vapour bubble on a flat solid wall.
$\varOmega [\rho ]$
. The transition between these states is represented by a path composed of a sequence of density fields. Assuming that the evolution is effectively dominated by the free-energy gradient, this sequence defines an MFEP, which provides an approximation of the most probable transition pathway for a thermally fluctuating system (Gallo et al. Reference Gallo, Occhioni, Magaletti and Casciola2025). In the present case, the MFEP describes the nucleation of a vapour bubble on a flat solid wall.
The MFEP is the sequence of fields $\rho (s,\boldsymbol{x})$
, where
$\rho (s,\boldsymbol{x})$
, where $s$
is a parametrisation variable that labels the configurations along the path satisfying
$s$
is a parametrisation variable that labels the configurations along the path satisfying
 \begin{equation} \left (\frac {\delta \varOmega }{\delta \rho } \right )^{\perp }\left [\rho (s,\boldsymbol{x})\right ] = 0 , \end{equation}
for the orthogonal projection of the functional derivative, and can be efficiently computed using the string method (E et al. Reference E, Ren and Vanden-Eijnden2007).
2.4. MFEP simulations
Following the string method, the path is discretised into a finite set of fields $\rho ^s(\boldsymbol{x})$
, referred to as images, where the index
$\rho ^s(\boldsymbol{x})$
, referred to as images, where the index $s$
labels the configurations along the path. These images evolve in a fictitious (pseudo-)time
$s$
labels the configurations along the path. These images evolve in a fictitious (pseudo-)time $\tilde {t}$
according to
$\tilde {t}$
according to
 \begin{equation} \frac {\partial \rho ^s}{\partial {\tilde {t}}} = \mu _{\textit{eq}} - \mu (\rho ^s) + \lambda\, {\nabla} ^2 \rho ^s \,. \end{equation}
The equations are discretised on a staggered grid in axisymmetric geometry, and integrated in pseudo-time using a forward-Euler scheme. After each iteration, the images are redistributed along the path to enforce a uniform arc length parametrisation (E et al. Reference E, Ren and Vanden-Eijnden2007),
 \begin{equation} \delta s = \left \| \rho ^{s+1}(\boldsymbol{x}) - \rho ^{s}(\boldsymbol{x}) \right \|_{L^2} = \text{constant} , \end{equation}
where $\|{\cdot }\|_{L^2}$
denotes the
$\|{\cdot }\|_{L^2}$
denotes the $L^2$
-norm. The evolution and redistribution steps are iterated until convergence, identified by the stationarity of the free-energy profile
$L^2$
-norm. The evolution and redistribution steps are iterated until convergence, identified by the stationarity of the free-energy profile $\varOmega (s)$
. The resulting string connects the metastable liquid state at
$\varOmega (s)$
. The resulting string connects the metastable liquid state at $s=0$
to the vapour state at
$s=0$
to the vapour state at $s=1$
.
$s=1$
.
To minimise any bias associated with the initialisation of the path, two complementary simulation campaigns are performed. In the first, the string is initialised using MFEPs obtained at $\phi = 90^\circ$
, corresponding to a heterogeneous nucleation bias. In the second, initial conditions are taken from MFEPs at
$\phi = 90^\circ$
, corresponding to a heterogeneous nucleation bias. In the second, initial conditions are taken from MFEPs at $\phi = 0^\circ$
, corresponding to a homogeneous nucleation bias. For each configuration, the solution with the lowest free-energy barrier is retained, and the nucleation mechanism is subsequently classified as homogeneous or heterogeneous based on the structure of the critical bubble. All simulations employ 200 images, spatial resolution
$\phi = 0^\circ$
, corresponding to a homogeneous nucleation bias. For each configuration, the solution with the lowest free-energy barrier is retained, and the nucleation mechanism is subsequently classified as homogeneous or heterogeneous based on the structure of the critical bubble. All simulations employ 200 images, spatial resolution $\varDelta ^2 = 1$
on a domain of size
$\varDelta ^2 = 1$
on a domain of size $L^2 = 100^2$
, and a pseudo-time step
$L^2 = 100^2$
, and a pseudo-time step $\Delta \tilde {t} = 0.01$
. The initial stages of the path are further refined through Allen–Cahn relaxation (Bottacchiari et al. Reference Bottacchiari, Gallo, Bussoletti and Casciola2022, Reference Bottacchiari, Gallo, Bussoletti and Casciola2024).
$\Delta \tilde {t} = 0.01$
. The initial stages of the path are further refined through Allen–Cahn relaxation (Bottacchiari et al. Reference Bottacchiari, Gallo, Bussoletti and Casciola2022, Reference Bottacchiari, Gallo, Bussoletti and Casciola2024).
2.5. Reference quantities for the numerical simulations
All quantities reported in the text and figures are dimensionless, scaled by the reduced van der Waals variables. Taking water as reference, the critical temperature, pressure and density are $T_c = 647\,\text{K}$
,
$T_c = 647\,\text{K}$
, $p_c = 22\,\text{MPa}$
and
$p_c = 22\,\text{MPa}$
and $\rho _c = 196.8\,\rm{kg\,m}^{-3}$
, respectively. The corresponding reference scales are
$\rho _c = 196.8\,\rm{kg\,m}^{-3}$
, respectively. The corresponding reference scales are $L_R = (k_B T_c / p_c)^{1/3} = 0.74\,\text{nm}$
for length,
$L_R = (k_B T_c / p_c)^{1/3} = 0.74\,\text{nm}$
for length, $u_R = (p_c/\rho _c)^{1/2} = 334.8\,\rm{m\,s}^{-1}$
for velocity,
$u_R = (p_c/\rho _c)^{1/2} = 334.8\,\rm{m\,s}^{-1}$
for velocity, $t_R = L_R/u_R = 2.21\,\text{ps}$
for time, and
$t_R = L_R/u_R = 2.21\,\text{ps}$
for time, and $q_R = p_c u_R = 7.56\,\rm{GW\,m}^{-2}$
for heat flux.
$q_R = p_c u_R = 7.56\,\rm{GW\,m}^{-2}$
for heat flux.
The capillary coefficient is set to $\lambda = 5.3\times 10^{-16}\ \text{m}^7\ \text{s}^{-2}\ \text{kg}^{-1}$
, ensuring the correct surface tension of water (
$\lambda = 5.3\times 10^{-16}\ \text{m}^7\ \text{s}^{-2}\ \text{kg}^{-1}$
, ensuring the correct surface tension of water ( $\sigma = 0.072\,\rm{N\,m}^{-1}$
) at ambient conditions (
$\sigma = 0.072\,\rm{N\,m}^{-1}$
) at ambient conditions ( $T \sim 300$
K). This choice yields a liquid–vapour interface thickness at ambient conditions of approximately
$T \sim 300$
K). This choice yields a liquid–vapour interface thickness at ambient conditions of approximately $\epsilon \sim 1.3\,\text{nm}$
, in agreement with experimental measurements (Caupin Reference Caupin2005). In the present case, the higher temperature
$\epsilon \sim 1.3\,\text{nm}$
, in agreement with experimental measurements (Caupin Reference Caupin2005). In the present case, the higher temperature $T\simeq 0.95{-}0.96$
leads to a broader, mean field interface
$T\simeq 0.95{-}0.96$
leads to a broader, mean field interface $\epsilon \sim 5.0{-}6.0\ \text{nm}$
, and a reduced surface tension
$\epsilon \sim 5.0{-}6.0\ \text{nm}$
, and a reduced surface tension $\sigma \simeq 0.002\,\rm{N\,m}^{-1}$
. The transport properties, namely the viscosities
$\sigma \simeq 0.002\,\rm{N\,m}^{-1}$
. The transport properties, namely the viscosities $\eta _1,\,\eta _2(\rho ,T)$
and the thermal conductivity
$\eta _1,\,\eta _2(\rho ,T)$
and the thermal conductivity $k(\rho ,T)$
, are taken from the correlations of the International Association for the Properties of Water and Steam (Kestin et al. Reference Kestin, Sengers, Kamgar-Parsi and Levelt Sengers1984).
$k(\rho ,T)$
, are taken from the correlations of the International Association for the Properties of Water and Steam (Kestin et al. Reference Kestin, Sengers, Kamgar-Parsi and Levelt Sengers1984).
3. Results
The FHD equations presented in § 2 were numerically solved to elucidate the boiling process of a liquid initially at saturation conditions and subsequently heated at constant pressure. All results are presented in non-dimensional form, as detailed in § 2.
The initial liquid state corresponds to a (statistical) thermodynamic equilibrium, where thermal fluctuations are consistent with the Einstein–Boltzmann distribution (De Zarate & Sengers Reference De Zarate and Sengers2006). The average, initial values are $\langle \rho \rangle = \rho _L^{\textit{sat}}$
,
$\langle \rho \rangle = \rho _L^{\textit{sat}}$
, $\langle T \rangle = T_{\textit{sat}}$
and
$\langle T \rangle = T_{\textit{sat}}$
and $\langle \boldsymbol{v} \rangle = \boldsymbol{0}$
. As the liquid is progressively heated, it enters a metastable state in which the probability of vapour bubble nucleation increases with temperature, until the spinodal limit is reached, where phase change occurs spontaneously and without an energy barrier. The saturation conditions at fixed temperature
$\langle \boldsymbol{v} \rangle = \boldsymbol{0}$
. As the liquid is progressively heated, it enters a metastable state in which the probability of vapour bubble nucleation increases with temperature, until the spinodal limit is reached, where phase change occurs spontaneously and without an energy barrier. The saturation conditions at fixed temperature $T_{\textit{sat}}$
are determined by imposing equality of the chemical potentials and of the pressures,
$T_{\textit{sat}}$
are determined by imposing equality of the chemical potentials and of the pressures, $\mu (\rho _L^{\textit{sat}}, T_{\textit{sat}}) = \mu (\rho _V^{\textit{sat}}, T_{\textit{sat}})$
,
$\mu (\rho _L^{\textit{sat}}, T_{\textit{sat}}) = \mu (\rho _V^{\textit{sat}}, T_{\textit{sat}})$
, $ p(\rho _L^{\textit{sat}}, T_{\textit{sat}}) = p(\rho _V^{\textit{sat}}, T_{\textit{sat}})$
, through the van der Waals EoS. These two conditions uniquely determine the liquid and vapour saturation densities
$ p(\rho _L^{\textit{sat}}, T_{\textit{sat}}) = p(\rho _V^{\textit{sat}}, T_{\textit{sat}})$
, through the van der Waals EoS. These two conditions uniquely determine the liquid and vapour saturation densities $\rho _L^{\textit{sat}}$
and
$\rho _L^{\textit{sat}}$
and $\rho _V^{\textit{sat}}$
. The spinodal temperature
$\rho _V^{\textit{sat}}$
. The spinodal temperature $T_{\textit{spin}}$
is defined as the temperature at which the pressure equals the saturation pressure,
$T_{\textit{spin}}$
is defined as the temperature at which the pressure equals the saturation pressure, $p(\rho _L^{{spin}},T_{\textit{spin}}) = p_{\textit{sat}}(T_{\textit{sat}})$
, where the spinodal considered here is that of the liquid phase, characterised by the condition
$p(\rho _L^{{spin}},T_{\textit{spin}}) = p_{\textit{sat}}(T_{\textit{sat}})$
, where the spinodal considered here is that of the liquid phase, characterised by the condition $( {\partial p}/{\partial \rho }) |_T = 0.$
In the present case, the saturation and spinodal temperatures are
$( {\partial p}/{\partial \rho }) |_T = 0.$
In the present case, the saturation and spinodal temperatures are $T_{\textit{sat}} = 0.95$
and
$T_{\textit{sat}} = 0.95$
and $T_{\textit{spin}} = 0.9625$
, respectively, while the saturation pressure is
$T_{\textit{spin}} = 0.9625$
, respectively, while the saturation pressure is $p_{\textit{sat}} = 0.8119$
, and
$p_{\textit{sat}} = 0.8119$
, and $\rho _{\textit{sat}}^L = 1.46471$
. The intensity of the heat flux clearly sets the typical time scale for the appearance of the first bubbles. For the majority of the brute-force simulations presented here, we adopted a heat flux
$\rho _{\textit{sat}}^L = 1.46471$
. The intensity of the heat flux clearly sets the typical time scale for the appearance of the first bubbles. For the majority of the brute-force simulations presented here, we adopted a heat flux $Q = 0.01$
(in reduced units), which yields nucleation on numerically affordable time scales. Additionally, we varied
$Q = 0.01$
(in reduced units), which yields nucleation on numerically affordable time scales. Additionally, we varied $Q$
to investigate the dependence of the onset nucleation temperature and time on the heating rate – an intrinsically non-equilibrium feature of considerable physical interest. By introducing the reduced temperature
$Q$
to investigate the dependence of the onset nucleation temperature and time on the heating rate – an intrinsically non-equilibrium feature of considerable physical interest. By introducing the reduced temperature $\varTheta = (T-T_{\textit{sat}})/(T_{\textit{spin}} - T_{\textit{sat}})$
, we have that
$\varTheta = (T-T_{\textit{sat}})/(T_{\textit{spin}} - T_{\textit{sat}})$
, we have that $\varTheta \to 0$
corresponds to a liquid saturation with zero probability of nucleating a bubble; on the other hand,
$\varTheta \to 0$
corresponds to a liquid saturation with zero probability of nucleating a bubble; on the other hand, $\varTheta \to 1$
means spinodal conditions with spontaneous phase transition. This variable is a suitable descriptor of the process, as it provides a quantitative measure of liquid superheating up to the thermodynamic spinodal limit.
$\varTheta \to 1$
means spinodal conditions with spontaneous phase transition. This variable is a suitable descriptor of the process, as it provides a quantitative measure of liquid superheating up to the thermodynamic spinodal limit.
(a) Simulation snapshots of vapour bubble nucleation and dynamics for contact angle $\phi = 0^\circ$
. Times are indicated above each frame. The upper contour plots display the density field at the wall, while the lower plots present a three-dimensional zoom with isosurfaces at the critical density
$\phi = 0^\circ$
. Times are indicated above each frame. The upper contour plots display the density field at the wall, while the lower plots present a three-dimensional zoom with isosurfaces at the critical density $\rho (\boldsymbol{x}, t) = 1$
. (b) Contour plots displaying the density field at the wall for different contact angles at the onset stage. (c) The same quantities as in (a) for contact angle
$\rho (\boldsymbol{x}, t) = 1$
. (b) Contour plots displaying the density field at the wall for different contact angles at the onset stage. (c) The same quantities as in (a) for contact angle $\phi = 90^\circ$
.
$\phi = 90^\circ$
.

Figure 2 shows representative snapshots of the numerical simulations for different contact angles. Figure 2(a) reports the case of a wall with contact angle $\phi = 0^\circ$
(completely wettable), while figure 2(c) corresponds to the neutral case with
$\phi = 0^\circ$
(completely wettable), while figure 2(c) corresponds to the neutral case with $\phi = 90^\circ$
. The main difference lies in the nucleation mechanism. In the neutral case, nucleation initiates directly at the wall, following a more canonical boiling mechanism, whereas in the hydrophilic case, vapour bubbles nucleate within the liquid bulk, yet in proximity to the wall. In figure 2(a), the selected time instants illustrate the characteristic stages of the boiling process. The evolution of the wall temperature – and its link to the snapshots – is more clearly interpreted in figure 3(a). The stage at
$\phi = 90^\circ$
. The main difference lies in the nucleation mechanism. In the neutral case, nucleation initiates directly at the wall, following a more canonical boiling mechanism, whereas in the hydrophilic case, vapour bubbles nucleate within the liquid bulk, yet in proximity to the wall. In figure 2(a), the selected time instants illustrate the characteristic stages of the boiling process. The evolution of the wall temperature – and its link to the snapshots – is more clearly interpreted in figure 3(a). The stage at $t = 3000$
marks a typical time where bubbles form and grow, reaching the nucleation regime where the wall temperature attains its maximum, the boiling onset. Starting from this stage, the latent heat extraction exceeds the heat supplied by the surface, leading to a subsequent temperature drop towards its minimum at
$t = 3000$
marks a typical time where bubbles form and grow, reaching the nucleation regime where the wall temperature attains its maximum, the boiling onset. Starting from this stage, the latent heat extraction exceeds the heat supplied by the surface, leading to a subsequent temperature drop towards its minimum at $t = t_{\textit{min}}$
. After the phase transformation is completed and a continuous vapour film forms at the wall, the temperature rises again, as heat transfer becomes dominated by conduction across the vapour layer. Here, the minimum of the temperature curve corresponds to the instant at which the latent heat extracted by the phase change balances the externally imposed heat input. As anticipated, when
$t = t_{\textit{min}}$
. After the phase transformation is completed and a continuous vapour film forms at the wall, the temperature rises again, as heat transfer becomes dominated by conduction across the vapour layer. Here, the minimum of the temperature curve corresponds to the instant at which the latent heat extracted by the phase change balances the externally imposed heat input. As anticipated, when $\phi = 0^\circ$
, bubbles nucleate in the liquid close to the wall but not in direct contact with it; indeed, the wall-density contour plots show no coherent vapour structure beyond thermal fluctuations. Supercritical bubbles expand and later attach to the surface, where they continue to grow, coalesce, and eventually form a vapour nanofilm. This indicates the presence of a liquid nanolayer separating the bubbles from the solid wall. In fact, this liquid nanolayer was previously observed in molecular dynamics simulations (Zou et al. Reference Zou, Gupta and Maroo2018; Sullivan et al. Reference Sullivan, Dockar and Pillai2025), but to the best of our knowledge never reported in continuum boiling due to the intrinsic limitations of deterministic hydrodynamics, which cannot capture nucleation. Figure 2(b) reports the density fields at the wall for intermediate contact angles (from
$\phi = 0^\circ$
, bubbles nucleate in the liquid close to the wall but not in direct contact with it; indeed, the wall-density contour plots show no coherent vapour structure beyond thermal fluctuations. Supercritical bubbles expand and later attach to the surface, where they continue to grow, coalesce, and eventually form a vapour nanofilm. This indicates the presence of a liquid nanolayer separating the bubbles from the solid wall. In fact, this liquid nanolayer was previously observed in molecular dynamics simulations (Zou et al. Reference Zou, Gupta and Maroo2018; Sullivan et al. Reference Sullivan, Dockar and Pillai2025), but to the best of our knowledge never reported in continuum boiling due to the intrinsic limitations of deterministic hydrodynamics, which cannot capture nucleation. Figure 2(b) reports the density fields at the wall for intermediate contact angles (from $30^\circ$
to
$30^\circ$
to $75^\circ$
) at the boiling onset. One can observe that as the contact angle decreases, the number of bubbles nucleating at the wall decreases as well, and the system transitions to different nucleation mechanisms, approaching homogeneous nucleation for highly hydrophilic wettability conditions. This peculiar behaviour will be further analysed using the string rare-event technique later in this section.
$75^\circ$
) at the boiling onset. One can observe that as the contact angle decreases, the number of bubbles nucleating at the wall decreases as well, and the system transitions to different nucleation mechanisms, approaching homogeneous nucleation for highly hydrophilic wettability conditions. This peculiar behaviour will be further analysed using the string rare-event technique later in this section.
(a) Mean reduced wall temperature $\langle \varTheta _{w\textit{all}}\rangle$
as a function of time. Blue and yellow lines correspond to
$\langle \varTheta _{w\textit{all}}\rangle$
as a function of time. Blue and yellow lines correspond to $\phi = 0^\circ$
and
$\phi = 0^\circ$
and $\phi = 90^\circ$
, respectively. (b) On the left-hand axis, reduced onset temperature
$\phi = 90^\circ$
, respectively. (b) On the left-hand axis, reduced onset temperature $\varTheta _{\textit{ons}}=\langle \varTheta _{w\textit{all}}\rangle |_{t_{\textit{ons}}}$
as a function of the contact angle
$\varTheta _{\textit{ons}}=\langle \varTheta _{w\textit{all}}\rangle |_{t_{\textit{ons}}}$
as a function of the contact angle $\phi$
(blue line with squares). On the right-hand axis, time to reach onset
$\phi$
(blue line with squares). On the right-hand axis, time to reach onset $t_{\textit{ons}}$
(green line with circles), and time to reach the post-onset minimum temperature
$t_{\textit{ons}}$
(green line with circles), and time to reach the post-onset minimum temperature $t_{\textit{min}}$
(yellow line with triangles). (c) Number of nucleated bubbles at the boiling onset as a function of the distance from the wall,
$t_{\textit{min}}$
(yellow line with triangles). (c) Number of nucleated bubbles at the boiling onset as a function of the distance from the wall, $z$
. From left to right, contact angles
$z$
. From left to right, contact angles $\phi = 0^\circ$
,
$\phi = 0^\circ$
, $45^\circ$
and
$45^\circ$
and $90^\circ$
. (d) Probability distribution of the normalised wall Voronoi cell areas
$90^\circ$
. (d) Probability distribution of the normalised wall Voronoi cell areas $p(\alpha )$
at the boiling onset. Symbols refer to numerical simulations for different contact angles, while the dashed curve represents the PDF for an RPPP. The inset depicts the variance (symbols) and the comparison with the theoretical expectation (dashed line). (e) Reduced onset temperature
$p(\alpha )$
at the boiling onset. Symbols refer to numerical simulations for different contact angles, while the dashed curve represents the PDF for an RPPP. The inset depicts the variance (symbols) and the comparison with the theoretical expectation (dashed line). (e) Reduced onset temperature $\varTheta _{\textit{ons}}$
as a function of the heat flux
$\varTheta _{\textit{ons}}$
as a function of the heat flux $Q$
on the left-hand axis (blue line with squares) and time to reach onset
$Q$
on the left-hand axis (blue line with squares) and time to reach onset $t_{\textit{ons}}$
on the right-hand axis (green line with circles); the data refer to the case
$t_{\textit{ons}}$
on the right-hand axis (green line with circles); the data refer to the case $\phi = 90^\circ$
.
$\phi = 90^\circ$
.

Figure 3(a) reports the temporal evolution of the mean reduced wall temperature $\langle \varTheta _{w\textit{all}}\rangle$
for
$\langle \varTheta _{w\textit{all}}\rangle$
for $\phi = 0^\circ$
(blue) and
$\phi = 0^\circ$
(blue) and $\phi = 90^\circ$
(yellow). The two characteristic points are highlighted: the first local maximum (onset) and the subsequent local minimum (post-onset minimum). The onset temperature
$\phi = 90^\circ$
(yellow). The two characteristic points are highlighted: the first local maximum (onset) and the subsequent local minimum (post-onset minimum). The onset temperature $\varTheta _{\textit{ons}}$
, defined as the mean reduced wall temperature at the onset, is shown in figure 3(b) (blue squares). It increases with decreasing contact angle, but becomes nearly insensitive to wettability for
$\varTheta _{\textit{ons}}$
, defined as the mean reduced wall temperature at the onset, is shown in figure 3(b) (blue squares). It increases with decreasing contact angle, but becomes nearly insensitive to wettability for $\phi \leqslant 30^\circ$
, where it almost plateaus at
$\phi \leqslant 30^\circ$
, where it almost plateaus at $\varTheta _{\textit{ons}} \simeq 0.95$
. The time to reach onset,
$\varTheta _{\textit{ons}} \simeq 0.95$
. The time to reach onset, $t_{\textit{ons}}$
(green circles), is also reported in figure 3(b). Contrary to the prediction of classical nucleation theory (CNT), which prescribes a strictly increasing nucleation time with decreasing contact angle (Blander & Katz Reference Blander and Katz1975), the simulations exhibit a plateau for
$t_{\textit{ons}}$
(green circles), is also reported in figure 3(b). Contrary to the prediction of classical nucleation theory (CNT), which prescribes a strictly increasing nucleation time with decreasing contact angle (Blander & Katz Reference Blander and Katz1975), the simulations exhibit a plateau for $\phi \leqslant 60^\circ$
, approaching
$\phi \leqslant 60^\circ$
, approaching $t_{\textit{ons}} \simeq 4800$
. This suggests that below a certain wettability threshold, nucleation occurs through a homogeneous mechanism, where bubbles first form near the wall – but not on it – and later reattach during growth, as also observed in macroscopic experiments (Zou et al. Reference Zou, Gupta and Maroo2018), and as will be further discussed below within a quasi-equilibrium framework using rare-event arguments. The time to reach the post-onset minimum
$t_{\textit{ons}} \simeq 4800$
. This suggests that below a certain wettability threshold, nucleation occurs through a homogeneous mechanism, where bubbles first form near the wall – but not on it – and later reattach during growth, as also observed in macroscopic experiments (Zou et al. Reference Zou, Gupta and Maroo2018), and as will be further discussed below within a quasi-equilibrium framework using rare-event arguments. The time to reach the post-onset minimum $t_{\textit{min}}$
(yellow triangles) decreases with increasing
$t_{\textit{min}}$
(yellow triangles) decreases with increasing $\phi$
, but similarly shows no marked dependence once
$\phi$
, but similarly shows no marked dependence once $\phi \leqslant 30^\circ$
, further indicating that strong hydrophilicity suppresses the influence of wall wettability on both onset temperatures and nucleation times. Since the simulation covers sufficiently long times, it is possible to analyse statistics of bubble nucleation positions. It is worth emphasising that the wall is perfectly smooth, with no predefined nucleation sites; hence nucleation events arise exclusively from stochastic fluctuations. A statistical characterisation of their space–time distribution is therefore informative, particularly for macroscale boiling models. Figure 3(c) reports the number of bubbles nucleated at the onset temperature,
$\phi \leqslant 30^\circ$
, further indicating that strong hydrophilicity suppresses the influence of wall wettability on both onset temperatures and nucleation times. Since the simulation covers sufficiently long times, it is possible to analyse statistics of bubble nucleation positions. It is worth emphasising that the wall is perfectly smooth, with no predefined nucleation sites; hence nucleation events arise exclusively from stochastic fluctuations. A statistical characterisation of their space–time distribution is therefore informative, particularly for macroscale boiling models. Figure 3(c) reports the number of bubbles nucleated at the onset temperature, $N_{\textit{bubbles}}$
, as a function of the distance from the wall
$N_{\textit{bubbles}}$
, as a function of the distance from the wall $z$
for three different contact angles:
$z$
for three different contact angles: $\phi =0^\circ$
(left),
$\phi =0^\circ$
(left), $\phi =45^\circ$
(centre) and
$\phi =45^\circ$
(centre) and $\phi =90^\circ$
(right). As shown, in the neutral-wall case (
$\phi =90^\circ$
(right). As shown, in the neutral-wall case ( $\phi =90^\circ$
), essentially all nucleated bubbles are located very close to the wall. For the intermediate wettability case (
$\phi =90^\circ$
), essentially all nucleated bubbles are located very close to the wall. For the intermediate wettability case ( $\phi =45^\circ$
), a lower number of nucleation events is observed, and the distribution becomes broader, extending towards larger distances
$\phi =45^\circ$
), a lower number of nucleation events is observed, and the distribution becomes broader, extending towards larger distances $z$
from the wall where nucleation events are also found. This trend becomes even more pronounced for the fully wetting case (
$z$
from the wall where nucleation events are also found. This trend becomes even more pronounced for the fully wetting case ( $\phi =0^\circ$
), where nucleation preferentially occurs farther from the wall, and the total number of nucleated bubbles is even lower. While the presence of strong fluctuations makes it difficult to precisely reconstruct the earliest stages of nucleation solely from the bubble barycentre, the observed trends clearly indicate a progressive delocalisation of nucleation events as wettability increases. A more refined statistical analysis, possibly combined with dedicated bubble-tracking algorithms, could further clarify these mechanisms in future work.
$\phi =0^\circ$
), where nucleation preferentially occurs farther from the wall, and the total number of nucleated bubbles is even lower. While the presence of strong fluctuations makes it difficult to precisely reconstruct the earliest stages of nucleation solely from the bubble barycentre, the observed trends clearly indicate a progressive delocalisation of nucleation events as wettability increases. A more refined statistical analysis, possibly combined with dedicated bubble-tracking algorithms, could further clarify these mechanisms in future work.
To characterise nucleation on the wall, we deploy Voronoi tessellations (Gallo & Casciola Reference Gallo and Casciola2024) constructed from the centroids of nucleated bubbles. Figure 3(d) reports the probability distribution of the normalised cell areas $\alpha = A_V/\langle A_V \rangle$
, where
$\alpha = A_V/\langle A_V \rangle$
, where $A_V$
is the Voronoi area associated with bubble
$A_V$
is the Voronoi area associated with bubble $i$
. The analysis is performed at the onset for three different contact angles,
$i$
. The analysis is performed at the onset for three different contact angles, $60^\circ$
,
$60^\circ$
, $75^\circ$
and
$75^\circ$
and $90^\circ$
, for which nucleation predominantly occurs at the wall. These distributions are compared with those of a random Poisson point process (RPPP) (Snyder & Miller Reference Snyder and Miller2012), whose probability distribution function (PDF), inferred from large-scale Monte Carlo simulations (Ferenc & Néda Reference Ferenc and Néda2007), is
$90^\circ$
, for which nucleation predominantly occurs at the wall. These distributions are compared with those of a random Poisson point process (RPPP) (Snyder & Miller Reference Snyder and Miller2012), whose probability distribution function (PDF), inferred from large-scale Monte Carlo simulations (Ferenc & Néda Reference Ferenc and Néda2007), is $p(\alpha ) = 343/15\sqrt {7/(2\pi )}\,\alpha ^{5/2}\exp (-7/2 \alpha ).$
Symbols denote the numerical simulations, while the dashed black line represents the RPPP prediction. The excellent agreement is confirmed by the variance (inset), which remains very close to the theoretical value
$p(\alpha ) = 343/15\sqrt {7/(2\pi )}\,\alpha ^{5/2}\exp (-7/2 \alpha ).$
Symbols denote the numerical simulations, while the dashed black line represents the RPPP prediction. The excellent agreement is confirmed by the variance (inset), which remains very close to the theoretical value $\sigma _\alpha = 0.286$
(Ferenc & Néda Reference Ferenc and Néda2007), for all the considered cases. This indicates that bubble nucleation on the wall is spatially uniform and uncorrelated, consistent with an RPPP, even up to the boiling onset. Accordingly, the expected number of nucleation events in a surface region
$\sigma _\alpha = 0.286$
(Ferenc & Néda Reference Ferenc and Néda2007), for all the considered cases. This indicates that bubble nucleation on the wall is spatially uniform and uncorrelated, consistent with an RPPP, even up to the boiling onset. Accordingly, the expected number of nucleation events in a surface region $A_{w\textit{all}}$
during a time interval
$A_{w\textit{all}}$
during a time interval $T$
is
$T$
is $\langle N \rangle = JA_{w\textit{all}}\,T$
, with
$\langle N \rangle = JA_{w\textit{all}}\,T$
, with $J$
the bubble nucleation rate. The probability of observing exactly
$J$
the bubble nucleation rate. The probability of observing exactly $N$
nucleation events follows
$N$
nucleation events follows $ P(n=N) = \langle N \rangle ^N/N!\, \exp {(-\langle N \rangle )}.$
Consequently, once the nucleation rate is available – whether obtained e.g. from FHD simulations or from a nucleation theory – it becomes possible to generate a statistically consistent ensemble of bubbles that captures the essential features of the otherwise elusive nucleation process. Figure 3(e) shows the onset temperature (blue line with squares) as a function of the imposed heat flux intensity, together with the time required to reach it (green line with circles). Depending on the imposed heat flux intensity, the system remains in a metastable state for a time that increases as the heat flux decreases. Consequently, at higher heat fluxes, nucleation is expected to occur at higher temperatures, since the system has progressively less time to develop rare nucleation events. This behaviour highlights the intrinsically non-equilibrium nature of boiling.
$ P(n=N) = \langle N \rangle ^N/N!\, \exp {(-\langle N \rangle )}.$
Consequently, once the nucleation rate is available – whether obtained e.g. from FHD simulations or from a nucleation theory – it becomes possible to generate a statistically consistent ensemble of bubbles that captures the essential features of the otherwise elusive nucleation process. Figure 3(e) shows the onset temperature (blue line with squares) as a function of the imposed heat flux intensity, together with the time required to reach it (green line with circles). Depending on the imposed heat flux intensity, the system remains in a metastable state for a time that increases as the heat flux decreases. Consequently, at higher heat fluxes, nucleation is expected to occur at higher temperatures, since the system has progressively less time to develop rare nucleation events. This behaviour highlights the intrinsically non-equilibrium nature of boiling.
(a) Probability distributions of the wall temperature $p(T_{w\textit{all}})$
in the top panel and the wall density
$p(T_{w\textit{all}})$
in the top panel and the wall density $p(\rho _{w\textit{all}})$
in the bottom panel. Different times during the boiling process are reported. Yellow curves correspond to
$p(\rho _{w\textit{all}})$
in the bottom panel. Different times during the boiling process are reported. Yellow curves correspond to $\phi = 90^\circ$
, while blue curves correspond to
$\phi = 90^\circ$
, while blue curves correspond to $\phi = 0^\circ$
. (b) Evolution of the mean wall temperature
$\phi = 0^\circ$
. (b) Evolution of the mean wall temperature $\langle T _{w\textit{all}}\rangle$
as a function of the mean density
$\langle T _{w\textit{all}}\rangle$
as a function of the mean density $ \bar {\rho }_{w\textit{all}}$
. The yellow curve corresponds to numerical simulations; the green triangles correspond to the density on the isobar
$ \bar {\rho }_{w\textit{all}}$
. The yellow curve corresponds to numerical simulations; the green triangles correspond to the density on the isobar $p = p_{\textit{sat}}$
without accounting for fluctuations (mean field); the red circles include thermal fluctuation corrections.
$p = p_{\textit{sat}}$
without accounting for fluctuations (mean field); the red circles include thermal fluctuation corrections.

Phase change is triggered by thermal fluctuations and mediated by the nonlinear hydrodynamics of the nucleated bubbles. A statistical description is therefore essential. Figure 4(a) shows the PDF of the wall temperature (top) and the density (bottom). The blue line corresponds to the wetting condition with $\phi = 0^\circ$
, while the yellow line refers to
$\phi = 0^\circ$
, while the yellow line refers to $\phi = 90^\circ$
. At
$\phi = 90^\circ$
. At $t = 0$
, the fluid is at equilibrium. The temperature distribution is Gaussian, with variance scaling as
$t = 0$
, the fluid is at equilibrium. The temperature distribution is Gaussian, with variance scaling as $\mathrm{var}(T) \sim k_B T / (\rho _{w\textit{all}} c_v)$
, with
$\mathrm{var}(T) \sim k_B T / (\rho _{w\textit{all}} c_v)$
, with $k_B$
the Boltzmann constant, and
$k_B$
the Boltzmann constant, and $c_v$
the specific heat at constant volume. At later times, the PDFs shift to the right due to an increase in the mean wall temperature, and broaden as vapour formation enhances thermal fluctuations. For the density, a weak asymmetry is already visible at
$c_v$
the specific heat at constant volume. At later times, the PDFs shift to the right due to an increase in the mean wall temperature, and broaden as vapour formation enhances thermal fluctuations. For the density, a weak asymmetry is already visible at $t = 0$
. This arises because at nanometric scales, density fluctuations are sufficiently large to depart from the linear regime.
$t = 0$
. This arises because at nanometric scales, density fluctuations are sufficiently large to depart from the linear regime.
In general, rarefaction events would be more probable than compression, consistent with the scaling $\mathrm{var}(\rho ) \sim k_B T \rho ^2 \beta _T$
, where
$\mathrm{var}(\rho ) \sim k_B T \rho ^2 \beta _T$
, where $\beta _T = 1 / (\rho \,\partial p / \partial \rho )$
denotes the isothermal compressibility. Indeed, the compressibility of the liquid phase is significantly lower under mild compression than under mild rarefaction. However, the hydrophilicity of the wall at
$\beta _T = 1 / (\rho \,\partial p / \partial \rho )$
denotes the isothermal compressibility. Indeed, the compressibility of the liquid phase is significantly lower under mild compression than under mild rarefaction. However, the hydrophilicity of the wall at $\phi =0^\circ$
strongly favours compressed liquid states. As time progresses, nucleation leads to the emergence of heavy tails on the left-hand side of the density PDFs. These tails are more pronounced for the case
$\phi =0^\circ$
strongly favours compressed liquid states. As time progresses, nucleation leads to the emergence of heavy tails on the left-hand side of the density PDFs. These tails are more pronounced for the case $\phi = 90^\circ$
, where a lower activation barrier facilitates nucleation in terms of free energy, and bubbles are nucleating only on the wall (see the discussion on nucleation energetics below). The process then evolves towards a quasi-bimodal distribution, reflecting the coexistence of liquid and vapour regions within the system. Eventually, once the transition to the vapour phase is complete, the PDFs revert to an approximately Gaussian shape. In figure 4(b), we report two macroscopic observables that provide an integrated view of the overall boiling process: the mean wall temperature
$\phi = 90^\circ$
, where a lower activation barrier facilitates nucleation in terms of free energy, and bubbles are nucleating only on the wall (see the discussion on nucleation energetics below). The process then evolves towards a quasi-bimodal distribution, reflecting the coexistence of liquid and vapour regions within the system. Eventually, once the transition to the vapour phase is complete, the PDFs revert to an approximately Gaussian shape. In figure 4(b), we report two macroscopic observables that provide an integrated view of the overall boiling process: the mean wall temperature $\langle T_{w\textit{all}} \rangle$
plotted against the mean wall density
$\langle T_{w\textit{all}} \rangle$
plotted against the mean wall density $\bar {\rho }_{w\textit{all}}$
, at fixed system pressure. In particular,
$\bar {\rho }_{w\textit{all}}$
, at fixed system pressure. In particular, $\langle T_{w\textit{all}} \rangle$
is the numerical average from the FHD results, while
$\langle T_{w\textit{all}} \rangle$
is the numerical average from the FHD results, while $\bar {\rho }_{w\textit{all}}$
is derived in three different ways. The yellow curve represents the numerical results obtained from our FHD simulations,
$\bar {\rho }_{w\textit{all}}$
is derived in three different ways. The yellow curve represents the numerical results obtained from our FHD simulations, $\langle \rho _{w\textit{all}}\rangle$
. The green curve shows the theoretical prediction,
$\langle \rho _{w\textit{all}}\rangle$
. The green curve shows the theoretical prediction, $\rho _{{EoS}}$
, based on the van der Waals EoS, neglecting fluctuations. This amounts to solving
$\rho _{{EoS}}$
, based on the van der Waals EoS, neglecting fluctuations. This amounts to solving $p_{\textit{sat}}=p(\rho _{{EoS}},\langle T_{w\textit{all}}\rangle )$
. The red curve, instead, includes the fluctuation-induced correction proposed in the present work. The predicted mean wall density
$p_{\textit{sat}}=p(\rho _{{EoS}},\langle T_{w\textit{all}}\rangle )$
. The red curve, instead, includes the fluctuation-induced correction proposed in the present work. The predicted mean wall density $\rho _{\textit{EoS+Fluc}}$
is now given by solving
$\rho _{\textit{EoS+Fluc}}$
is now given by solving
 \begin{eqnarray} p_{\textit{sat}}=\langle p_{{Fluc}}\rangle &=& p\left (\rho _{\textit{EoS+Fluc}}, \langle T_{w\textit{all}}\rangle \right ) \nonumber + \frac {1}{2}\,\left .\frac {\partial ^2 p}{\partial \rho ^2}\right |_{(\rho _{\textit{EoS+Fluc}}, \langle T_{w\textit{all}}\rangle )}\, {\mathrm{var}}(\rho _{w\textit{all}}) \\ &&{}+ \frac {1}{2}\,\left .{\frac {\partial ^2 p}{\partial T^2}}\right |_{(\rho _{\textit{EoS+Fluc}}, \langle T_{w\textit{all}}\rangle )}\, {\mathrm{var}}(T_{w\textit{all}}) \, , \end{eqnarray}
which demonstrates that accounting for fluctuations is essential even at the macroscopic level. The value of the field variances has been evaluated as proposed in Gallo (Reference Gallo2022), using $\rho _{\textit{EoS+Fluc}}$
as mean wall density. All theoretical curves terminate at their respective spinodal points, where the function loses its single-valued character.
$\rho _{\textit{EoS+Fluc}}$
as mean wall density. All theoretical curves terminate at their respective spinodal points, where the function loses its single-valued character.
Density profiles along the transition path, showing pre-critical and critical configurations (first two panels from the left), followed by post-critical configurations (last two panels); different contact angles are reported. For $\phi =0^\circ$
,
$\phi =0^\circ$
, $60^\circ$
and
$60^\circ$
and $75^\circ$
, the dark blue shade distinguishes the presence of the compressed liquid nanolayer.
$75^\circ$
, the dark blue shade distinguishes the presence of the compressed liquid nanolayer.

Normalised free-energy barrier $\Delta \varOmega ^\dagger$
as a function of reduced temperature
$\Delta \varOmega ^\dagger$
as a function of reduced temperature $\varTheta$
and contact angle
$\varTheta$
and contact angle $\phi$
. Solid lines represent iso-barrier contours predicted by the string method. Red dashed lines show CNT estimates. Black dashed lines are the CNT correction obtained by rescaling the homogeneous string barrier with the geometric function
$\phi$
. Solid lines represent iso-barrier contours predicted by the string method. Red dashed lines show CNT estimates. Black dashed lines are the CNT correction obtained by rescaling the homogeneous string barrier with the geometric function $\psi (\phi ) = ( {1}/{4})(1 + \cos \phi )^2(2 - \cos \phi )$
. The white line represents the demarcation boundary between the homogeneous and heterogeneous nucleation regimes, with the surrounding band indicating the uncertainty of the analysis in terms of the simulation discretisation
$\psi (\phi ) = ( {1}/{4})(1 + \cos \phi )^2(2 - \cos \phi )$
. The white line represents the demarcation boundary between the homogeneous and heterogeneous nucleation regimes, with the surrounding band indicating the uncertainty of the analysis in terms of the simulation discretisation $\Delta \varTheta$
and
$\Delta \varTheta$
and $\Delta \phi$
.
$\Delta \phi$
.

To interpret the FHD simulations, the most probable nucleation pathways are evaluated under a quasi-equilibrium assumption, allowing estimation of the free-energy barrier $\Delta \varOmega ^\dagger$
from the MFEP; see § 2.3.
$\Delta \varOmega ^\dagger$
from the MFEP; see § 2.3.
We performed $208$
distinct combinations of superheat and contact angle. Specifically, the superheat
$208$
distinct combinations of superheat and contact angle. Specifically, the superheat $\varTheta$
is sampled in the range
$\varTheta$
is sampled in the range $\varTheta = 0.2$
–
$\varTheta = 0.2$
– $0.95$
with increments
$0.95$
with increments $\Delta \varTheta = 0.05$
, while the contact angle spans
$\Delta \varTheta = 0.05$
, while the contact angle spans $\phi = 0^\circ$
–
$\phi = 0^\circ$
– $90^\circ$
with increments
$90^\circ$
with increments $\Delta \phi = 7.5^\circ$
. The resulting energy barriers are then interpolated using cubic splines to obtain smooth contour plots. Owing to the dual initialisation procedure described in § 2.4, the total number of string simulations amounts to
$\Delta \phi = 7.5^\circ$
. The resulting energy barriers are then interpolated using cubic splines to obtain smooth contour plots. Owing to the dual initialisation procedure described in § 2.4, the total number of string simulations amounts to $384$
.
$384$
.
The resulting MFEPs are reported in figure 5. The simulations are performed at the onset conditions identified in the FHD simulations for each wettability, i.e. as if the system were statically and uniformly at the onset temperature as previously defined (see figure 3). For $\phi = 0^\circ$
, strong wall affinity leads to the formation of a liquid nanolayer, and nucleation occurs in the bulk rather than at the wall. This behaviour appears to persist up to contact angles of approximately
$\phi = 0^\circ$
, strong wall affinity leads to the formation of a liquid nanolayer, and nucleation occurs in the bulk rather than at the wall. This behaviour appears to persist up to contact angles of approximately $60^\circ$
. In this regime, the critical bubble emerges close to, but not attached to, the surface, consistent with our FHD results (see figure 2) and molecular dynamics simulations (Zou et al. Reference Zou, Gupta and Maroo2018; Sullivan et al. Reference Sullivan, Dockar and Pillai2025); in later stages, bubbles expand and eventually attach to the wall. On the other hand, when
$60^\circ$
. In this regime, the critical bubble emerges close to, but not attached to, the surface, consistent with our FHD results (see figure 2) and molecular dynamics simulations (Zou et al. Reference Zou, Gupta and Maroo2018; Sullivan et al. Reference Sullivan, Dockar and Pillai2025); in later stages, bubbles expand and eventually attach to the wall. On the other hand, when $\phi = 90^\circ$
, no nanolayer develops due to the boundary condition
$\phi = 90^\circ$
, no nanolayer develops due to the boundary condition $\partial \rho /\partial n = 0$
at the wall, while at
$\partial \rho /\partial n = 0$
at the wall, while at $\phi = 75^\circ$
the effect remains weak and nucleation occurs on the wall. In figure 6, we report the string nucleation free-energy barriers
$\phi = 75^\circ$
the effect remains weak and nucleation occurs on the wall. In figure 6, we report the string nucleation free-energy barriers $\Delta \varOmega ^\dagger$
, normalised by
$\Delta \varOmega ^\dagger$
, normalised by $k_B T$
for different contact angles and degrees of superheating. Iso-energetic curves are superimposed on the colour map as solid black lines to facilitate interpretation. The red curves represent the prediction of (sharp-interface) CNT, which overestimates the barrier, as it does not account for curvature-dependent surface tension effects (e.g. Tolman corrections) and cannot capture the diffuse nature of the interface (Menzl et al. Reference Menzl, Gonzalez, Geiger, Caupin, Abascal, Valeriani and Dellago2016). These effects are instead naturally included in diffuse-interface models (Gallo et al. Reference Gallo, Occhioni, Magaletti and Casciola2025). According to CNT, the heterogeneous barrier is
$k_B T$
for different contact angles and degrees of superheating. Iso-energetic curves are superimposed on the colour map as solid black lines to facilitate interpretation. The red curves represent the prediction of (sharp-interface) CNT, which overestimates the barrier, as it does not account for curvature-dependent surface tension effects (e.g. Tolman corrections) and cannot capture the diffuse nature of the interface (Menzl et al. Reference Menzl, Gonzalez, Geiger, Caupin, Abascal, Valeriani and Dellago2016). These effects are instead naturally included in diffuse-interface models (Gallo et al. Reference Gallo, Occhioni, Magaletti and Casciola2025). According to CNT, the heterogeneous barrier is $\Delta \varOmega _{\textit{CNT}}^\dagger = \psi (\phi )\, \Delta \varOmega _{\textit{CNT}}^{\dagger { {\textit{Hom}}}}$
, with
$\Delta \varOmega _{\textit{CNT}}^\dagger = \psi (\phi )\, \Delta \varOmega _{\textit{CNT}}^{\dagger { {\textit{Hom}}}}$
, with $\psi (\phi ) = ({1}/{4}) (1 + \cos \phi )^2 (2 - \cos \phi )$
, which is strictly decreasing with
$\psi (\phi ) = ({1}/{4}) (1 + \cos \phi )^2 (2 - \cos \phi )$
, which is strictly decreasing with $\phi$
, and approaches the homogeneous limit as
$\phi$
, and approaches the homogeneous limit as $\phi \to 0$
. The CNT also predicts a finite barrier as
$\phi \to 0$
. The CNT also predicts a finite barrier as $\varTheta \to 1$
, a known limitation (Unger & Klein Reference Unger and Klein1984). The CNT predictions deteriorate as metastability increases, as interfacial effects become progressively more pronounced. The dashed black curves, instead, are obtained by rescaling the homogeneous barrier computed via the string method with the function
$\varTheta \to 1$
, a known limitation (Unger & Klein Reference Unger and Klein1984). The CNT predictions deteriorate as metastability increases, as interfacial effects become progressively more pronounced. The dashed black curves, instead, are obtained by rescaling the homogeneous barrier computed via the string method with the function $\psi (\phi )$
. As shown, this scaling – indicative of wall-induced nucleation – works well at low metastability,
$\psi (\phi )$
. As shown, this scaling – indicative of wall-induced nucleation – works well at low metastability, $\varTheta \simeq 0.2$
. However, at higher metastability, i.e. for larger values of
$\varTheta \simeq 0.2$
. However, at higher metastability, i.e. for larger values of $\varTheta$
as in our simulations, clear deviations emerge and the nucleation mechanism changes. Notably, brute-force (molecular dynamics and FHD) simulations are typically performed in this regime. From this analysis, a transition region between different nucleation mechanisms can be identified (white dashed curve), with the surrounding shaded band indicating the uncertainty due to discretisation in
$\varTheta$
as in our simulations, clear deviations emerge and the nucleation mechanism changes. Notably, brute-force (molecular dynamics and FHD) simulations are typically performed in this regime. From this analysis, a transition region between different nucleation mechanisms can be identified (white dashed curve), with the surrounding shaded band indicating the uncertainty due to discretisation in $\Delta \phi$
and
$\Delta \phi$
and $\Delta \varTheta$
. In particular, in the regime explored by our FHD simulations, where
$\Delta \varTheta$
. In particular, in the regime explored by our FHD simulations, where $\varTheta \gtrsim 0.7$
, the predicted mechanism is homogeneous for contact angles
$\varTheta \gtrsim 0.7$
, the predicted mechanism is homogeneous for contact angles $\phi \lesssim 60^\circ$
. This behaviour is consistent with the FHD results, where the time required to observe nucleation becomes approximately independent of
$\phi \lesssim 60^\circ$
. This behaviour is consistent with the FHD results, where the time required to observe nucleation becomes approximately independent of $\phi$
for contact angles below approximately
$\phi$
for contact angles below approximately $60^\circ$
, suggesting that homogeneous nucleation becomes the dominant mechanism in this regime (see figure 3
b). As such, nucleation times are expected to be governed by the most probable nucleation pathways. However, it is important to note that when the energy barriers associated with different nucleation pathways are comparable, as in the intermediate wettability regime, nucleation may occur via both mechanisms with different probabilities. These probabilities are controlled not only by the barrier heights, but also by configurational factors and the density of available nucleation sites. In particular, bulk nucleation scales with the system volume, whereas wall nucleation scales with the surface area, leading to different prefactors in the associated transition rates. This explains why both mechanisms are observed in the FHD simulations at intermediate wettabilities, as is evident from figure 3(c). A more quantitative assessment would require rare-event sampling at finite temperature (i.e. in the presence of finite noise), in order to properly capture the competition between pathways. This is currently under investigation and will be the subject of future work.
$60^\circ$
, suggesting that homogeneous nucleation becomes the dominant mechanism in this regime (see figure 3
b). As such, nucleation times are expected to be governed by the most probable nucleation pathways. However, it is important to note that when the energy barriers associated with different nucleation pathways are comparable, as in the intermediate wettability regime, nucleation may occur via both mechanisms with different probabilities. These probabilities are controlled not only by the barrier heights, but also by configurational factors and the density of available nucleation sites. In particular, bulk nucleation scales with the system volume, whereas wall nucleation scales with the surface area, leading to different prefactors in the associated transition rates. This explains why both mechanisms are observed in the FHD simulations at intermediate wettabilities, as is evident from figure 3(c). A more quantitative assessment would require rare-event sampling at finite temperature (i.e. in the presence of finite noise), in order to properly capture the competition between pathways. This is currently under investigation and will be the subject of future work.
Probability distribution of bubble contact areas on the wall, $p(\mathrm{Area})$
. Blue circles represent simulation data for
$p(\mathrm{Area})$
. Blue circles represent simulation data for $\phi =90^\circ$
, while dashed lines correspond to fitted PDFs. The simulation times at which the distributions are computed are indicated above each plot.
$\phi =90^\circ$
, while dashed lines correspond to fitted PDFs. The simulation times at which the distributions are computed are indicated above each plot.

The onset temperature, as defined in the dynamic simulations, depends not only on nucleation but also on heat transfer with the surrounding fluid and hydrodynamic interactions. Similarly, the formation of the vapour film is influenced by the same mechanisms, and both the onset temperature and the associated time scales retain a residual, albeit weaker, dependence on the contact angle even below $60^\circ$
. For instance, bubbles tend to nucleate close to the wall and locally cool the nearby region, although not exactly at the wall. Therefore, the onset cannot be interpreted purely in terms of energetics.
$60^\circ$
. For instance, bubbles tend to nucleate close to the wall and locally cool the nearby region, although not exactly at the wall. Therefore, the onset cannot be interpreted purely in terms of energetics.
As a final analysis, the PDFs of the bubble–wall contact areas during the entire phase transition are examined in figure 7. In the nucleation stage (top left panel), the PDF exhibits an exponential tail. Indeed, the probability of observing a bubble of subcritical radius $R$
scales as
$R$
scales as $p(R) \sim \exp (-\Delta \varOmega (R)/k_B T)$
, with
$p(R) \sim \exp (-\Delta \varOmega (R)/k_B T)$
, with $\Delta \varOmega \sim R^2$
(Menzl et al. Reference Menzl, Gonzalez, Geiger, Caupin, Abascal, Valeriani and Dellago2016). After nucleation, the bubble growth dynamics becomes governed by hydrodynamic interactions and phase-change kinetics, and the PDFs develop scale-free behaviour characterised by power-law tails,
$\Delta \varOmega \sim R^2$
(Menzl et al. Reference Menzl, Gonzalez, Geiger, Caupin, Abascal, Valeriani and Dellago2016). After nucleation, the bubble growth dynamics becomes governed by hydrodynamic interactions and phase-change kinetics, and the PDFs develop scale-free behaviour characterised by power-law tails, $p\sim A^{-\gamma }$
. This emerges from collective amplification, coalescence and merging events, reflecting the absence of a characteristic length scale during intermediate stages. The critical exponent
$p\sim A^{-\gamma }$
. This emerges from collective amplification, coalescence and merging events, reflecting the absence of a characteristic length scale during intermediate stages. The critical exponent $\gamma$
evolves over time and remains consistent with values reported in macroscopic boiling experiments (Zhang, Seong & Bucci Reference Zhang, Seong and Bucci2019). After the exponential regime, the first power-law stage yields exponents in the range
$\gamma$
evolves over time and remains consistent with values reported in macroscopic boiling experiments (Zhang, Seong & Bucci Reference Zhang, Seong and Bucci2019). After the exponential regime, the first power-law stage yields exponents in the range $\gamma \simeq -2.81$
to
$\gamma \simeq -2.81$
to $-2.09$
. Beyond the boiling onset, the scaling becomes shallower, with average exponent
$-2.09$
. Beyond the boiling onset, the scaling becomes shallower, with average exponent $\gamma \simeq -1.87$
, in good agreement with the experimentally reported post-critical values
$\gamma \simeq -1.87$
, in good agreement with the experimentally reported post-critical values $\gamma \simeq -1.85$
and
$\gamma \simeq -1.85$
and $-1.50$
(Zhang et al. Reference Zhang, Seong and Bucci2019). At later times, a noticeable bump emerges beyond the power-law regime, indicating the formation of large vapour clusters whose lateral extent becomes comparable to the system size, preceding film formation. Such behaviour – also interpreted in Zhang et al. (Reference Zhang, Seong and Bucci2019) as a percolation-driven transition – signals the onset of spatial connectivity and near-critical cluster coalescence. It is worth noting that although the applied heat flux (
$-1.50$
(Zhang et al. Reference Zhang, Seong and Bucci2019). At later times, a noticeable bump emerges beyond the power-law regime, indicating the formation of large vapour clusters whose lateral extent becomes comparable to the system size, preceding film formation. Such behaviour – also interpreted in Zhang et al. (Reference Zhang, Seong and Bucci2019) as a percolation-driven transition – signals the onset of spatial connectivity and near-critical cluster coalescence. It is worth noting that although the applied heat flux ( $Q = 0.01$
,
$Q = 0.01$
, $\sim 70\,\mathrm{MW\,m^{-2}}$
) lies well within the boiling crisis regime, the incipient nucleation stage still displays an exponential behaviour with spatially uniform events. Because the system under consideration operates at the mesoscale (with dimensions of a few microns) and involves an ideally smooth wall, the observed scale-free dynamics cannot be attributed to surface roughness or chemical heterogeneities. These effects, while inevitable in macroscopic boiling experiments, are absent here. The emergence of scale-free behaviour must therefore originate from the intrinsic multiphase hydrodynamics of the system itself. At the same time, the nucleation process – still experimentally inaccessible – retains canonical exponential statistics, even under boiling-crisis conditions. This separation of behaviours indicates that supercritical boiling is characterised by an initial nucleation stage whose statistical properties are remarkably similar to those observed in pre-critical boiling, while the subsequent dynamics follows a markedly different, scale-free regime.
$\sim 70\,\mathrm{MW\,m^{-2}}$
) lies well within the boiling crisis regime, the incipient nucleation stage still displays an exponential behaviour with spatially uniform events. Because the system under consideration operates at the mesoscale (with dimensions of a few microns) and involves an ideally smooth wall, the observed scale-free dynamics cannot be attributed to surface roughness or chemical heterogeneities. These effects, while inevitable in macroscopic boiling experiments, are absent here. The emergence of scale-free behaviour must therefore originate from the intrinsic multiphase hydrodynamics of the system itself. At the same time, the nucleation process – still experimentally inaccessible – retains canonical exponential statistics, even under boiling-crisis conditions. This separation of behaviours indicates that supercritical boiling is characterised by an initial nucleation stage whose statistical properties are remarkably similar to those observed in pre-critical boiling, while the subsequent dynamics follows a markedly different, scale-free regime.
4. Discussion
This work combines high-performance computing and mesoscale fluctuating hydrodynamics (FHD) to provide a comprehensive statistical picture of boiling as a thermally activated, intrinsically non-equilibrium process. In this framework, macroscopic observables emerge from the interplay between thermal fluctuations – responsible for triggering nucleation – and hydrodynamics, which governs bubble growth, interactions and scaling laws. Despite operating at the mesoscale ( $\simeq 10\,{\unicode{x03BC}} \mathrm{m}^3$
), the simulations reproduce microscopic nucleation features – such as the formation of a liquid nanolayer as well as the dependence of the boiling onset and the dominant nucleation mechanism on wall wettability – that are typically observed only in molecular dynamics (Zou et al. Reference Zou, Gupta and Maroo2018; Sullivan et al. Reference Sullivan, Dockar and Pillai2025) and are inaccessible to classical continuum theories. These behaviours can still be interpreted within a rare-event framework based on free-energy landscapes. Moreover, the simulations recover the experimentally observed transition from an early exponential regime of contact areas to a post-critical power-law scaling, with critical exponents matching macroscopic measurements. This establishes a quantitative bridge between microscopic nucleation mechanisms and the emergent macroscopic boiling dynamics.
$\simeq 10\,{\unicode{x03BC}} \mathrm{m}^3$
), the simulations reproduce microscopic nucleation features – such as the formation of a liquid nanolayer as well as the dependence of the boiling onset and the dominant nucleation mechanism on wall wettability – that are typically observed only in molecular dynamics (Zou et al. Reference Zou, Gupta and Maroo2018; Sullivan et al. Reference Sullivan, Dockar and Pillai2025) and are inaccessible to classical continuum theories. These behaviours can still be interpreted within a rare-event framework based on free-energy landscapes. Moreover, the simulations recover the experimentally observed transition from an early exponential regime of contact areas to a post-critical power-law scaling, with critical exponents matching macroscopic measurements. This establishes a quantitative bridge between microscopic nucleation mechanisms and the emergent macroscopic boiling dynamics.
Beyond resolving fundamental questions, our results pave the way for multiscale modelling strategies: the computed onset superheats and spatial statistics of bubble nucleation (captured e.g. by an RPPP) can be directly passed to macroscopic solvers. This opens the long-sought route to bridging fluctuation-driven nucleation with continuum-scale boiling simulations.
Overall, the present results demonstrate that FHD, combined with a diffuse-interface description, provides a consistent framework to capture the full nucleation pathway of fluids, bridging mesoscopic statistical thermodynamics and hydrodynamics within a unified description. While the present study focuses on regimes close to the critical point, where the approach is most naturally justified (Langer & Turski Reference Langer and Turski1973), such thermodynamic conditions are not merely academic but are also relevant to engineering applications, e.g. in pressurised water reactors operating at reduced temperatures $T \simeq 0.9$
and reduced pressures
$T \simeq 0.9$
and reduced pressures $p \simeq 0.8$
, as well as in cryogenic and high-pressure systems.
$p \simeq 0.8$
, as well as in cryogenic and high-pressure systems.
More broadly, the framework is expected to remain valid away from criticality when complemented by rare-event techniques to access otherwise inaccessible activation regimes. The coupling between rare events and hydrodynamics, however, is intrinsically challenging; initial steps in this direction have been undertaken by the present authors in the homogeneous case, showing encouraging agreement with experiments for boiling at lower reduced temperatures (Gallo et al. Reference Gallo, Occhioni, Daniele and Casciola2026). Although demonstrated here for an ideal van der Waals type fluid, the framework provides a natural starting point for extensions towards more realistic thermodynamic descriptions through the adoption of accurate equations of state (Wagner & Pruß Reference Wagner and Pruß2002; Kunz & Wagner Reference Kunz and Wagner2012). When combined with modern high-performance computing capabilities, this approach has the potential to enable direct simulations spanning mesoscopic scales, and to progressively capture the full boiling physics, from nucleation to macroscopic bubble dynamics, opening new perspectives for the modelling of phase-change phenomena.
From a fundamental standpoint, our findings also motivate theoretical developments in non-equilibrium statistical mechanics. By framing boiling as a fluctuation-activated process mediated by hydrodynamics, this work points to new avenues for understanding phase transitions beyond the limits of classical equilibrium thermodynamics.
Acknowledgements
The authors thank C.M. Casciola, G. Eyink, F. Magaletti, S. Kalliadasis, P. Yatsyshin, M. Marengo, A. Georgoulas, F. Li, Z. Lu and J. De Coninck for valuable discussions related to this work.
Funding
This work was supported by the European Research Council (ERC) through the Starting Grant E-Nucl. (grant agreement no. 101163330). Computational resources were provided through the CINECA award under the ISCRA initiative (ISCRA-B D-RESIN, ISCRA-C BOILPATH and ISCRA-C FLUHD). The views and opinions expressed are those of the authors only and do not necessarily reflect those of the European Union or the European Research Council Executive Agency. Neither the European Union nor the granting authority can be held responsible for them.
Declaration of interests
The authors report no conflict of interest.
Author contributions
M.G. designed the research and wrote the original draft of the paper. A.B. and F.O. performed numerical simulations and analysed the data under the supervision of M.B. A.B., F.O., M.B. and M.G. performed research, interpreted the results, and revised the paper.
Data and codes availability statement
The final data supporting the research are made publicly available in the open Zenodo repository of the E-Nucl project, reachable at 10.5281/zenodo.20325087.
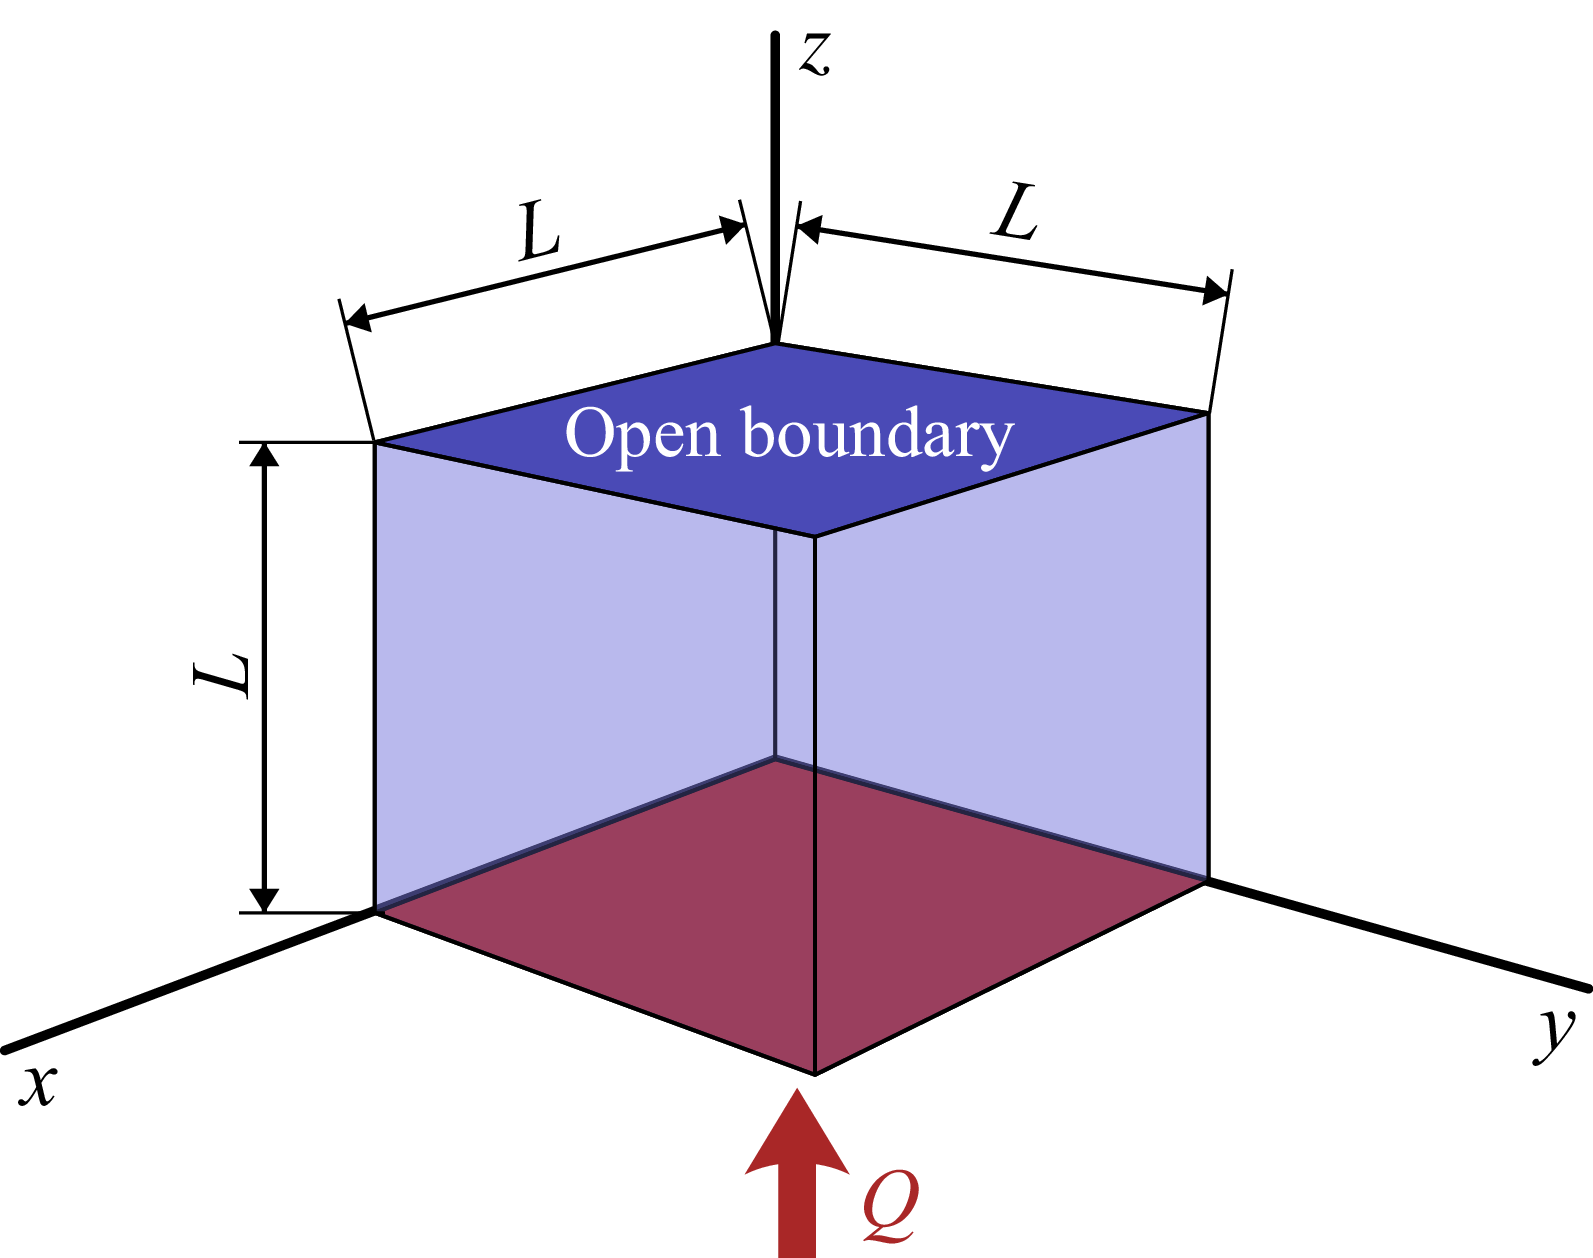


 Open access

