


1. Introduction
The coating of non-planar discrete objects is a common manufacturing step for a wide variety of products (Castro et al. Reference Castro, Wu, Woolbright, Scheinpflug, Hossainy and Chen2002; Heller et al. Reference Heller, Heldman, Foehlich and Kim2003; Fujitaka & Kobayashi Reference Fujitaka and Kobayashi2006; Benjamin et al. Reference Benjamin, Bennett, Bew and Swank2008; Chen & Ho Reference Chen and Ho2009; Lee et al. Reference Lee, Brun, Marthelot, Balestra, Gallaire and Reis2016; Cade & Xinwe Reference Cade and Xinwe2017; Chappa, Bach & Macgregor Reference Chappa, Bach and Macgregor2017; Keefer & Bosch Reference Keefer and Bosch2018). Studying the evolution of coatings on non-planar objects is difficult due to the complicated shapes of some objects and the large number of competing forces that govern coating flows. Topography on the object's surface may alter the competition between viscous, surface-tension, centrifugal and gravitational forces that control coating thickness and uniformity. Undesired disturbances to the coating thickness may arise and grow over time to yield non-uniform coatings.
A commonly studied model problem involves the flow of a thin liquid film on a smooth, circular cylinder that rotates about its horizontal axis. Some of the earliest work on these coating flows, conducted by Moffatt (Reference Moffatt1977) and Pukhnachev (Reference Pukhnachev1977), studied thin liquid films on 2-D cross-sections, where axial flows and curvature variations were neglected. By considering the balance between viscous and gravitational forces in the absence of surface tension, Moffatt derived a critical rotation rate above which a steady, smooth, and asymmetric coating is supported by cylinder rotation (Moffatt Reference Moffatt1977):
 \begin{equation} \varOmega_c = \left(\frac{2{\rm \pi}}{4.443}\right)^2\left(\frac{H^2}{R^2}\right)\frac{\rho g R}{\mu}. \end{equation}
Here,  $\varOmega _c$ is the critical rotation rate, $H$ is the mean coating thickness, $R$ is the cylinder radius, $\rho$ is the liquid density, $g$ is the acceleration due to gravity and $\mu$ is the liquid viscosity. Pukhnachev determined that surface tension smoothed out discontinuities that would form in the absence of surface tension (Pukhnachev Reference Pukhnachev1977). Following the early work by Moffatt (Reference Moffatt1977) and Pukhnachev (Reference Pukhnachev1977), a large body of work has examined different aspects of this problem, as summarized by Evans, Schwartz & Roy (Reference Evans, Schwartz and Roy2005) and Li & Kumar (Reference Li and Kumar2018).
Although much of the research summarized in Evans et al. (Reference Evans, Schwartz and Roy2005) and Li & Kumar (Reference Li and Kumar2018) concerns flows on 2-D cross-sections of cylinders, other studies have shed light on the stability of the coating to axial disturbances. Below the critical rotation rate (1.1), gravity leads to the formation of a liquid ridge along the cylinder axis which is unstable to axial disturbances via a Rayleigh–Taylor-like (RT) instability (Evans et al. Reference Evans, Schwartz and Roy2005). The coating may break up at various points along the cylinder circumference into droplets or fingers of liquid whose axial spacing is controlled by the balance between gravitational and surface-tension forces (Fermigier et al. Reference Fermigier, Limat, Wesfreid, Boudinet and Quilliet1992; Evans et al. Reference Evans, Schwartz and Roy2005; Balestra, Brun & Gallaire Reference Balestra, Brun and Gallaire2016; Gallaire & Brun Reference Gallaire and Brun2017; Balestra et al. Reference Balestra, Kofman, Brun, Scheid and Gallaire2018).
For flow of a thin film on the underside of a stationary planar substrate, the wavelength of the RT instability ( $\lambda _{RT}$) is given by the wavelength of the fastest growing sinusoidal disturbance obtained from a linear stability analysis (LSA):
 \begin{equation} \lambda_{RT} = 2{\rm \pi} \sqrt{2}l_c, \end{equation}
where  $l_c = \sqrt {\rho g/\sigma }$ is the capillary length and $\sigma$ is the surface tension. While the fastest growing wavelength has been shown to change over time for a stationary non-planar substrate, previous work has determined that it is initially identical to the wavelength of the RT instability on the underside of planar substrates (1.2) (Balestra et al. Reference Balestra, Brun and Gallaire2016, Reference Balestra, Kofman, Brun, Scheid and Gallaire2018). One important goal of this work is to examine the effects of topographical patterning on the growth of the RT instability on rotating cylinders, where the topography may alter the forces affecting coating behaviour at low rotation rates.
For larger rotation rates or sufficiently thin films, the coating is susceptible to the formation of axially spaced ‘rings’ or ‘bands’ of liquid through a Rayleigh–Plateau-like (RP) instability (Yih & Kingman Reference Yih and Kingman1960; Moffatt Reference Moffatt1977; Hynes Reference Hynes1978; Kovac & Balmer Reference Kovac and Balmer1980; Evans et al. Reference Evans, Schwartz and Roy2005; Li & Kumar Reference Li and Kumar2018). In the absence of centrifugal forces, destabilizing pressure gradients imposed by axial variations in the angular curvature of the free surface compete with the stabilizing effects of the axial curvature of the free surface, causing disturbances of sufficiently long wavelength to grow. Centrifugal forces further destabilize the coating, shortening the wavelength where disturbances become unstable (Yih & Kingman Reference Yih and Kingman1960; Hynes Reference Hynes1978; Evans et al. Reference Evans, Schwartz and Roy2005; Li & Kumar Reference Li and Kumar2018). In a manner similar to the RT disturbance, the wavelength of the RP disturbance is taken to be the wavelength of the fastest growing sinusoidal disturbance obtained from LSA (Yih & Kingman Reference Yih and Kingman1960; Hynes Reference Hynes1978; Evans et al. Reference Evans, Schwartz and Roy2005; Li & Kumar Reference Li and Kumar2018).
By considering the balance between centrifugal and surface-tension forces in the absence of gravity, Evans et al. (Reference Evans, Schwartz and Roy2005) and Yih & Kingman (Reference Yih and Kingman1960) independently used LSA to obtain an expression that predicts the wavelength of the axially spaced rings on rotating, unpatterned cylinders:
 \begin{equation} \lambda_{RP}= 2{\rm \pi} R\sqrt{2}\left(1+\frac{\rho\varOmega^2 R^{3}}{\sigma}\right)^{{-}1/2}, \end{equation}
where angular thickness variations were assumed to be negligible. Here,  $\lambda _{RP}$ is the wavelength of the RP instability and $\varOmega$ is the cylinder rotation rate. In Hynes (Reference Hynes1978), LSA was used to derive a similar expression for $\lambda _{RP}$ that accounted for gravitational effects on the coating. The effects of gravity become negligible at sufficiently high rotation rates and this expression for the RP wavelength reduces to (1.3) (Hynes Reference Hynes1978). In the present work, another important goal is to examine the effects of topographical patterning on the behaviour of the coating in the RP regime; here, the effects of surface-tension and centrifugal forces on the behaviour of the coating may be altered by the presence of topography, yielding qualitatively different behaviour than what is observed on circular cylinders.
On topographically patterned objects, variations in the object's curvature may alter the shape of the coating and change how instabilities grow. Li, Carvalho & Kumar (Reference Li, Carvalho and Kumar2017) explored the growth of instabilities on 2-D cross-sections of sinusoidally patterned rotating cylinders. Finite-element method (FEM) simulations of the Stokes equations and finite-difference simulations of a lubrication-theory-based evolution equation were used to study this system. In the FEM simulations, inertial effects arising from gravitational and Coriolis forces were neglected while centrifugal forces were retained. Good agreement was found between the FEM simulations and lubrication model for sufficiently thin coatings. In the limit where gravity is negligible, two regimes of coating behaviour separated by a cutoff rotation rate  $\varOmega _{cut}$ were observed in simulations. Surface-tension forces drive liquid into pattern troughs below $\varOmega _{cut}$, and centrifugal forces drive liquid onto pattern crests above $\varOmega _{cut}$. Li et al. (Reference Li, Carvalho and Kumar2017) reasoned that the sinusoidal topography, with wavelength $\lambda _{\theta }$, would induce a small sinusoidal thickness disturbance of identical wavelength $\lambda _{\theta }$ in the coating. By assuming the topography plays a negligible role in the growth of this disturbance for short times, an expression for $\varOmega _{cut}$ was obtained from LSA of a coating on an unpatterned cylinder:
 \begin{equation} \varOmega_{cut} = \sqrt{\left(\frac{\sigma}{\rho R_{m}^3}\left(\frac{4{\rm \pi}^2R_{m}^2}{\lambda_{\theta}^2}-1\right)\right)}, \end{equation}
where  $R_m$ is the mean cylinder radius. It was found that (1.4) agrees well with the coating regimes found in simulations. The capabilities of the LSA used to obtain (1.4) are limited, however. The LSA does not capture how topography affects the rate at which disturbances evolve, nor does it capture the effects of substrate and free-surface curvature in the axial direction on the liquid distribution. A third goal of this work is to address these two open questions.
In § 2, we present a lubrication-theory-based model to describe the flow of a thin coating on a rotating, 3-D topographically patterned cylinder. We start with the limiting case where gravity is neglected in § 3 and reincorporate gravity in § 4. Complementary flow visualization experiments are presented in § 5, and conclusions are provided in § 6.
2. Mathematical model
We consider the flow of a Newtonian liquid film which fully wets a topographically patterned cylinder of mean radius  $R_{m}$ rotating clockwise at angular speed $\varOmega$. The problem is defined using cylindrical coordinates $(r,\theta ,z)$ with basis vectors $(\boldsymbol {e}_{\boldsymbol {r}},\boldsymbol {e}_{\boldsymbol {\theta }}, \boldsymbol {e}_{\boldsymbol {z}})$ in a reference frame rotating clockwise with the cylinder ( $\boldsymbol {\varOmega } = -\varOmega \boldsymbol {e}_{\boldsymbol {z}},\varOmega >0$). The thickness of the liquid film $h(\theta ,z,t)$ is defined with respect to the cylinder surface as shown in figure 1. The radial coordinate for the cylinder surface is given by $R(\theta ,z) = R_{m} + B(\theta ,z)$, where $B(\theta ,z)$ is a function describing the surface patterning (§ 2.3). For convenience, a new radial coordinate $y=r-R_{m}-B(\theta ,z)$ is defined on the interval $0\le y\le h(\theta ,z,t)$. The position vector $\boldsymbol {r}$ and the liquid velocity $\boldsymbol {u}$ are defined as
 \begin{gather} \boldsymbol{r} = \left(y+R_{m}+B(\theta,z)\right)\boldsymbol{e}_{\boldsymbol{r}} + z\boldsymbol{e}_{\boldsymbol{z}}, \end{gather}
 \begin{gather}\boldsymbol{u} = u_r\boldsymbol{e}_{\boldsymbol{r}} + u_{\theta}\boldsymbol{e}_{\boldsymbol{\theta}} + u_z\boldsymbol{e}_{\boldsymbol{z}}. \end{gather}
Note that we consider film thicknesses such that  $h(\theta ,z,t)$ possesses only a single value of $h$ for each $\theta$ and $z$.
$z$.
Model geometry. (a) End view. (b) Side view.

2.1. Governing equations
In the rotating reference frame ( $\boldsymbol {\varOmega } = -\varOmega \boldsymbol {e}_{\boldsymbol {z}}$), the mass and momentum conservation equations for a Newtonian liquid of density $\rho$ and viscosity $\mu$ are
 \begin{gather} \boldsymbol{\nabla}\boldsymbol{\cdot}\boldsymbol{u} = 0, \end{gather}
 \begin{gather}\rho\left(\frac{\partial \boldsymbol{u}}{\partial t} + \boldsymbol{u}\boldsymbol{\cdot}\boldsymbol{\nabla} {\boldsymbol{u}}\right) ={-}\boldsymbol{\nabla}p + \mu\nabla^2\boldsymbol{u} + \rho\boldsymbol{g} - \rho\boldsymbol{\varOmega}\times(\boldsymbol{\varOmega}\times\boldsymbol{r}) + 2\rho\boldsymbol{\varOmega}\times\boldsymbol{u}, \end{gather}
where  $\boldsymbol {g} = -g\sin (\theta -\varOmega t)\boldsymbol {e}_{\boldsymbol {r}}-g\cos (\theta -\varOmega t)\boldsymbol {e}_{\boldsymbol {\theta }}$ is the gravitational acceleration ( $g= \|\boldsymbol {g}\|$) and $p$ is the liquid pressure. On the cylinder surface, we apply no-penetration and no-slip conditions for the liquid velocities,
 \begin{gather} \boldsymbol{n}_{\boldsymbol{c}}\boldsymbol{\cdot}\boldsymbol{u} = 0, \end{gather}
 \begin{gather}\boldsymbol{t}_{\boldsymbol{c},\boldsymbol{i}}\boldsymbol{\cdot} \boldsymbol{u} = 0 \quad (i = \theta,z), \end{gather}
where  $\boldsymbol {n}_{\boldsymbol {c}}$ and $\boldsymbol {t}_{\boldsymbol {c},\boldsymbol {i}}$ are the unit vectors normal and tangential to the cylinder surface,


At the liquid–air interface (y = h), we apply interfacial balances for total mass, normal stress and tangential stress (Delhaye Reference Delhaye1974; Burelbach, Bankoff & Davis Reference Burelbach, Bankoff and Davis1988; Slattery Reference Slattery2007):
 \begin{gather} (\boldsymbol{u}^l-\boldsymbol{u}^I)\boldsymbol{\cdot}\boldsymbol{n} = 0, \end{gather}
 \begin{gather}p^l - [\boldsymbol{n}\boldsymbol{\cdot}\boldsymbol{\tau}\boldsymbol{\cdot} \boldsymbol{n}]^l - p^v + [\boldsymbol{n}\boldsymbol{\cdot} \boldsymbol{\tau}\boldsymbol{\cdot}\boldsymbol{n}]^v = \sigma\boldsymbol{\nabla}\boldsymbol{\cdot}\boldsymbol{n}, \end{gather}
 \begin{gather}-\left[\boldsymbol{n}\boldsymbol{\cdot}\boldsymbol{\tau}\boldsymbol{\cdot} \boldsymbol{t}_i\right]^l + [\boldsymbol{n}\boldsymbol{\cdot} \boldsymbol{\tau}\boldsymbol{\cdot}\boldsymbol{t}_i]^v ={-} \boldsymbol{\nabla}_s\sigma\boldsymbol{\cdot}\boldsymbol{t}_{\boldsymbol{i}} (i = \theta ,z), \end{gather}
where  $\boldsymbol{\tau}$ denotes the viscous stress tensor and the superscripts $l$,
$l$,  $v$ and $I$, respectively, denote liquid, vapour and interface quantities. Equation 2.10 is the kinematic condition. The scalar $\sigma$ is the surface tension of the liquid. The vectors $\boldsymbol {n}$ and $\boldsymbol {t}_{\boldsymbol {i}}$ are the outward unit normal and tangent vectors of the liquid–air interface, defined as
 \begin{gather} \boldsymbol{n} = \frac{1}{N^{{1}/{2}}}\left( \boldsymbol{e}_{\boldsymbol{r}}- \frac{1}{r}\left( \frac{\partial \left( h+B \right)}{\partial \theta} \right)\boldsymbol{e}_{\boldsymbol{\theta}}- \left( \frac{\partial \left( h+B \right)}{\partial z} \right)\boldsymbol{e}_{\boldsymbol{z}} \right), \end{gather}

where
 \begin{equation} N = 1+\left( \frac{1}{r}\frac{\partial \left( h+B \right)}{\partial \theta} \right)^2+\left( \frac{\partial \left( h+B \right)}{\partial z} \right)^2. \end{equation}
2.2. Scaling and evolution equations
In many applications of interest, the characteristic thickness  $H$ of the liquid film is much smaller than the mean cylinder radius $R_m$. As a result, a small parameter $\epsilon = H/R_m \ll 1$ may be defined, and the lubrication approximation may be invoked to simplify the governing equations. Following Evans, Schwartz & Roy (Reference Evans, Schwartz and Roy2004), Evans et al. (Reference Evans, Schwartz and Roy2005), Li & Kumar (Reference Li and Kumar2015, Reference Li and Kumar2018), we introduce the following dimensionless quantities, denoted by tildes
 \begin{equation} \left.\begin{gathered} \left(y,h,B\right) = H(\tilde{y},\tilde{h},\tilde{B}) \quad (r,z) = R_{m}(\tilde{r},\tilde{z}) \quad t = \varUpsilon\tilde{t} \\ u = \epsilon U\tilde{u} \quad v = U \tilde{v} \quad w = U \tilde{w} \\ p = P\tilde{p}. \end{gathered}\right\} \end{equation}
 The characteristic speed  $U=\rho gH^2/\mu$, characteristic pressure $P = \mu U/H$ and characteristic time
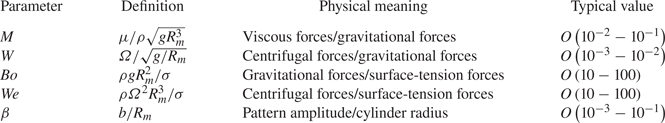
  $\varUpsilon = R_{m}/U$ are based on gravitational drainage of the coating. Order-of-magnitude estimates for select dimensional quantities in (2.17) are listed in table 1. The dimensionless amplitude of the cylinder topography $\beta$, listed in table 2, is the ratio of the dimensional amplitude $b$ of the topography to the mean cylinder radius $R_m$ ( $\beta =b/R_{m}$). The dimensionless amplitude is assumed to be a small parameter such that $\beta \ll 1$. Hereafter, we drop the tilde notation from dimensionless variables for simplicity.
Dimensional values for various properties.

Dimensionless parameters.
We non-dimensionalize (2.3) and (2.4) and the corresponding boundary conditions in § 2.1 using the scalings shown in (2.17) and simplify this set of equations by neglecting terms of  ${O}( {\epsilon ^2})$ and smaller and the dynamics of the air. The following evolution equation for the film thickness is obtained:
 \begin{align}
\left(1+\epsilon h + \epsilon B\right)\frac{\partial
h}{\partial t} &= \frac{\partial}{\partial
\theta}\left(\cos\theta_r\left(\frac{h^3}{3}+\frac{\epsilon
h^4}{2}\right)\right) - \epsilon\boldsymbol{\tilde{\nabla}}\notag\\ &\quad
\boldsymbol{\cdot}\left(\frac{h^3}{3}\left[(W^2-\sin\theta_r)
\tilde{\boldsymbol{\nabla}}(h+B)
+\frac{1}{Bo}\tilde{\boldsymbol{\nabla}}(h+B+\tilde{\nabla}^2(h+B))\right]\right),
\end{align}
\begin{align}
\left(1+\epsilon h + \epsilon B\right)\frac{\partial
h}{\partial t} &= \frac{\partial}{\partial
\theta}\left(\cos\theta_r\left(\frac{h^3}{3}+\frac{\epsilon
h^4}{2}\right)\right) - \epsilon\boldsymbol{\tilde{\nabla}}\notag\\ &\quad
\boldsymbol{\cdot}\left(\frac{h^3}{3}\left[(W^2-\sin\theta_r)
\tilde{\boldsymbol{\nabla}}(h+B)
+\frac{1}{Bo}\tilde{\boldsymbol{\nabla}}(h+B+\tilde{\nabla}^2(h+B))\right]\right),
\end{align}
where  $\theta _r = \theta -MW\epsilon ^{-2}t$ is the angular coordinate in a fixed reference frame. Equation (2.18) retains the effects of viscous, gravitational, centrifugal and surface-tension forces on the coating, while the remaining inertial and Coriolis forces are of ${O}({\epsilon ^{2}})$ and neglected through the lubrication approximation. When the topography amplitude $\beta$ is of ${O}(0.1)$, prior work has demonstrated that (2.18) can capture key qualitative features of the coating behaviour in two dimensions, based on comparisons with FEM simulations (Li et al. Reference Li, Carvalho and Kumar2017).
Table 2 provides definitions, physical interpretations and typical values of dimensionless parameters in (2.18). The parameters  $M$ and $W$ are the dimensionless viscosity and rotation rate. The small parameter $\epsilon$ is the dimensionless characteristic film thickness. Lastly, $Bo$ and $We$ are the Bond and Weber numbers, which, respectively, give the magnitude of gravitational forces and centrifugal forces to surface-tension forces. When the cylinder is unpatterned ( $B(\theta ,z)=0$), (2.18) reduces to the evolution equation in Evans et al. (Reference Evans, Schwartz and Roy2005). In the limit where axial variations in thickness and topography are neglected ( $\partial /\partial z=0$) and the patterning is a sinusoidal function given by $B(\theta ) = \beta \epsilon ^{-1}\sin (k_{\theta }\theta )$, where $k_{\theta}$ is the topography wavenumber, (2.18) reduces to the evolution equation in Li et al. (Reference Li, Carvalho and Kumar2017).
Given a set of dimensionless parameters (table 2) and initial conditions, (2.18) is solved using an alternating-direction implicit (ADI) finite-difference scheme similar to that of Mata & Bertozzi (Reference Mata and Bertozzi2011). The spatial domain is discretized using a uniform grid of  $n_{\theta }\times n_z$ points, where the grid spacing is defined as $\Delta x = 2{\rm \pi} /n_{\theta }$ and the length of the cylinder is defined as $L = n_z\Delta x$. An initial time step of $\Delta t_0$ is set, and an adaptive time-stepping method similar to that of Mata & Bertozzi (Reference Mata and Bertozzi2011) is used to determine the time step during simulations. Spatial derivatives are approximated using second-order centred finite differences, while the time-stepping is done using a semi-implicit scheme.
At each time step, an iterative procedure is applied to reduce computational time and to improve solution accuracy (Mata & Bertozzi Reference Mata and Bertozzi2011; Li & Kumar Reference Li and Kumar2018). Periodic boundary conditions are applied in both the angular direction ( $h(\theta =0,z) = h(\theta =2{\rm \pi} ,z)$) and the axial direction ( $h(\theta ,z=0)=h(\theta ,z=L)$). To properly resolve the topography, upwards of $n_\theta =400$ grid points are used in the angular direction. The number of grid points in the axial direction is determined from the desired length $L$ and $n_\theta$ by
 \begin{equation} n_z = \frac{n_{\theta}L}{2{\rm \pi}}. \end{equation}
The value of  $L$ is chosen to be at least three times larger than the wavelength of disturbances in the coating. Disturbance wavelengths were not known a priori, so $L$ was increased and simulations were re-run when necessary. For topography with fine features, the number of grid points was increased until graphical accuracy was obtained, which typically required $n_{\theta }\geq 400$ and $n_{z}\geq 1200$.
2.3. Topographical patterning
In the derivation of (2.18), the form of the topography has been left as an arbitrary function  $B(\theta ,z)$. Here, flows are examined on sinusoidally patterned cylinders whose curvature varies in the angular direction, the axial direction or combinations thereof. Renderings of the topographies we examine are shown in figure 2, and a description of these topographies is provided below.
Topographically patterned cylinders with dimensionless pattern amplitude  $\beta = 0.1$ of various shapes: (a) angularly patterned cylinder with $k_{\theta }=5$, (b) axially patterned cylinder with $k_{z}=5$ and (c) screw-shaped cylinder with $k_{\theta }=5$ and $k_{z}=5$.

The simplest, limiting cases comprise topographies which are purely angular (figure 2a) or purely axial (figure 2b):
 \begin{gather} B(\theta) = \frac{\beta}{\epsilon}\cos\left(k_{\theta}\theta\right), \end{gather}
 \begin{gather}B(z) = \frac{\beta}{\epsilon}\cos\left(k_{z}z\right), \end{gather}
where  $\beta$ is the dimensionless pattern amplitude and $k_{i}$ is the wavenumber of the topography in either the axial ( $i=z$) or the angular ( $i=\theta$) direction. One generalized form of (2.20) and (2.21) possesses both angular and axial curvature:
 \begin{equation} B(\theta,z) = \frac{\beta}{\epsilon}\cos\left(k_{\theta}\theta+k_z z\right). \end{equation}
When the wavenumbers  $k_{\theta }=0$ or $k_{z}=0$, (2.22) reduces to either (2.20) or (2.21). For non-zero $k_{\theta }$ and $k_{z}$, an object whose topography is described by (2.22) resembles a screw-shaped cylinder (figure 2c). For any of the topographies shown above, the dimensionless wavelength of the patterning in each direction ( $i=\theta ,z$) is given by $2{\rm \pi} /k_{i}$.
3. Rapidly rotating cylinder
An insightful limiting case involves the coating of cylinders which rotate so rapidly that gravitational effects are negligible. In the absence of gravity, alternate scales must be chosen to replace the gravity-based characteristic scales. After neglecting gravitational terms, we rescale (2.18) using a capillary time  $T = \mu R_m/\sigma$ and capillary velocity $U = \sigma /\mu$ to obtain a new evolution equation,
 \begin{equation} \left(1+\epsilon h + \epsilon B\right)\frac{\partial h}{\partial t} ={-} \epsilon^3\boldsymbol{\tilde{\nabla}} \boldsymbol{\cdot}\left(\frac{h^3}{3}[We\tilde{\boldsymbol{\nabla}}(h+B)+\tilde{\boldsymbol{\nabla}}(h+B+\tilde{\nabla}^2(h+B)) ]\right). \end{equation}
Here, the Weber number ( $We = \rho \varOmega ^2 R_m^3/\sigma$) is the ratio of centrifugal forces to surface-tension forces. Note that the Weber number may also be expressed as $We = W^2Bo$.
The behaviour of coatings on unpatterned, rapidly rotating cylinders, where  $B=0$ in (3.1), has been explored extensively in prior work (Yih & Kingman Reference Yih and Kingman1960; Hynes Reference Hynes1978; Evans et al. Reference Evans, Schwartz and Roy2005; Li & Kumar Reference Li and Kumar2018). In simulations of coatings on rapidly rotating cylinders, axially spaced rings grow with a wavelength similar to the wavelength of the RP instability predicted by LSA (1.3) (Evans et al. Reference Evans, Schwartz and Roy2005). The dimensionless wavelength of the RP instability is given by
 \begin{equation} \lambda^{*}_{RP} = \frac{\lambda_{RP}}{R_m}= \frac{2\sqrt{2}{\rm \pi}}{\sqrt{1+We}}, \end{equation}
where  $\lambda ^{*}_{RP}$ depends solely on the Weber number $We$. The growth rate $\omega _m$ of the RP disturbance,
 \begin{equation} \omega_m = \frac{\epsilon^3(1+We)^2}{12\left(1+\epsilon\right)}, \end{equation}
is proportional to both the characteristic film thickness  $\epsilon$ and $We$. Over time, the spacing of the rings observed in simulations varies due to the shifting of rings and the formation of smaller satellite rings at late times (Evans et al. Reference Evans, Schwartz and Roy2005).
For a coating of initially uniform thickness, liquid has been observed to accumulate either over the pattern crests or in the pattern troughs of 2-D sinusoidally patterned cylinders (Li et al. Reference Li, Carvalho and Kumar2017). At low  $We$, capillary forces level the coating and drive liquid into the troughs; at high $We$, centrifugal forces drive liquid to pattern crests, where the radius of the object is larger. An expression for the critical Weber number $We_c$ separating these regimes was inferred from LSA conducted on an unpatterned cylinder ( $B(\theta ,z) = 0$) (Li et al. Reference Li, Carvalho and Kumar2017). This expression was found to agree well with 2-D nonlinear simulations of (3.1) (Li et al. Reference Li, Carvalho and Kumar2017). Here, we more rigorously derive an expression for the critical Weber number using a long-wave analysis, where the thickness is expressed as a regular perturbation series in $\epsilon$. In addition to providing an expression for $We_c$, the long-wave analysis yields very general information about the growth rate of disturbances which the analysis in Li et al. (Reference Li, Carvalho and Kumar2017) could not.
3.1. Long-wave analysis
A long-wave analysis, where the coating thickness is expanded as a regular perturbation series in the small parameter  $\epsilon = H/R_m \ll 1$, may be used to find an analytical solution to (3.1). For this analysis, we study the flow of a coating on a screw-shaped topography (2.22), which allows us to consider curvature in the axial and angular directions simultaneously. Additionally, the pattern amplitude $\beta$ must be ${O}({\epsilon })$ such that $\beta /\epsilon$ is ${O}({1})$. We expand the thickness in (3.1) as a regular perturbation series in $\epsilon$:
 \begin{equation} h(\theta,z,t) \approx h_0(\theta,z,t) + \epsilon h_1(\theta,z,t) + \epsilon^2 h_2(\theta,z,t) + \epsilon^3 h_3(\theta,z,t) + {O}({\epsilon^4}), \end{equation}
with the uniform initial condition  $h(\theta ,z,0) = 1$. Substituting (3.4) into (3.1) yields
 \begin{gather} \frac{\partial h_0}{\partial t} = 0, \end{gather}
 \begin{gather}\frac{\partial h_1}{\partial t} = 0, \end{gather}
 \begin{gather}\frac{\partial h_2}{\partial t} = 0, \end{gather}
 \begin{gather}\frac{\partial h_3}{\partial t} ={-}\boldsymbol{\tilde{\nabla}} \boldsymbol{\cdot}\left(\frac{h_0^3}{3}[We\tilde{\boldsymbol{\nabla}}(h_0+B)+ \tilde{\boldsymbol{\nabla}}(h_0+B+\tilde{\nabla}^2(h_0+B))]\right). \end{gather}
Equations (3.5)–(3.7) indicate that terms  $h_0$, $h_1$ and $h_2$ are independent of time. Application of the initial condition $h(\theta ,z,0) = 1$ yields $h_0 = 1$ and $h_1=h_2=0$. When $\tilde {\boldsymbol {\nabla }}B=0$ ( $k_{\theta }=k_{z}=0$ or $\beta =0$), we note that the solution to (3.8) is trivial, yielding $h_3 = 0$. The following analysis is carried out for the non-trivial case.
Equation (3.8) is solved by separation of variables, where we express  $h_3$ as $h_3(\theta ,z,t) = \bar {h}_3(t)\hat {h}_3(\theta ,z)$. The resulting differential equation is
 \begin{equation} \frac{\textrm{d}\bar{h}_3}{\textrm{d}t} ={-}\frac{1}{\hat{h}_3}\boldsymbol{\tilde{\nabla}} \boldsymbol{\cdot}\left(\frac{h_0^3}{3}[We\tilde{\boldsymbol{\nabla}}B+\tilde{\boldsymbol{\nabla}}(B+\tilde{\nabla}^2 B)]\right). \end{equation}
The terms on the left- and right-hand sides of (3.9) are equal to a constant, which we denote with the growth rate  $\omega$, and solutions for $\bar {h}_3(t)$ and $\hat {h}_3(\theta ,z)$ can be obtained:
 \begin{gather} \bar{h}_{3}(t) = \omega t, \quad \hat{h}_{3}(\theta ,z) = \frac{\beta}{\epsilon}\cos\left(k_{\theta}\theta + k_{z} z\right),\end{gather}
 \begin{gather} \omega = \frac{1}{3}((1+We)k^2-k^4 \vphantom{\frac{h^3}{3}}). \end{gather}
Here,  $k = \sqrt {k_{\theta }^2+k_{z}^2}$ is a lumped wavenumber. The regular perturbation series solution with initial condition $h(\theta ,z,0) = 1$ is then
 \begin{equation} h(\theta,z,t) = 1 + \epsilon^2 \beta\omega t\cos(k_{\theta}\theta+k_{z}z) + {O}({\epsilon^4}). \end{equation}
Recall that  $\beta$ is ${O}({\epsilon })$, so $\epsilon ^2\beta$ is ${O}({\epsilon ^3})$.
According to (3.12), the topography induces a disturbance in the coating, as was observed in Li et al. (Reference Li, Carvalho and Kumar2017). For cylinders with  $k\neq 0$ and $\beta \neq 0$, the magnitude of $\beta \epsilon ^2 \omega$ controls the rate at which the disturbance develops, and the sign of $\omega$ controls the location where liquid pools. The induced disturbance grows either in-phase ( $\omega >0$) or out-of-phase ( $\omega <0$) with the topography depending on the sign of the growth rate $\omega$. When $\omega >0$, centrifugal forces dominate and liquid accumulates over pattern crests. When $\omega <0$, capillary forces dominate and liquid accumulates in pattern troughs.
For fixed values of  $k_\theta$ and $k_z$ where $k\neq 0$, the critical Weber number $We_c$ at which this transition occurs can be obtained by solving $\omega (We_c) = 0$ (see (3.11))
 \begin{equation} We_c = k_{\theta}^2+k_{z}^2-1. \end{equation}
A similar expression for  $We_c$ on 2-D sinusoidally patterned cylinders was inferred in Li et al. (Reference Li, Carvalho and Kumar2017), where the evolution of small-amplitude disturbances on unpatterned cylinders was likened to the evolution of small-amplitude disturbances induced by a sinusoidal topography. A special case of (3.13) occurs when $k_{\theta }=0$ and $k_{z}< 1$, where $We_c$ is less than zero. This is unphysical as all of the parameters in $We$ must be greater than zero (see table 2). When $We_c<0$, any realistic Weber number $We\geq 0$ yields a positive growth rate $\omega$ (3.11), and the long-wave analysis predicts that liquid will always accumulate over pattern crests, even when the cylinder does not rotate ( $We=0$).
3.2. Axially patterned cylinders
To probe the limits of the long-wave approximation (3.12), simulations of (3.1) are presented for a representative case. We consider purely axially patterned cylinders ((2.21), where  $k_{\theta }=0$ with $k_{z} = 4$) and initially undisturbed coatings of uniform thickness ( $h(\theta ,z,t=0) = 1$). The Weber numbers used in these simulations ( $We=20$ and $10$) sit on either side of the critical Weber number ( $We_c=15$) so the growth rates are of equal magnitude but opposite sign ( $\omega =\pm 26.67$). We extract the amplitude $\bar {h}_3(t)$ of the induced disturbance from simulations by solving (3.12) for $\omega t$ at fixed points on the cylinder $\theta _0$ and $z_0$ (e.g. $\theta _0=z_0={\rm \pi}$):
 \begin{equation} \bar{h}_3(t) = \omega t = \frac{h(\theta_0,z_0,t)-1}{\epsilon^2\beta\cos\left(k_{\theta}\theta_0 + k_{z} z_0\right)}. \end{equation}
For all of the simulations in §§ 3.2 and 3.3,  $\epsilon = 0.01$ and $\beta =10^{-3}$ so that the topography amplitude is 10 % of the characteristic film thickness.
The amplitudes extracted from simulations using (3.14) are compared with those predicted by the long-wave approximation (3.10a,b) in figure 3. At early times ( $t<1\times 10^{4}$), good agreement is observed between the long-wave approximation and the simulations. However, deviation between the long-wave approximation and the simulations develops at later times ( $t>1\times 10^{4}$). Compared with the simulations, the long-wave approximation underpredicts the disturbance amplitude above $We_c$ and overpredicts it below $We_c$. These simulation results also indicate that the rate of levelling below $We_c$ slows down over time while centrifugation above $We_c$ becomes faster.
Disturbance amplitude  $\bar {h}_3(t)$ from simulation results (filled symbols) and the long-wave approximation (solid lines). The growth rates are $\omega = \pm 26.67$ for $We=20$ and $We=10$, respectively, with $\epsilon =0.01$ and $\beta = 10^{-3}$. The horizontal line marks $\bar {h}_{3}(t) = 0$. The vertical line marks where the long-wave analysis deviates noticeably from the simulation results ( $t = 1.0\times 10^{4}$).

Three-dimensional renderings of the coatings for  $We=10$ and $We=20$ are provided in figures 4(a) and 4(b) at the time denoted by the vertical line in figure 3 ( $t = 1\times 10^{4}$). In these renderings, the upward-moving side of the cylinder faces the reader. Liquid accumulates in troughs for $We < We_c$ and over crests for $We>We_c$, as predicted from the long-wave analysis. We note that the spacing of the rings calculated from simulations (figure 4a,b) is identical to the wavelength of the axial topography, given by ${\lambda _z = 2{\rm \pi} /k_z \approx 1.57}$. This is different than the spacing of rings one would expect on an unpatterned cylinder, predicted from (3.2) to be $\lambda _{RP}^* = 2.68$ and $\lambda _{RP}^* = 1.94$ for $We=10$ and $We=20$, respectively.
The 3-D renderings of the coatings analysed in figure 3 with  $\epsilon =0.01$ and $\beta =10^{-3}$ at $t = 1\times 10^{4}$ for (a) $We = 10$ and (b) $We=20$. Rescaled film thicknesses ( $\epsilon h$) are indicated by the colourbar. Note that the $z$-axis is not to scale, and that the topography and film thickness have been exaggerated by 20 times for easier viewing.

At longer times past what is shown in figures 3 and 4, non-uniformities may also develop along the angular direction, in which the cylinder is unpatterned. To examine these circumferential variations, ‘unravelled’ coating thicknesses for the simulations shown in figure 4 have been plotted against the angular and axial coordinates at  $t=1.0\times 10^{6}$. Dashed black lines are used to denote the position of pattern crests. At $We=10$ (figure 5a), the liquid remains confined in the pattern troughs and noticeable thickness variations do not develop around the circumference. The stability of these rings is due to the prevalence of surface-tension forces, which suppress the growth of disturbances in the angular direction.
Film thicknesses for the simulations shown in figures 3 and 4 with  $\epsilon =0.01$ and $\beta =10^{-3}$ at $t=1\times 10^{6}$ for (a) $We = 10$ and (b) $We=20$. Rescaled film thicknesses ( $\epsilon h$) are indicated by the colourbars. Dashed black lines are used to denote the position of pattern crests.
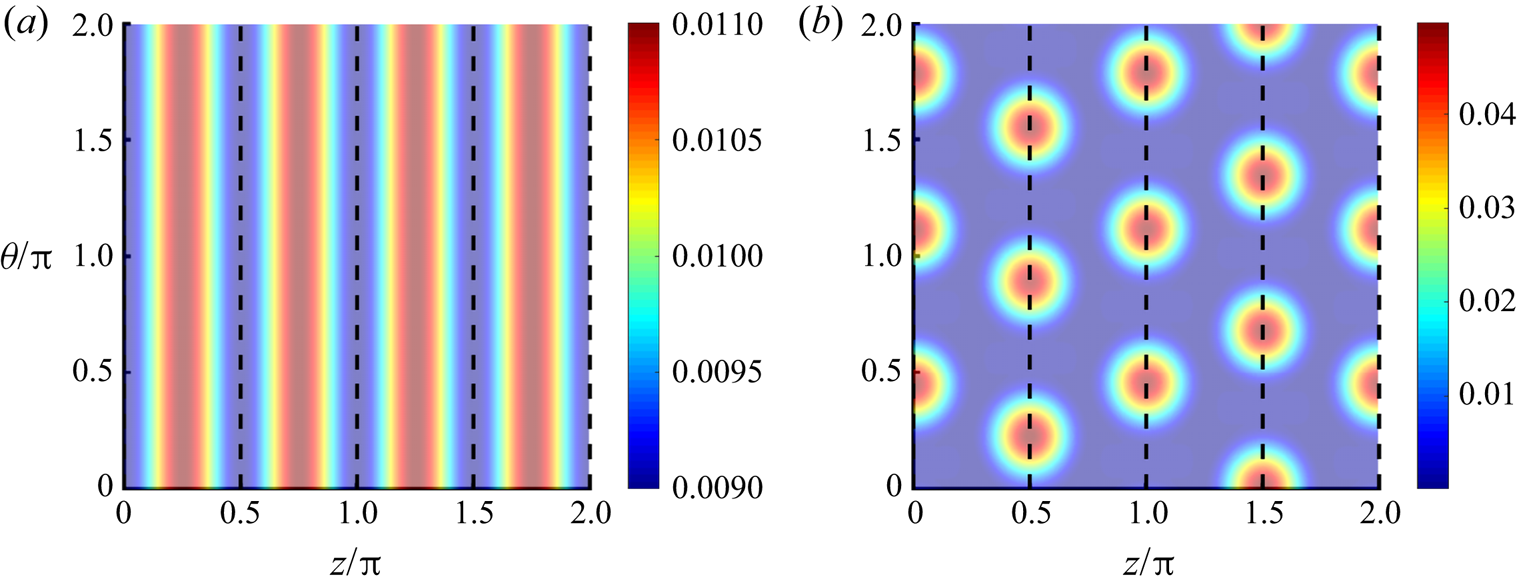
When centrifugal forces dominate at  $We=20$ (figure 5b), each band of liquid over the pattern crests segregates into angularly spaced droplets. The angular spacing of these droplets is equal to the spacing predicted by LSA on 2-D cross-sections of unpatterned cylinders (Evans et al. Reference Evans, Schwartz and Roy2004). This instability arises because centrifugal forces destabilize the axially spaced rings to angular disturbances. Over later times for the simulation shown in figure 5(b), the droplets do not migrate noticeably from their positions at $t=1\times 10^6$. However, in similar simulations with larger characteristic film thicknesses $\epsilon$ or Weber numbers $We$, the droplets that form at later times may migrate and coalesce to form fewer, larger droplets. The results presented in figures 5(a) and 5(b) demonstrate a difference in the long-time stability of coatings below and above the critical Weber number that is not captured by the long-wave analysis.
3.3. Angularly patterned and screw-shaped cylinders
Simulations of coatings on cylinders with angular patterning and screw-shaped patterning have been conducted under various conditions. We summarize some of the results here as the behaviour is similar to that shown in figures 3–5. At early times, agreement between the long-wave approximation and the simulations is observed. At later times, deviations between the long-wave approximation and the simulations are observed as nonlinearities become more prevalent. Below  $We_c$, liquid pools in pattern troughs, and the bands of liquid that accumulate in troughs remain stable to disturbances over time. Above $We_c$, liquid collects over pattern crests, but these bands of liquid are unstable to disturbances, leading to the formation of droplets with fairly regular axial and angular spacing. These droplets may merge and shift over time, causing variations in droplet sizes and spacings. We relegate these results to Appendix A.
In summary, when gravitational forces may be neglected, the behaviour of coatings on topographically patterned cylinders is controlled by the balance between centrifugal and surface-tension forces. This balance is captured by a critical Weber number above which centrifugal forces drive liquid toward pattern crests and below which surface-tension forces drive liquid into pattern troughs. An expression for this critical Weber number  $We_c$ (3.13) has been rigorously derived for flows in three dimensions using a long-wave analysis. The long-wave analysis also yields a growth rate (3.11) that relates the rate of levelling ( $We < We_c$) or centrifugation ( $We>We_c$) to the dimensionless characteristic film thickness, the pattern wavenumbers, the pattern amplitude and the Weber number ( $\epsilon$, $k_{\theta }$ and $k_{z}$, $\beta$ and $We$, respectively). As the growth rate controls the rate at which thickness disturbances develop, it may be used to estimate the time window during which the coating may be dried before large non-uniformities develop.
Although the long-wave analysis provides useful information about the growth of disturbances on topographically patterned cylinders for early times, the results shown in figures 3, 5 and 20 (see Appendix A) demonstrate that it fails to capture coating evolution at later times. Results from simulations of (3.1) show the behaviour of coatings at later times, where coatings tend to break up into individual droplets above the critical Weber number.
4. Gravitational effects
We now examine the effects of topography on coating behaviour in the presence of gravity, where the coating may sag under its own weight. Simulations of (2.18) have been carried out on unpatterned (§ 4.1) and patterned (§§ 4.2 and 4.3) cylinders in the Rayleigh–Plateau (high  $W$) and Rayleigh–Taylor (low $W$) regimes. The initial condition is that of a uniform-thickness coating that has been disturbed by small-amplitude random noise $G(\theta ,z)$:
 \begin{equation} h(\theta,z,0) = \left(1 + \alpha\left( G(\theta,z)-0.5\right)\right), \end{equation}
where  $0\leq G(\theta ,z)\leq 1$ and $\alpha /2$ is the mean amplitude. For all simulations in § 4, we set $\alpha = 10^{-3}$; other problem parameters are set to values motivated by the flow visualization experiments in § 5.
4.1. Unpatterned cylinders
As discussed in § 1, axially spaced rings of liquid may form on unpatterned cylinders at large rotation rates (RP instability), and droplets may form on the underside of unpatterned cylinders at low rotation rates (RT instability). A useful estimate of the dimensionless rotation rate  $W_c$ that separates the RT and RP regimes on unpatterned cylinders is the minimum rotation rate needed to support a load of liquid on a rotating cylinder in the absence of surface tension, given in dimensional form in (1.1) (Moffatt Reference Moffatt1977; Hynes Reference Hynes1978; Evans et al. Reference Evans, Schwartz and Roy2005):
 \begin{equation} W_c = 2.001 \epsilon^2/M. \end{equation}
Here,  $\epsilon$ is the dimensionless characteristic film thickness and $M$ is the dimensionless viscosity (table 2).
A parameter sweep has been conducted to establish key features of coating behaviour in the RT ( $W < W_c$) and the RP ( $W>W_c$) regimes. The boundary between the RT and RP regimes predicted by (4.2) is $W_c=0.141$ for this set of simulations.
In figure 6, 3-D renderings of coatings from two representative simulations, one below  $W_c$ (figure 6a,b) and one above $W_c$ (figure 6c,d), are shown at two times to provide examples of coating evolution on unpatterned cylinders in the RT and RP regimes. Below $W_c$, a ridge of liquid supported by cylinder rotation and surface tension forms along the cylinder axis (figure 6a). Small undulations in the thickness and angular position of this ridge are present in figure 6(a). Over time, these undulations develop into individual fingers of liquid with regular spacing (figure 6b), a Rayleigh–Taylor-like instability. For flows on the underside of stationary, unpatterned cylinders, the dimensionless RT wavelength $\lambda ^{*}_{RT}$ is initially equal to that on stationary, planar substrates (given in dimensional quantities in (1.2)) (Fermigier et al. Reference Fermigier, Limat, Wesfreid, Boudinet and Quilliet1992):
 \begin{equation} \lambda^{*}_{RT} = \frac{\lambda_{RT}}{R} = 2{\rm \pi}\sqrt{\frac{2}{Bo}}, \end{equation}
where  $Bo = \rho gR^2/\sigma$ is the Bond number defined on an unpatterned cylinder. As was discussed in Evans et al., the spacing of droplets on unpatterned cylinders in the RT regime tends to be larger than that predicted by (4.3) (Evans et al. Reference Evans, Schwartz and Roy2005); this will be shown clearly in figure 7.
The 3D renderings obtained from simulations on unpatterned cylinders for  $M=0.0695$, $\epsilon = 0.07$ and $Bo = 50$. The rotation rates are (a,b) $W=0.14$ and (c,d) $W=0.8896$. The minimum rotation rate predicted by Moffatt is $W_c=0.141$ (4.2) (Moffatt Reference Moffatt1977). Rescaled film thicknesses ( $\epsilon h$) are indicated by the colourbars.

The spacing of disturbances calculated from simulations ( $\lambda ^{*}_{sim}$) of varying rotation rate on an unpatterned cylinder (blue circles). Other simulation parameters are $M=0.0695$, $\epsilon =0.07$ and $Bo=50$. The vertical line is $W_c=0.141$ (4.2) while the dashed and dotted-dashed lines are the predicted wavelengths of the RP instability (3.2) and the RT instability on a flat plate with $Bo=50$ (4.3).

Above  $W_c$, axially spaced mounds of liquid form with fairly regular spacing (figure 6c). Over time, centrifugal forces cause these axial thickness variations to develop into axially spaced rings of liquid which are thicker on the upward-moving side of the cylinder (figure 6d). Hynes noted that above $W_c$, key qualitative features of coating behaviour can be captured in the limit where gravity is neglected (Hynes Reference Hynes1978). In this limit, an expression for $\lambda _{RP}^*$, the dimensionless ring spacing on unpatterned cylinders predicted by LSA, is provided by (3.2). Here, the spacing depends on the Weber number $We = W^2Bo$ (Hynes Reference Hynes1978; Evans et al. Reference Evans, Schwartz and Roy2005).
The spacing of disturbances in the RT and the RP regimes serves as a good indicator of the boundary separating these regimes on unpatterned cylinders. In figure 7, the wavelength of disturbances calculated from simulations is shown for varying rotation rates on unpatterned cylinders. The wavelength of disturbances ( $\lambda ^{*}_{sim}$) is taken to be the average distance between peaks in the coating thickness. The boundary between the RT and RP regimes for an unpatterned cylinder, calculated from (4.2) ( $W_c=0.141$), is given by the vertical line. The dashed line to the right of $W_c$ is the predicted wavelength of the RP instability (3.2), and the dashed-dotted line to the left of $W_c$ is the predicted spacing of the RT instability on the bottom of a flat plate (4.3). The results falling very close to $W_c$ are for $W$ slightly less than the critical rotation rate ( $W=0.14$).
In the RP regime ( $W>W_c$), the spacing of the axially spaced rings agrees well with the wavelength predicted by LSA on an unpatterned cylinder, where the ring spacing decreases with increasing rotation rate $W$. In the RT regime ( $W < W_c$), the spacing of droplets on unpatterned cylinders is mostly unaffected by the rotation rate, varying between $\lambda ^{*}_{sim} = 1.45$ and $1.71$ for $0.01 \leq W\leq 0.1$. Similar to what was observed by Evans et al. (Reference Evans, Schwartz and Roy2005), the spacing in our simulations is larger than the spacing predicted for the RT instability on a flat plate ( $\lambda ^{*}_{RT} = 1.26$) for $Bo=50$ (figure 7). Near $W_c$, cylinder rotation better supports the coating weight and offsets some of the destabilizing effects of gravity. For $W=0.14$, which is slightly less than $W_c=0.141$, the spacing between droplets increases by 50 % from what is observed at lower rotation rates; however, this change in spacing with $W$ is small compared with the changes observed in the RP regime.
Although computational limitations have prevented us from performing a more extensive parameter sweep, we briefly comment on how other parameters affect the regime map (figure 7) for unpatterned cylinders based on prior work and the results of limited simulations. With an increase in dimensionless viscosity  $M$, the boundary between the RT and RP regimes $W_c$ decreases (4.2) since a coating of fixed thickness can be supported at a lower rotation rate as viscous forces increase (Evans et al. Reference Evans, Schwartz and Roy2005; Li & Kumar Reference Li and Kumar2018). Similarly, a decrease in the characteristic film thickness $\epsilon$ leads to a decrease in $W_c$. An increase in the Bond number $Bo$ decreases the spacing of both the RT and the RP instabilities, as one would expect from the expressions for their predicted wavelengths ((4.3) and (3.2)) (Evans et al. Reference Evans, Schwartz and Roy2005; Li & Kumar Reference Li and Kumar2018).
4.2. Angular topography
It is not obvious a priori how angular topography (2.20) alters coating behaviour, especially the formation of axial thickness variations. To explore this, a parameter sweep has been conducted for varying rotation rates  $W$ and pattern wavenumbers $k_{\theta }$. In figure 8, a regime map is presented to highlight the effect of angular topography on the spacing of disturbances in the RT regime ( $W < W_c$) and the RP regime ( $W>W_c$). Here, the topography amplitude $\beta =0.05$ is comparable to the film thickness $\epsilon =0.07$. Blue circles denote results obtained for unpatterned cylinders (also shown in figure 7) while coloured triangles denote results for angularly patterned cylinders. The dashed line and dotted-dashed line are the predicted spacings of the RP and RT instabilities, respectively, ((3.2) and (4.3)), while the vertical line is $W_c=0.141$ (4.2).
The spacing of disturbances calculated from simulations ( $\lambda ^{*}_{sim}$) of varying rotation rate for angularly patterned cylinders (coloured triangles) and unpatterned cylinders (blue circles). For patterned cylinders, the topography amplitude is fixed to $\beta =0.05$. Other simulation parameters are identical to those listed in figure 7. The vertical line is $W_c=0.141$ (4.2) while the dashed and dotted-dashed lines are the predicted wavelength of the RP instability (3.2) and the RT instability on a flat plate with $Bo=50$ (4.3).
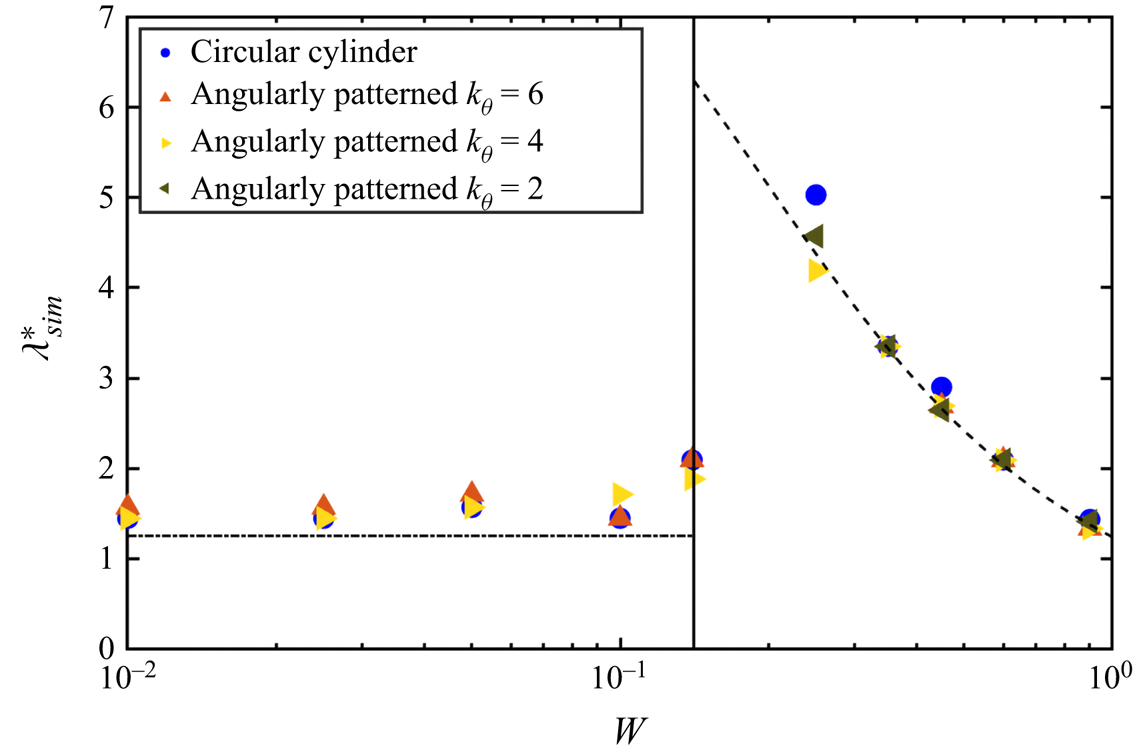
Over the range of rotation rates and pattern wavenumbers considered, the spacing of disturbances on angularly patterned cylinders is nearly identical to the spacing observed on unpatterned cylinders (figure 8), indicating that angular topography has a negligible effect on the axial spacing of disturbances. In the RP regime ( $W>W_c$), the spacing obtained for angularly patterned cylinders also agrees well with the predicted wavelength of the RP disturbances on unpatterned cylinders. To better understand this, a LSA was conducted in the limit of negligible gravity for flows on topographically patterned cylinders (see supplementary material available at https://doi.org/10.1017/jfm.2021.224). The expressions for the spacing and growth rate of axial disturbances on angularly patterned cylinders are identical to those predicted by LSA on unpatterned cylinders ((3.2) and (3.3)).
While the regime map presented in figure 8 demonstrates that the spacing of disturbances on rotating cylinders is largely unaffected by angular topography, figure 8 does not contain information regarding the effect of angular topography on the time evolution of these disturbances. To better understand this issue, we examine the results of a limited set of simulations in the RP regime ( $W>W_c$). Since the experiments in § 5 focus mainly on the RP regime, we relegate simulations for the RT regime to Appendix B.
The maximum axial thickness variation  $(\Delta h)_{max}$, normalized by the amplitude of the initial random noise $\alpha$, is calculated over time from simulations (Evans et al. Reference Evans, Schwartz and Roy2005; Li & Kumar Reference Li and Kumar2018). In figure 9, $\alpha ^{-1}(\Delta h)_{max}$ is shown on a logarithmic scale for simulations on an unpatterned cylinder (blue line) and an angularly patterned cylinder (red line). Dashed lines denote the initial slopes of $(\Delta h)_{max}$ in the linear regions of each simulation. Oscillations in $(\Delta h)_{max}$ are caused by fluctuations in the maximum coating thickness and occur with a frequency of a single rotation ( $\epsilon ^{2}M^{-1}W^{-1}$); while they appear to be discontinuous, each oscillation in figure 9 is smooth and contains over 10 000 time steps.
Normalized maximum axial thickness variation  $\alpha ^{-1}(\Delta h)_{max}$ over time on an unpatterned cylinder (blue) and angularly patterned cylinder (red) with $k_{\theta }=4$ and $\beta =0.02$. Other simulation parameters are $\alpha =10^{-3}$ (see (4.1)), $M=0.0695$, $\epsilon = 0.07$, $Bo = 41.42$ and $W = 0.8896$. Oscillations in $(\Delta h)_{max}$ have a period of a single revolution ( $\Delta t=2{\rm \pi} \epsilon ^2/MW$) and arise due to oscillations in the angular position of disturbances.

Near  $t=0$ in figure 9, $(\Delta h)_{max}$ drops as the random noise in the initial condition is smoothed out by surface tension. The maximum axial thickness variation $(\Delta h)_{max}$ across the cylinder subsequently grows as centrifugal forces lead to the growth of axially spaced disturbances. A plateau in $(\Delta h)_{max}$ is observed after these thickness variations have developed into axially spaced rings and ceased growing. For both simulations, $(\Delta h)_{max}$ reaches roughly the same value at late times, indicating that angular patterning does not significantly affect the amplitude of the axially spaced rings. However, growth of the rings occurs much faster on angularly patterned cylinders. The initial growth rate of these disturbances is twice as large for the angularly patterned cylinder than the unpatterned cylinder (where the growth rate is slightly smaller than what is predicted by LSA in the absence of gravity).
From figure 9, it is not immediately obvious why axially spaced rings grow faster on angularly patterned cylinders than unpatterned cylinders. We examine 3-D renderings of the simulation results for the angularly patterned cylinder in figure 10 to understand why this growth rate is larger. At the earliest time (figure 10a), centrifugal forces have caused the growth of four axially aligned ridges of liquid over crests in the angular topography. Centrifugal forces are stronger in these ridges of liquid as the coating mass is larger in these regions. The increase in the growth rate observed in figure 9 is the result of this process. For the simulation in figure 10, liquid accumulates over pattern crests as the Weber number  $We=W^2 Bo$ is greater than the critical Weber number $We_c = 15$ predicted by the long-wave analysis in § 3.1 (3.13). In simulations in the RP regime for Weber numbers less than $We_c$ (not shown here), liquid accumulates in the pattern troughs, but this still leads to a similar increase in the growth rate relative to unpatterned cylinders.


After these axially aligned ridges of liquid form on angularly patterned cylinders, axially spaced rings grow in a manner similar to what is observed on unpatterned cylinders. Over time, small variations in the thickness of these ridges (present in figure 10a) grow until the axially aligned ridges of liquid break up into axially spaced bands of liquid. At  $t=34.30$ (figure 10b), these bands of liquid are poorly defined; regions of larger thickness connect each band, and each band contains four angularly spaced lobes of liquid. Over time, these lobes combine and the separation between the bands becomes well defined, yielding the axially spaced rings seen in figure 10(c).
4.3. Axial topography
Flows which arise due to axial variations in cylinder curvature may greatly affect coating behaviour. In § 3.2, we examined coating behaviour on axially patterned cylinders in the limit where the cylinder rotates so rapidly that gravitational effects may be neglected. In this limit, liquid accumulates either at pattern crests when centrifugal forces dominate ( $We>We_c$) or pattern troughs when surface-tension forces dominate ( $We < We_c$). We observe similar behaviour when gravity is present. To probe the effect of axial topography on coating behaviour, a parameter sweep has been conducted for simulations on axially patterned cylinders of varying rotation rates $W$ and pattern wavenumbers $k_{z}$. Since for axially patterned cylinders liquid accumulates at pattern troughs or crests, the vertical axis of the regime map (figure 11) is set to the pattern wavenumber $k_{z}$.
Regime map from simulations on axially patterned cylinders ( $\beta =0.05$) for varying wavenumbers $k_z$ and rotation rates $W$. Other simulation parameters are $M=0.0695$, $\epsilon =0.07$ and $Bo=50$. Black circles denote simulations where liquid accumulates in pattern troughs while red diamonds denote simulations where liquid accumulates over pattern crests. The vertical line is $W_c=0.141$ (4.2) while the dashed line is the critical Weber number (3.13) re-expressed as a rotation rate ( $W_{cut} = \sqrt {(We_{c}/Bo}$).
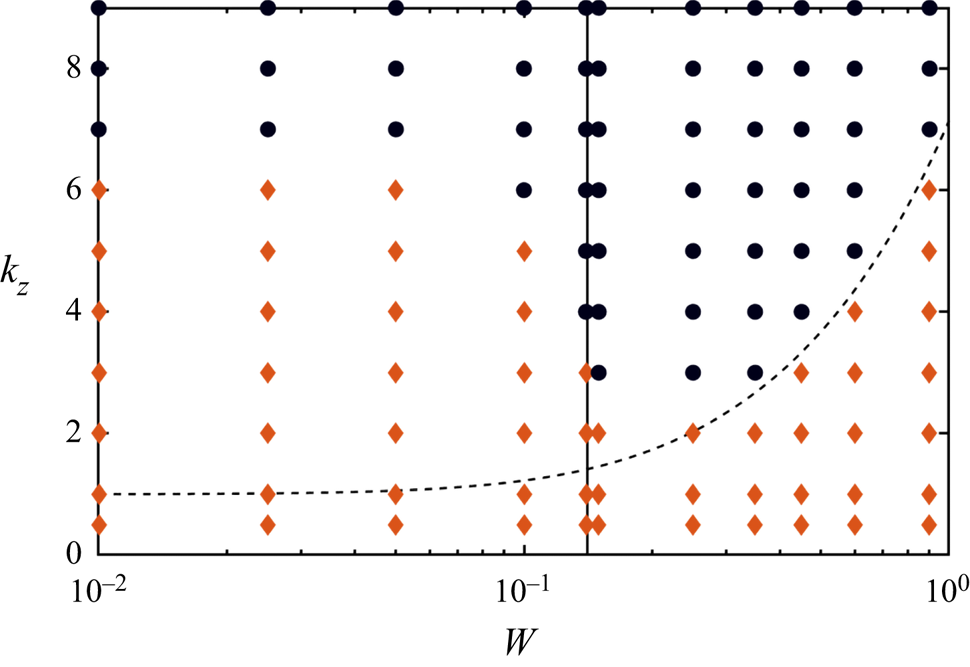
Figure 11 provides a regime map of coating behaviour on axially patterned cylinders. Black circles denote simulations where liquid accumulates in pattern troughs while red diamonds denote simulations where liquid accumulates over pattern crests. The dashed line denotes the rotation rate  $W_{cut}$ corresponding to the critical Weber number $We_c$ predicted in the absence of gravity (3.13), where $W_{cut} = \sqrt {We_{c}/Bo}$. The vertical line denotes the critical rotation rate $W_c$ that separates the RP and the RT regimes on unpatterned cylinders (4.2). For this set of parameters, $W_c =0.141$.
We examine the results of the parameter sweep for  $W>W_c$, which lies to the right of the vertical line in figure 11. Here, the competition between centrifugal forces and surface-tension forces determines the region of the cylinder where liquid accumulates. In this case, the boundary between the regimes predicted in the absence of gravity (3.13) is in excellent agreement with the boundary obtained from simulations.
Below the critical rotation rate, to the left of the vertical line in figure 11, the accumulation of liquid is controlled by the competition between gravitational forces and surface-tension forces. At low pattern wavenumbers, flows induced by gravity dominate over those induced by axial curvature of the cylinder, causing liquid to accumulate at pattern crests on the underside of the cylinder (in a manner similar to figure 13a). With increasing wavenumber  $k_z$, the axial curvature of the cylinder increases, and pressure gradients driving liquid toward pattern troughs become stronger. In the range $4\leq k_{z}\leq 6$, surface-tension forces are strong enough that liquid accumulates in the pattern troughs near the boundary between the RP and RT regimes, where gravitational forces acting on the coating are weaker. For $k_{z}\geq 7$, surface-tension forces drive liquid to the pattern troughs over all rotation rates explored. Note that when $W < W_c$, the agreement between the simulation results and (3.13) is not as good compared with when $W>W_c$. This is because (3.13) neglects gravity, which becomes increasingly important as $W$ decreases.
We present a representative simulation result in figure 12 to highlight how gravity may affect coating behaviour on an axially patterned cylinder ( $\beta =0.05$ and $k_{z} = 4$). At early times, gravity leads to the accumulation of liquid into lobes centred over crests in the axial topography (figure 12a,b). Over time, these lobes are dragged up the side of the cylinder and smoothed out by surface-tension forces, yielding the coating in figure 12(c). Subsequently, pressure gradients arising from the curvature of the cylinder drive liquid to the pattern troughs (figure 12d). Liquid continues to accumulate in the pattern troughs until small droplets form, and these droplets drain toward the underside of the cylinder (figure 12e, f).
The 3-D renderings obtained from a representative simulation for  $W=0.15$, which is greater than $W_c=0.141$ (4.2), on an axially patterned cylinder ( $k_{z}=4$ and $\beta =0.05$). Simulation parameters are $M=0.0695$, $\epsilon =0.07$ and $Bo=50$. Rescaled film thicknesses ( $\epsilon h$) are indicated by the colourbar.

When the rotation rate  $W$ is changed, the balance between surface-tension forces, centrifugal forces and gravitational forces may shift. In figure 13, 3-D renderings of simulations are shown for a fixed pattern wavenumber $k_z$ at two rotation rates $W$, one above and one below the value of $W$ used in figure 13. At the lowest rotation rate, gravity dominates and liquid accumulates into small droplets over pattern crests on the underside of the cylinder (figure 13a). Increasing the rotation rate moderately from figure 13(a) allows the coating to be supported for a short time, and surface-tension forces cause liquid to accumulate in small droplets in the pattern troughs as was observed in figure 12. At sufficiently large rotation rates, cylinder rotation again supports the coating for a short time, and centrifugal forces cause liquid to accumulate in rings centred over the pattern crests as shown in figure 13(b). For an increase in the rotation rate from figure 13(b), additional liquid may accumulate in the rings and lead to the formation of axially spaced droplets, similar to what is seen in figure 12( f) due to gravity or in figure 5(b) when centrifugal forces are sufficiently strong.
The 3-D renderings obtained from simulations for (a)  $W=0.10$ and (b) $W=0.90$ on an axially patterned cylinder ( $k_{z}=4$ and $\beta =0.05$). Other fixed simulation parameters are $M=0.0695$, $\epsilon =0.07$ and $Bo=50$. Rescaled film thicknesses ( $\epsilon h$) are indicated by the colourbar.

Computational limitations have prevented us from conducting a comprehensive parameter sweep, but we make a couple of observations based on limited simulations. In the RT regime ( $W < W_c$), a decrease in $Bo$ weakens gravitational forces relative to surface-tension forces, and liquid accumulates in pattern troughs at lower values of $k_z$. Also, in the RT regime, decreasing the characteristic film thickness $\epsilon$ decreases the mass of liquid on the cylinder. As a result, gravitational forces acting on the coating become weaker, and liquid accumulates in pattern troughs at lower values of $k_z$.
5. Flow visualization experiments
To complement the simulation results shown in the previous two sections, flow visualization experiments have been performed. We provide a description of the experimental set-up and then examine flows on axially patterned and angularly patterned cylinders.
5.1. Experimental method
The experimental apparatus is shown in figure 14. Topographically patterned cylinders were 3-D printed with an ABS (acrylonitrile butadiene styrene) filament at a resolution (layer height) of 0.2 mm along the cylinder axis and 0.05 mm around the circumference. Due to the layer-by-layer deposition of material while 3-D printing, the cylinders possessed a surface roughness of the order of the layer height. The amplitude of the topography  $b=\beta R_m$ was at least 100 times larger than the layer height, so features could be printed with a surface roughness much smaller than the topography. These cylinders are mounted to a shaft in a sealed chamber, where the cylinder is rotated using an electric motor and pulley system. A plastic barrier is mounted over the motor and pulley system to prevent injury.
Picture of the experimental apparatus. A pink background is mounted behind the cylinder to provide contrast between the background and blue-dyed liquid.

Prior to each experiment, the apparatus is levelled using a spirit level to a precision of  $3^{\circ }$. The cylinders are then coated with a blue-dyed glycerol-water mixture by rotating the cylinder in a partially filled chamber. Valves present behind the apparatus are opened to drain the contents of the chamber either by gravity or a peristaltic pump, leaving behind a coating. After many revolutions, the coating may become so thin in some regions that dry patches form and the experiments are ended. Occasionally, the experiments are restarted when air bubbles are entrained into the coating and dry patches form prematurely. Additionally, larger disturbances may drift axially over time due to imperfect levelling of the apparatus.
Experiments were carried out on axially patterned and angularly patterned cylinders of varying pattern wavelengths, pattern amplitudes and radii to explore the effects of the Weber number  $We$. Glycerol-water mixtures (95–96 wt% glycerol) were prepared and dyed with a small amount of blue food colouring. Surface tension and viscosity were measured using a Wilhelmy plate tensiometer and a Brookfield viscometer, respectively. The density was determined from tabulated data. Experimental conditions are summarized in table 3.
Experimental conditions for cylinder geometry and liquid properties.
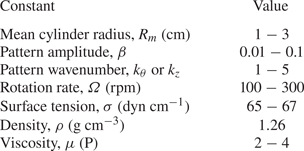
The expression for  $We$, shown in table 2, depends on the liquid density, surface tension, mean cylinder radius and rotation rate (in $\textrm {rad}\ \textrm {s}^{-1}$). In experiments, $We$ is varied by changing the cylinder's rotation rate. A critical rotation rate corresponding to the critical Weber number may be obtained from (3.13)
 \begin{equation} \varOmega_c = \sqrt{\frac{\sigma}{\rho R_m^3} (k_{\theta}^2+k_{z}^2-1)} . \end{equation}
We note that (5.1) is obtained from a long-wave analysis for a coating on a patterned cylinder in the absence of gravity (see § 3.1). However, the results of simulations presented in § 4.3 demonstrated that (5.1) will likely hold even in the presence of gravity, so long as the rotation rate is sufficiently large.
5.2. Results and discussion
For axially patterned cylinders ( $k_z \neq 0$ and $k_{\theta }=0$), the free surface on the upward-moving side of the cylinder is shown at different times below the critical rotation rate in figure 15(a,b) and above the critical rotation rate in figure 15(c,d). The darker and lighter blue regions of the coating correspond to thicker and thinner liquid films, respectively.
Free surface of the coating on the upward-moving side of an axially patterned cylinder ( $k_{z}=2$) at different times for (a,b) $We = 1.82$, $W = 0.314$ and (c,d) $We = 3.64$, $W = 0.445$ with $We_c = 3.00$, $Bo = 18.41$, $M = 0.128$ and $\beta = 0.15$. The critical rotation rate corresponding to $We_c=3.00$ is $\varOmega _c = 121$ rpm. The dark area at the bottom of the images is a shadow cast by the cylinder.

For  $\varOmega = 94$ rpm (figure 15a,b), liquid pools in the pattern troughs at early times, as is expected below the critical rotation rate (figures 4a and 11). Under the action of gravity, liquid in the troughs forms lobes on the upward-moving side of the cylinder (figure 15a). Over time, these disturbances drift axially to the left, but they are not shed under the action of gravity (figure 15b). The disturbance shown in figure 15(b) remains relatively unchanged over a few minutes until the end of the experiment, where dewetting occurs sporadically along the cylinder axis. In simulations of coating behaviour for the conditions reported for figures 15(a) and 15(b) (not shown here), an increase in the droplet mass in the pattern troughs led to the migration of droplets toward the pattern crests, as they are the lowest point on the cylinder. While this simulation might explain the migration of the droplets observed in figure 15(b), precise levelling of the apparatus is difficult, and droplet migration may be caused by a slight inclination of the apparatus.
Above the critical rotation rate, for  $\varOmega = 133$ rpm (figure 15c, d), liquid collects over the pattern crests, as is expected from the long-wave theory (see § 3.1) and simulation results (figures 4b and 11). Eventually, enough liquid collects over pattern crests that droplets form on the upward-moving side of the cylinder. Unlike the case of $\varOmega < \varOmega _c$, these droplets continue to grow over time and are occasionally shed. While the shedding of the droplets cannot be captured by our simulations, the continued growth of the droplets is captured in simulations above the critical Weber number (not shown here). After roughly one minute, dewetting occurs preferentially in the pattern troughs, where the coating thickness is smaller, and the experiments are ended.
From the expression for the critical rotation rate  $\varOmega _c$ (5.1), we expect liquid to move to the pattern troughs and crests, respectively, for $\varOmega -\varOmega _c < 0$ ( $We < We_c$) and $\varOmega -\varOmega _c > 0$ ( $We>We_c$), as was observed in § 3.1. On axially patterned cylinders, we test the validity of this prediction by conducting a series of flow visualization experiments for varying rotation rates $\varOmega$, mean cylinder radii $R_m$ and pattern wavenumbers $k_z$. The results of these experiments are summarized in figure 16, where $\varOmega -\varOmega _c$ is plotted against the axial pattern wavenumber. Experiments where liquid moves to pattern crests and troughs are denoted by the blue and red symbols, respectively, while experiments where the behaviour of each coating could not be clearly determined are denoted by the green symbols. Excellent agreement is observed between the predicted boundary separating the regimes, given by the dashed line at $\varOmega -\varOmega _c = 0$, and the experimentally observed boundary located between the blue circles and red squares in figure 16.
Experimentally observed regimes of coating behaviour on axially patterned cylinders (symbols) versus the theoretical cutoff between the regimes, given by the dashed line. Blue circles denote accumulation of liquid over pattern crests, and red squares denote accumulation of liquid in pattern troughs. Green diamonds denote conditions where the coating behaviour was unclear, or where it varied significantly over the cylinder. Excellent agreement is seen between the predicted boundary between the regimes and the experimentally observed boundary.

Flow visualization experiments have also been conducted to study coatings on angularly patterned cylinders, with a set of representative results shown in figure 17. At low rotation rates not shown in figure 17, the behaviour of the coating is similar to that observed on unpatterned cylinders, where small bands of liquid form near the outer edges of the cylinder and migrate toward the centre over time (Kovac & Balmer Reference Kovac and Balmer1980). At moderate rotation rates (figure 17a,b), small bands of liquid form near the outer edges of the cylinder. Visually, the coating changes little over time, and additional rings do not grow between the ends of the cylinder (figure 17b). The apparent absence of rings at moderate rotation rates is consistent with the LSA predictions, where the growth rate of rings is proportional to the rotation rate (3.3). As a result, the most uniform coatings in our experiments are found at moderate rotation rates, where the cylinder rotates fast enough to counteract gravitational drainage but slow enough to prevent significant disturbance growth.
Free surface of the coating on the upward-moving side of an angularly patterned cylinder ( $k_{\theta }=4$) at different times for (a,b) $We = 8.21$, $W = 0.445$ and (c,d) $We = 18.45$, $W = 0.667$ with $Bo = 41.43$, $M = 0.0695$ and $\beta = 0.05$. The critical Weber number for $k_{\theta }=4$ is $We_c=15$. The dark blue bar at the bottom of the image is leftover coating liquid which is kept in the apparatus for subsequent visualization experiments.

At larger rotation rates (figure 17c,d), axially spaced rings form along the length of the cylinder with fairly regular spacing, as was observed in simulations in § 4.2 (figure 10). The spacing between these rings typically decreases and the number of rings increases as the rotation rate increases. These rings may migrate after a few seconds and occasionally merge, leading to variations in the ring spacing along the cylinder length. Due to the accumulation of liquid in the rings and merging of the rings, gravity-induced droplets may form on the upward-moving side of the cylinder as was observed on axially patterned cylinders in figure 15(d).
In § 4.2, we noted that the predicted wavelength of the RP instability on an angularly patterned cylinder is identical to the one on an unpatterned cylinder (3.2). It was also observed that the spacing between rings obtained from simulations on angularly patterned cylinders is fairly close to the predicted wavelength of the RP instability (figure 8). Here, experiments have been conducted for varying cylinder radii  $R_m$, angular pattern wavenumbers $k_{\theta }$ and rotation rates $\varOmega$ (see table 3) at pattern amplitudes of $0.05\leq \beta \leq 0.1$ to explore the effects of the Weber number $We$ on the spacing of rings. The experimentally measured dimensionless ring spacing ( $\lambda ^{*}_{exp} = \lambda _{exp}/R_m$) is shown against the Weber number in figure 18, where red circles are the experimental results and the solid line is the predicted wavelength (3.2). Due to the migrating and merging of the rings, variations in the ring spacing are observed experimentally, as shown by the error bars in figure 18. The predicted value of the ring spacing, which is identical for unpatterned and angularly patterned cylinders, agrees quite well with the average, experimental ring spacing at each Weber number, providing additional evidence that the spacing between the rings is largely unaffected by the presence of angular topography.
Spacing between axially spaced rings on angularly patterned cylinders predicted by (3.2) (Evans et al. Reference Evans, Schwartz and Roy2005) ( $\lambda ^*_{RP}$; black line) compared to the average spacing measured in experiments ( $\lambda ^*_{{exp}}$; red circles). Error bars denote the standard deviation of the measured value. Good agreement is seen between the average spacing and the prediction.
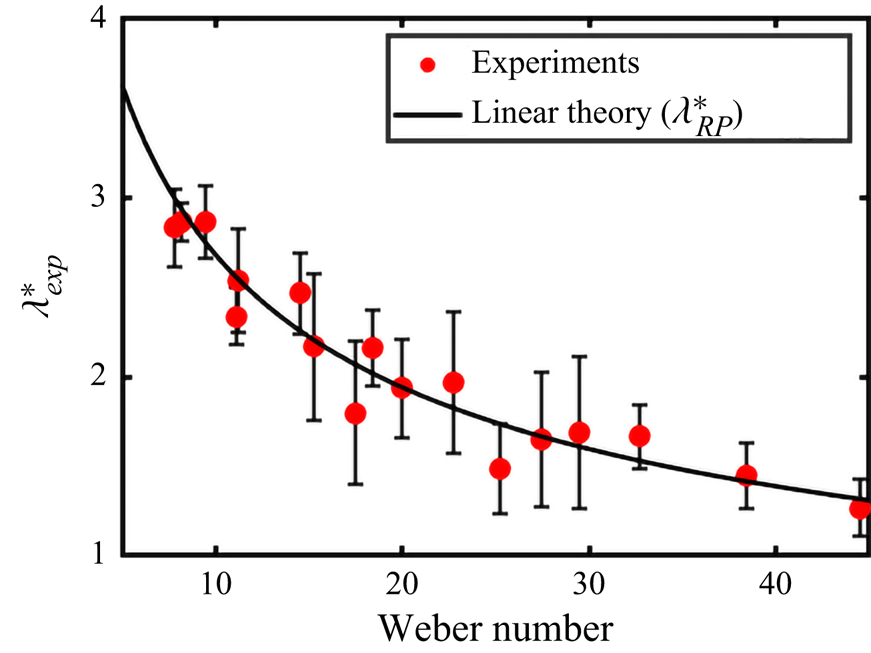
Lastly, we have investigated the behaviour of coatings at low rotation rates, where the coating sags and breaks up into axially spaced droplets under the action of gravity. Experiments are conducted on axially patterned and angularly patterned cylinders by lowering the rotation rate of the cylinder to trigger the formation of droplets, as was done in Evans et al. (Reference Evans, Schwartz and Roy2005). Representative examples of the free surfaces of the coating are shown in Appendix C. Here, we find that there is not a consistent difference in droplet spacing between unpatterned and patterned cylinders. This is consistent with the simulation results for flows on angularly patterned cylinders (figure 8), where the angular topography did not have a significant impact on droplet spacing. For axially patterned cylinders, simulations indicate that droplet spacing is controlled by the pattern wavelength (figure 11). This is not observed in the experiments, perhaps because the film thickness (which we cannot accurately measure) is much larger than the topography amplitude.
6. Conclusions
Liquid flow on the outside of rotating, topographically patterned cylinders serves as a useful model problem to study flows on the outside of objects that possess varying surface curvature. A lubrication-theory-based model describing flows on topographically patterned cylinders in three dimensions has been used to examine this problem. This study significantly extends prior work investigating flows on 2-D cross-sections of topographically patterned cylinders, where axial thickness variations and axial substrate curvature are neglected (Li et al. Reference Li, Carvalho and Kumar2017), and prior work examining flows on 3-D unpatterned cylinders (Yih & Kingman Reference Yih and Kingman1960; Moffatt Reference Moffatt1977; Preziosi & Joseph Reference Preziosi and Joseph1988; Evans et al. Reference Evans, Schwartz and Roy2005; Li & Kumar Reference Li and Kumar2018).
Above the critical rotation rate (1.1), axially spaced rings characteristic of the RP instability form on unpatterned cylinders with a spacing determined by the balance between centrifugal forces and surface-tension forces (Yih & Kingman Reference Yih and Kingman1960; Moffatt Reference Moffatt1977; Hynes Reference Hynes1978; Preziosi & Joseph Reference Preziosi and Joseph1988; Evans et al. Reference Evans, Schwartz and Roy2005; Li & Kumar Reference Li and Kumar2018). When gravity is neglected, the long-wave analysis and simulations for topographically patterned cylinders show that surface-tension and centrifugal forces cause liquid to accumulate over crests at high  $We$ or troughs at low $We$ (§ 3). In the absence of gravity, the resulting liquid ridges may break up into droplets with spacings similar to those predicted by LSA (§ 3, Appendix A and supplementary material). In the presence of gravity, the coating can sag, leading to the formation of axially spaced droplets or axially spaced rings on angularly patterned cylinders (§ 4.2) and axially patterned cylinders (§ 4.3). Regime maps are used to clearly define conditions where gravitational forces and surface-tension forces compete to determine coating behaviour ( $W < W_c$), and conditions where surface-tension forces and centrifugal forces compete to determine coating behaviour ( $W>W_c$).
Simulation results indicate that angular topography does not significantly alter the spacing of axial disturbances relative to what is observed on unpatterned cylinders (figure 8 and § 4.1). However, angular topography leads to the accumulation of liquid into thicker bands of liquid at early times (figure 10). As a result, the destabilizing effects of centrifugal forces at large rotation rates is stronger, which speeds up the growth of axially spaced rings (figure 9). A similar effect is observed at low rotation rates in the RT regime (Appendix B). At sufficiently large rotation rates, the spacing of rings on angularly patterned cylinders predicted by LSA (3.2) is found to agree well with the results of simulations (figure 8) and the results of flow visualization experiments (figure 18). In experiments, the most uniform coatings were observed at moderate rotation rates, where the growth rate of the rings is slow (3.3).
On axially patterned cylinders, simulation results indicate that the axial topography leads to the accumulation of liquid at either pattern crests or pattern troughs (§§ 3 and 4.3). Capillary-pressure gradients induced by the axial curvature of the cylinder drive liquid toward pattern troughs, while gravitational forces at low rotation rates and centrifugal forces at large rotation rates drive liquid toward pattern crests (figures 11–13). At large rotation rates, the expression for the critical Weber number obtained from the long-wave analysis ((3.13) or (5.1)) separating the capillary-dominated regime and the centrifugal-dominated regime was found to agree well with the results of simulations (figure 11) and flow visualization experiments (figure 16). In experiments examining the behaviour of coatings on axially patterned and angularly patterned cylinders at low rotation rates, neither type of patterning was found to have a reproducible effect on the behaviour of the coating or the spacing of droplets compared to those observed on unpatterned cylinders (Appendix C).
Based on the results of the long-wave analysis and the flow visualization experiments, it would be difficult to completely prevent the undesired growth of disturbances without solidifying the coating. Here, the long-wave analysis and LSA provide a means to estimate the time ((3.11) and (3.3)) available to solidify the coating before large disturbances grow. Additionally, the present work provides a foundation for future work aimed at understanding how the finite length of discrete objects (e.g. Kang, Nadim & Chugunova Reference Kang, Nadim and Chugunova2016, Reference Kang, Nadim and Chugunova2017) and rotation about other axes influence coating uniformity.
Supplementary material
Supplementary material is available at https://doi.org/10.1017/jfm.2021.224.
Acknowledgements
This work was supported through the Industrial Partnership for Research in Interfacial and Materials Engineering of the University of Minnesota and PPG Industries, Inc. We are grateful to the Minnesota Supercomputing Institute (MSI) at the University of Minnesota for providing computational resources. We thank Wieslaw Suszynski for assistance with the experiments.
Declaration of interests
The authors report no conflicts of interest.
Appendix A. Rapidly rotating cylinder: angular and screw-shaped patterning
Here, we present a few results from simulations on angularly patterned and screw-shaped cylinders above the critical Weber number  $We_c$ (3.13) in the absence of gravity. Below the critical Weber number, liquid accumulates in pattern troughs, forming ridges of liquid that are aligned with grooves in the topography. Much like the results shown for axially patterned cylinders (figure 5a), the ridges do not break up along their length when gravity is neglected, most likely due to the stabilizing effect of surface tension. Above $We_c$, we explore the behaviour of coatings on angularly patterned and screw-shaped cylinders in more detail. Simulations were conducted with purely angular patterning ( $k_{\theta }=4$ and $k_{z}=0$) and screw-shaped patterning ( $k_{\theta }=3$ and $k_{z}=3$) for $We=20$ (above $We_c=15$ and $We_c=17$, respectively). At moderate times ( $t=1\times 10^{4}$), 3-D renderings of coatings for these simulations are shown in figure 19. Liquid pools over the pattern crests for both angular patterning (figure 19a) and screw-shaped patterning (figure 19b), as is expected from the linear theory.
The 3-D renderings obtained from simulations with  $We=20$, $\epsilon =0.01$ and $\beta = 10^{-3}$ at $t=1\times 10^{4}$ for (a) $k_{\theta }=4$, $k_{z}=0$ and (b) $k_{\theta }=3$, $k_{z}=3$. Rescaled film thicknesses ( $\epsilon h$) are indicated by the colourbar. Note that the $z$-axis is not shown to scale.
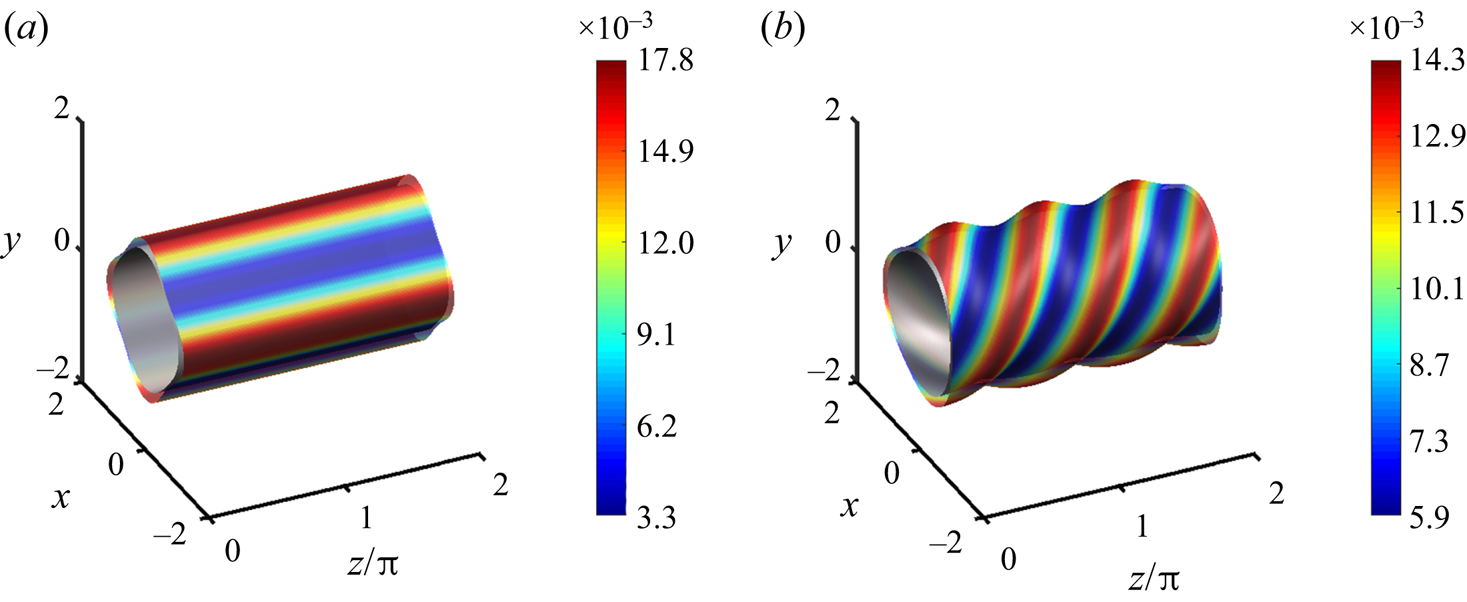
At later times, the bands of liquid over the pattern crests break up into regularly spaced droplets, as was observed on axially patterned cylinders in figure 5(b). To explore this, coatings obtained from the simulations shown in figure 19 are unravelled by plotting the coating thickness against the angular and axial coordinates at  $t=1\times 10^{6}$. Dashed lines denoting the crests in cylinder topography are overlaid with the thicknesses shown in figures 20(a) and 20(b). For the angularly patterned cylinder (figure 20a), the angularly spaced bands of liquid observed in figure 19(a) break up into axially spaced droplets with fairly regular spacing. The axial spacing of the droplets $\lambda _{sim}=2.094$ is similar to that predicted for the RP disturbance on unpatterned cylinders $\lambda _{RP} = 1.939$ (3.2). For the simulation shown in figures 19(a) and 20(a), the simulation has been carried out to $t=2.0\times 10^{6}$, and the droplets shown in figure 20(a) do not merge.
The 3-D renderings of coatings for  $We = 20$, $\epsilon =0.01$, and $\beta = 10^{-3}$ at $t = 1.0\times 10^{6}$ on (a) an angularly patterned cylinder ( $k_{\theta }=4$, $k_z=0$) and (b) a screw-shaped cylinder ( $k_{\theta }=3$, $k_z=3$). The Weber number is above the critical Weber number in both cases. Rescaled film thicknesses ( $\epsilon h$) are indicated by the colourbars. Dashed black lines are used to denote the position of pattern crests in either the angular patterned or screw-shaped cylinders.
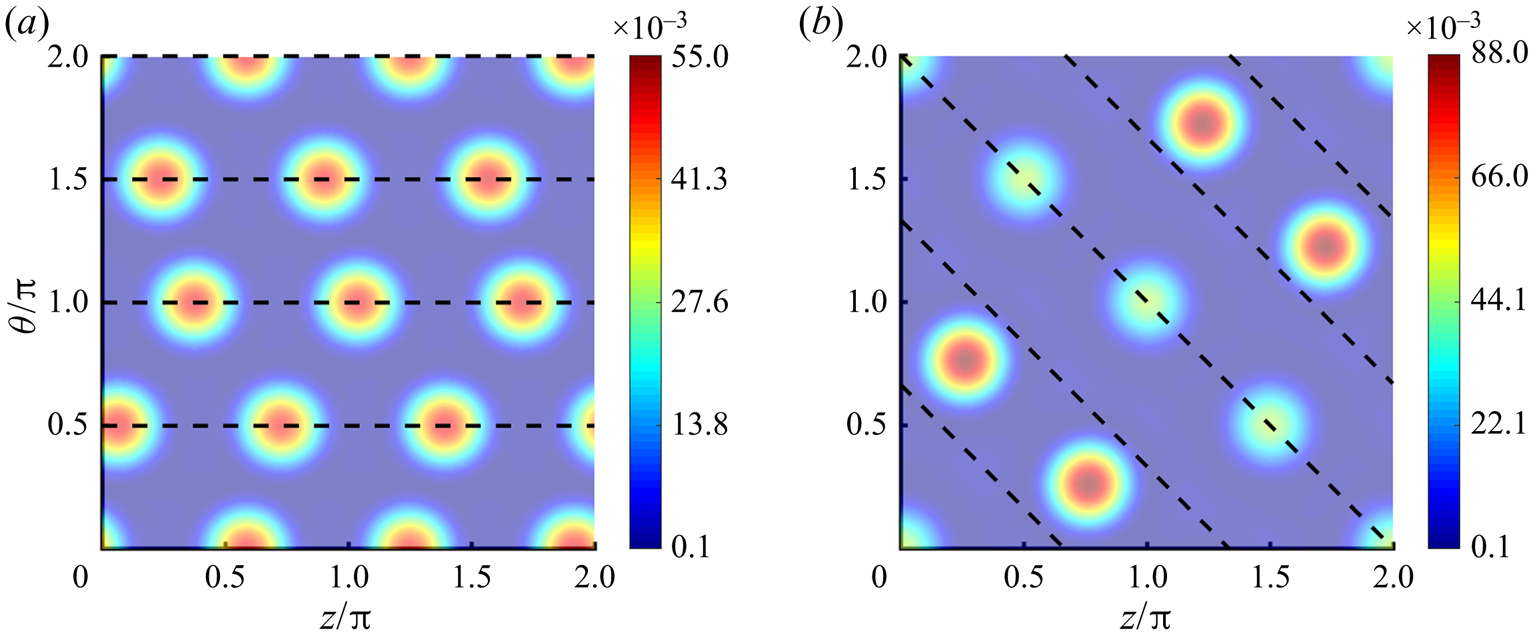
For the screw-shaped cylinder (figure 20b), the bands of liquid aligned over the pattern crests, denoted by the dashed black lines, continue to grow. Prior to the time depicted in figure 20(b), these bands of liquid break up into regularly spaced droplets that are aligned over the pattern crests. The axial and angular spacing of these droplets prior to merging correspond to wavenumbers  $l_{\theta }=l_{z}=4$, where $l_{\theta }^2+l_{z}^2=32$. This is greater than the most dangerous wavenumbers $l_{\theta ,m}$ and $l_{z,m}$ predicted by LSA, given by $l_{\theta ,m}^2 + l_{z,m}^2 = (1+We)/2=10.5$ (see supplementary material). This disagreement may arise from the frozen-base-state assumption made in LSA or from nonlinear effects not accounted for by LSA.
Over time, a handful of the droplets migrate and merge, yielding three bands of droplets with varying size and spacing (figure 20b). Note that due to periodicity in the axial and angular directions, the droplets at the four corners of figure 20(b) are four quadrants of a single droplet. The instability of the coatings for  $We>We_c$ in figures 20(a) and figure 20(b) is due to the destabilizing effect of centrifugal forces, which leads to the growth of droplets over pattern crests.
Appendix B. Angular patterning: RT regime
At low rotation rates ( $W < W_c$, (4.2)), gravity causes the coating to sag to the underside of the cylinder, where it forms a ridge of liquid along the cylinder axis. In the absence of topography, this ridge is unstable to axial disturbances and may form axially spaced droplets or fingers of liquid (RT instability) (Evans et al. Reference Evans, Schwartz and Roy2005). The spacing of these droplets on unpatterned cylinders tends to be larger than the predicted spacing of the RT disturbance on the underside of a flat plate (4.3) and varies negligibly with the rotation rate $W$ (figure 7). Additionally, the spacing is not significantly affected by angular topography (figure 8).
However, the growth rate of droplets on rotating cylinders may be affected by angular topography. It was shown in figure 9 that axially spaced rings may form faster at large rotation rates ( $W>W_c$) when the cylinder's angular curvature varies. To explore this in the RT regime ( $W < W_c$), we examine the results of simulations for flows on angularly patterned cylinders of fixed wavenumber ( $k_{\theta }=3$) and varying pattern amplitudes $\beta$.
In figure 21, renderings of coatings on angularly patterned cylinders of varying pattern amplitude are shown at two times. Ridges of liquid have formed on the cylinders at early times, as shown in figures 21(a)–21(c). These ridges break up into axially spaced droplets at later times (as shown in figure 21d–f) due to the destabilizing effect of gravity. Changes in the average spacing of the droplets with pattern amplitude are not systematic – the average disturbance spacing obtained from simulations is  $\lambda ^{*}_{sim} = 1.834$, $1.847$, $1.950$ and $1.645$ for $\beta = 0$, $10^{-3}$, $10^{-2}$ and $10^{-1}$, respectively. These are all greater than the predicted wavelength of the RT instability on a flat plate of $\lambda ^{*}_{RT}=1.28$ (4.3). Note that the largest pattern amplitude $\beta =10^{-1}$ is 10 times the film thickness ( $\beta /\epsilon =10$). These results suggest that topography amplitude exerts a weak effect on the spacing of droplets on angularly patterned cylinders, as was shown for thicker coatings in figure 8.
The 3-D renderings obtained from simulations on angularly patterned cylinders ( $k_{\theta } = 3$) with $W = 3\times 10^{-3}$, $M=0.063$, $\epsilon =0.01$ and $Bo=48$ such that $MW/\epsilon ^2<2.001$. Times shown are (a–c) $t = 50$ and (d–f) $t = 200$. Topography amplitudes are (a,d) $\beta = 10^{-3}$, (b,e) $\beta = 10^{-2}$, and (c,f) $\beta = 10^{-1}$. Rescaled film thicknesses ( $\epsilon h$) are indicated by the colourbars. The average dimensionless spacing between droplets is $\lambda ^{*}_{sim} = 1.847$, $1.950$ and $1.645$ in order of increasing pattern amplitude $\beta$.

The effect of angular topography amplitude on the rate at which axial thickness disturbances grow at low rotation rates cannot be clearly determined from figure 21. To better examine this effect, the normalized maximum axial thickness variation across the cylinder ( $\alpha ^{-1}(\Delta h)_{max}$) over time is calculated from the simulation results. In figure 22, $(\Delta h)_{max}$ is given on a logarithmic scale for simulations of varying topography amplitude ( $0\leq \beta \leq 10^{-1}$) and fixed topography wavenumber ( $k_{\theta }=3$). A rapid increase in $(\Delta h)_{max}$ is observed at early times ( $t<10$) for all topography amplitudes as a ridge of liquid forms on the upward-moving side of the cylinder. Over time, axial disturbances in the liquid ridge grow exponentially until $(\Delta h)_{max}$ plateaus, indicating droplet formation is complete. The plateau in $(\Delta h)_{max}$ is observed near $t=75$ when $\beta =10^{-1}$ as opposed to near $t=150$ for $0\leq \beta \leq 10^{-2}$.
Normalized maximum axial thickness variation  $\alpha ^{-1}(\Delta h)_{max}$ over time for varying pattern amplitudes $0\leq \beta \leq 10^{-1}$ on angularly patterned cylinders with $k_{\theta }=3$ and $\alpha =10^{-3}$ (see (4.1)). Other parameter values are the same as in figure 21. Oscillations in $(\Delta h)_{max}$ are present for $\beta =10^{-2}$ (green line) and become a prominent feature of the disturbances for $\beta =10^{-1}$ (pink line).

Oscillations in  $(\Delta h)_{max}$ may be observed with an increase in pattern amplitude ( $\beta = 10^{-2}$ and $10^{-1}$) and are a prominent feature of $(\Delta h)_{max}$ for the largest pattern amplitude $\beta =10^{-1}$, which is 10 times larger than the film thickness ( $\beta /\epsilon = 10$). Note that the period of these oscillations is approximately equal to the period with which a crest in the topography passes the ridge of liquid on the upward-moving side of the cylinder ( $2{\rm \pi} M^{-1}W^{-1}\epsilon ^{2}k_{\theta }^{-1}$). The oscillations are not discontinuous; one period consists of at least 10 000 time steps.
The quantitative effect of the topography amplitude  $\beta$ on the growth rate of the instability observed in simulations $\omega _{sim}$ may be obtained from figure 22 by calculating the slope of $\log _{10}((\Delta h)_{max})$ versus time in the region after ridge formation but before the plateau. The growth rate $\omega _{sim}$ at small pattern amplitudes ( $0\leq \beta \leq 10^{-2}$) varies non-systematically between $\omega _{sim}=3.11\times 10^{-2}$ and $3.15\times 10^{-2}$. At the largest pattern amplitude, however, the growth rate nearly doubles to $\omega _{sim}=5.82\times 10^{-2}$, indicating that the growth rate of the instability is not strongly affected by angular topography unless the topography amplitude is large. Evidently in the RT regime, the topography amplitude needs to be larger to see a significant change in the growth rate, relative to what is observed in the RP regime (figure 9), likely due to the greater importance of gravitational forces in the RT regime.
Appendix C. Rayleigh–Taylor experiments
At low rotation rates, hanging droplets may form on the underside of rotating, topographically patterned cylinders, as has been observed in our flow visualization experiments. A representative set of images obtained from these experiments is shown in figure 23 for an unpatterned circular cylinder (figure 23a) and an angularly patterned cylinder (figure 23b). For this set of experiments, the difference in the spacing between the droplets, shown in the figure caption, is statistically insignificant. The same behaviour is observed for flows on axially patterned cylinders.
Free surface of the coating on the upward-moving side of 3-D printed cylinders for (a) an unpatterned cylinder ( $\beta =0$) and (b) an angularly patterned cylinder ( $\beta =0.09$ and $k_{\theta }=5$) with $We = 0.531$, $W = 0.085$, $Bo = 73.65$ and $M = 0.0452$. The spacing between the droplets is (a) $\lambda /R_m = 0.992\pm 0.167$ and (b) $\lambda /R_m = 1.02\pm 0.23$. The dark blue bar at the bottom of the image is leftover coating liquid which is kept in the apparatus for subsequent visualization experiments.


 Open access