


Introduction
Through their intimate association with hosts, parasites are not only important mediators of natural and sexual selection (Clayton et al., Reference Clayton, Lee, Tompkins and Brodie1999; Dougherty et al., Reference Dougherty, Rovenolt, Luyet, Jokela and Stephenson2023), but also play important roles in shaping community composition and ecosystem ecology (Hudson et al., Reference Hudson, Dobson and Lafferty2006). Despite arguably representing the most common metazoan lifestyle (Poulin and Morand, Reference Poulin and Morand2000), parasites remain one of the most neglected objects of study (Carlson et al., Reference Carlson, Dallas, Alexander, Phelan and Phillips2020), likely due to their size and cryptic habits. As a consequence, relatively little remains known about their distribution and ecology. Yet, such insights may be crucial to a full understanding of the impacts of current anthropogenic environmental change, both on vulnerable host species and ecosystems.
Ticks are specialized ectoparasites that can impose a range of direct costs to reproductive success and survival of their hosts. Tick infestation is often closely associated with reduced host body condition index (BCI) in wild populations (Kwak et al., Reference Kwak, Hitch, Borthwick, Low, Markowsky, McInnes, Smith, Nakao and Mendenhall2023). This relationship may be causal: experimental manipulation under field conditions showed that infestation with tick Argas cooleyi could result in up to 65% nestling mortality through anaemia, reductions in body mass and early fledging (Chapman and George, Reference Chapman, George, Zuk and Loye1991). Indeed, meta-analysis of manipulative studies has shown clear fitness impacts at the population level (Watson, Reference Watson2013). Other direct fitness costs include paralysis due to toxins (Pienaar et al., Reference Pienaar, Neitz and Mans2018), damage to the skin, feathers or fur (McLaughlin and Addison, Reference McLaughlin and Addison1986; Buczek et al., Reference Buczek, Buczek, Bartosik and Buczek2020) and expenditure on host defence such as grooming (Lehmann, Reference Lehmann1993). The prevalence and intensity of infestation is often not homogenous: ticks' host preferences may be influenced by factors such as host sex (Kwak et al., Reference Kwak, Hitch, Borthwick, Low, Markowsky, McInnes, Smith, Nakao and Mendenhall2023), age (Jones et al., Reference Jones, Brunner, Scoles and Owen2015) and reproductive state (Pollock et al., Reference Pollock, Vredevoe and Taylor2012; Sándor et al., Reference Sándor, Corduneanu, Péter, Mihalca, Barti, Csősz, Szőke and Hornok2019). The optimal level of virulence – the extent to which host fitness is reduced by a parasite – may be relatively high for nest- and roost-inhabiting ticks given their reduced dependence on individual hosts (Lehmann, Reference Lehmann1993; but see Watson, Reference Watson2013).
Ticks can also impose indirect costs as vectors of tick-borne viruses, bacteria and protozoa affecting both humans and wildlife, some of which can be deadly to their hosts (Evans et al., Reference Evans, Bown, Timofte, Simpson and Birtles2009; Baneth, Reference Baneth2014; Brackney and Armstrong, Reference Brackney and Armstrong2016; Sarwar, Reference Sarwar2017). Numerous pathogenic microbial genera have also been identified in recent years in Australian ticks, including the globally important genus Borrelia (i.e. ‘Candidatus Borrelia tachyglossi’) (Egan et al., Reference Egan, Loh, Banks, Gillett, Ahlstrom, Ryan, Irwin and Oskam2020). New Australian tick species continue to be discovered too (e.g. Ixodes woyliei, I. healthi and I. laridis) (Ash et al., Reference Ash, Elliot, Godfrey, Burmej, Abdad, Northover, Wayne, Morris, Clode, Lymbery and Thompson2017; Heath and Palma, Reference Heath and Palma2017; Kwak et al., Reference Kwak, Somerville and van Nunen2018a, Reference Kwak, Madden and Wicker2018b). The One Health risks posed by ticks to wildlife and humans are also increasing as novel tick-borne pathogens emerge and geographic range shifts occur in some tick species (Paules et al., Reference Paules, Marston, Bloom and Fauci2018). Such range shifts can be driven by a variety of ecological factors including habitat changes, host availability and climate (Alkishe et al., Reference Alkishe, Peterson and Samy2017; Borşan et al., Reference Borşan, Toma-Naic, Péter, Sándor, Peștean and Mihalca2020). Pathogen spillover between host species is also largely driven by ecological factors (Ostfeld et al., Reference Ostfeld, Levi, Keesing, Oggenfuss and Canham2018). Therefore, studying the relationship between ticks and ecological factors is key to understanding spillover risk between bat species and from ticks to humans.
Two Australian argasids, Ornithodoros capensis and O. gurneyi, have been recorded parasitizing a wide range of wildlife species and have been reported to cause disease in humans (Kwak, Reference Kwak2018). Ornithodoros capensis bites have been associated with blistering and lesions (Humphery-Smith et al., Reference Humphery-Smith, Thong, Moorhouse, Creevey, Gauci and Stone1991). Though little is known about the ecology of the bat tick Argas dewae, it has previously been collected from a human (Kaiser and Hoogstraal, Reference Kaiser and Hoogstraal1974). Recently, Rickettsia japonica [which is known to cause disease in humans (Mahara, Reference Mahara1997)] was also identified within A. dewae (Izzard et al., Reference Izzard, Chung, Hotopp, Vincent, Paris, Graves and Stenos2018). This suggests that R. japonica may act as a pathogen within bat communities, particularly if it moves into naïve populations via ticks. It also suggests that R. japonica could impact public health in the future if spillover from bats to humans occurred via A. dewae as many Australian insectivorous bats roost within man-made structures such as houses (Sanderson et al., Reference Sanderson, Jaeger, Bonner and Jansen2006). However, foundational information about A. dewae, such as phenological profiles and host specificity, is needed to construct ecological baselines for bat ticks. Without such data, it is impossible to detect changes in the distribution and phenology of bat ticks, or to understand the ecological drivers which underpin disease risk in bats and humans. Hence, this paper presents key ecological data for A. dewae which includes one of the locations [Organ Pipes National Park (OPNP)] at which Izzard et al. (Reference Izzard, Chung, Hotopp, Vincent, Paris, Graves and Stenos2018) identified this species as carrying R. japonica.
To elucidate the ecology of A. dewae, populations from 2 bat hosts (Gould's wattled bat Chalinolobus gouldii and white-striped free-tailed bat Austronomus australis) were surveyed. Data were collected from bats roosting in bat boxes at 3 sites across Melbourne, south-eastern Australia, for 28 months (July 2005–December 2007). Both hosts are tree-roosting insectivorous bat species that are common across south-eastern Australia (Churchill, Reference Churchill2008), including in urban areas (Griffiths et al., Reference Griffiths, Lumsden, Robert and Lentini2020). This study investigated phenological trends to assess the impact of traits of the 2 bat hosts on tick infestation rate and load. In addition, new host records for A. dewae, along with new distribution records, are reported.
Materials and methods
Study sites
Ticks found on C. gouldii and A. australis were studied at 3 sites across Greater Melbourne, Victoria, Australia. Gresswell Nature Conservation Reserve (Gresswell NCR), located ~13 km north east of the Melbourne CBD (−37.711461, 145.071491), is a 52 ha river red gum (Eucalyptus camaldulensis) grassy woodland. The site is degraded as a result of the surrounding urbanization and has a limited number of large, hollow-bearing trees (Godinho et al., Reference Godinho, Lumsden, Coulson and Griffiths2020). To compensate for the limited number of tree hollows, nest boxes were installed in 1998 by members of the La Trobe University Wildlife Sanctuary (Griffiths et al., Reference Griffiths, Bender, Godinho, Lentini, Lumsden and Robert2017); 26 of these boxes are of a bat-specific design (Evans and Lumsden, Reference Evans, Lumsden, Law, Eby, Lunney and Lumsden2011; Godinho et al., Reference Godinho, Lumsden, Coulson and Griffiths2015), and since 2005 have been monitored intermittently as part of larger, ongoing study (Griffiths et al., Reference Griffiths, Lumsden, Robert and Lentini2020). OPNP, located ~20 km north-west of the centre of Melbourne (−37.669666, 144.770127), is an 85 ha site that was predominately cleared farmland until preserved as a park in 1972, and then revegetated (Edwards, Reference Edwards1974). The majority of trees are <45 years old and lack tree hollows (Bender, Reference Bender, Law, Eby, Lunney and Lumsden2011). The vegetation is mainly river red gum, with scattered manna gum (Eucalyptus viminalis) and an understory of Acacia spp. and grasses (Irvine and Bender, Reference Irvine and Bender1997). Thirty-seven bat boxes were installed by The Friends of OPNP community group within the riparian zone of Jacksons Creek at OPNP, commencing in 1992, and have since been monitored regularly as part of a larger study (Griffiths et al., Reference Griffiths, Lentini, Bender, Irvine, Godinho, Visintin, Eastick, Robert and Lumsden2019). Wilson Reserve, located ~9 km east of the centre of Melbourne (−37.779129, 145.046579), is a 35 ha reserve bordered by a golf course, sporting fields and residential housing. Like the other sites, it is dominated by river red gum, with a shrubby understory including Acacia spp. Revegetation of this site began in the 1970s, and the Eucalyptus trees that were planted have not yet formed hollows. There are, however, several remnant hollow-bearing trees present in the riparian zone (Griffiths et al., Reference Griffiths, Bender, Godinho, Lentini, Lumsden and Robert2017). Twenty bat boxes were installed by The Friends of Wilson Reserve community group, commencing in 2000, and since 2005 have been monitored regularly as part of a larger study (Godinho et al., Reference Godinho, Lumsden, Coulson and Griffiths2020).
At all 3 sites, any bats occupying the bat boxes were examined on a monthly basis for the presence and abundance of ectoparasites. Monitoring began in winter and spring 2005 at OPNP and Gresswell NCR, respectively, and in spring 2006 at Wilson Reserve. Monitoring ceased at all sites by December 2007. A total of 2148 Gould's wattled bats and 226 white-striped free-tailed bats were sampled for ectoparasites during this period, which included recaptures of marked individuals [Gould's wattled bats – bat bands or Passive Implantable Transponder (PIT) tags (microchips), white-striped free-tailed bats – PIT tags]. Two other bat species were recorded occupying bat boxes, chocolate wattled bat (Chalinolobus morio) and large forest bat (Vespadelus darlingtoni), however they were not included in this study.
Identification
During each bat box survey, the number of parasites on each bat host (i.e. the parasite load) captured in a bat box was recorded. Tick prevalence (the proportion of the bat host population carrying the parasite; Bush et al., Reference Bush, Lafferty, Lotz and Shostak1997) was calculated. A sample of ticks were removed from bat hosts using tweezers and fixed in 70% ethanol. Species identification was done using a Leica M205C stereomicroscope and morphological characters based on descriptions by Kaiser and Hoogstraal (Reference Kaiser and Hoogstraal1974) and Kohls and Hoogstraal (Reference Kohls and Hoogstraal1962). For all bats captured, the individual's sex, age, forearm length and weight was recorded.
Data analysis
Data were analysed using R version 4.2.1 (R Core Team, 2022). Distributions of macroparasites across hosts follow a count distribution but often are overdispersed due to zero inflation: the majority of parasites are shared amongst a small number of hosts (e.g. Luguterah and Lawer, Reference Luguterah and Lawer2015). Consequently, the data were examined using zero-inflated negative binomial mixture models (ZINB) using the package ‘pscl’ (Zeileis et al., Reference Zeileis, Kleiber and Jackman2008). The advantage of these models is that they separately model the processes that lead to excess zeroes, resulting improved inference about the ecological factors that drive individual parasite burdens (i.e. abundance; Rhodes, Reference Rhodes, Fox, Negrete-Yankelevich and Sosa2015). The numbers of A. dewae ticks found on Gould's wattled bats across the 3 sites were examined. At 2 of the 3 sites (Gresswell National Conservation Reserves and OPNP), bats sampled were individually tagged (with bat bands or microchips) to determine the extent to which individual identity affected parasite burden (see Results section). At Wilson Reserve, individuals were not tagged, so each capture had to be treated as independent.
To assess the influence of repeated measures on re-captured individuals, the correlation of parasite load within individuals across time was measured using an intraclass correlation coefficient (icc) using the package ‘irr’. This value varies from 0 to 1, with 0 indicating larger variation within individuals and lower variation between individuals. A jackknifing approach was used to repeatedly (n = 1000) select several observations at random from the individuals with at least that number of captures, which allowed us to examine the mean correlation coefficient with more confidence. This indicated that individual identity was a poor predictor of tick load (see Results section). Consequently, repeated capture data were treated as independent observations in subsequent modelling, obviating the need for mixed-effects models using bat identity as a random factor.
The variables included in our ZINB model were site (Gresswell NCR, OPNP and Wilson Reserve), bioseason [the ‘warm season foraging period’ (WSFP, October–April), during which C. gouldii spend most of their time foraging and are rarely in torpor; the ‘torpor period’ (TP, May–August), during which most bats go into torpor and are rarely active; and the ‘post-torpor emergence period’ (PTEP, September), during which bats emerge from their winter torpor and disperse to a range of other roost sites], age (adult or juvenile) and sex of the bats (male or female). Adults were distinguished from juveniles (young of the year) by fusion of the metacarpal–phalangeal joints (Racey, Reference Racey1974). An interaction between sex and bioseason was also included as significant behavioural differences are likely during different phases of the year, although the interaction was dropped for the logistic component of the model due to lack of significance. Additionally, BCI (using residuals of a least-squares regression of body mass and forearm length based on Schulte-Hostedde et al., Reference Schulte-Hostedde, Zinner, Millar and Hickling2005), and mean monthly maximum temperature were included as covariates. Temperature data represent mean monthly maximum temperatures from the nearest weather station to each site [OPNP: 086282 Melbourne Airport; Gresswell: 086351 Bundoora (Latrobe University); Wilson: 086068 Viewbank]. Post-hoc testing was conducted using the package ‘emmeans’. Male reproductive states were determined by examining the scrotal region for the presence of visible testes (Churchill, Reference Churchill2008). Female reproductive states were determined by examining the nipple for evidence of current or past lactation and gently palpating the abdomen for unborn young (Churchill, Reference Churchill2008). Eight categories, 4 in each sex, were recognized [females LA – lactating, PL – post-lactating, PP – pre-parous or pre-breeding, PX – pregnant; males TA – testes abdominal, TP – testes partially descended, TD – testes fully descended, TR – testes regressed (Churchill, Reference Churchill2008)], but this variable could not be included in the overall model given skew in numbers and confounding over seasons.
Museum specimens
To assess the host range and distribution of A. dewae, one of the authors (M. L. K.) visited the Australian National Insect Collection (ANIC) and examined A. dewae specimens held there. New host and distribution records were recorded and are reported in the Results section of this paper.
Nomenclature
Within this study, we elect to use the classification system and nomenclature for the Argasidae referred to as ‘The American school’ (senu Mans et al., Reference Mans, Kelava, Pienaar, Featherston, de Castro, Quetglas, Reeves, Durden, Miller, Laverty and Shao2021). Although alternative classification systems have been proposed, we avoid the use of these, as the overall correct classification of the Argasidae remains very unclear and many of these newer systems only serve to complicate and confuse, given that few are based on robust datasets. The most recent of these is by Mans et al. (Reference Mans, Kelava, Pienaar, Featherston, de Castro, Quetglas, Reeves, Durden, Miller, Laverty and Shao2021) which is based on an extremely small number of loci (mitochondrial genomes and 2 nuclear markers), which do not always provide reliable estimates in deeply diverged ancient clades, like the Argasidae. In comparison, robust phylogenies such as that by Misof et al. (Reference Misof, Liu, Meusemann, Peters, Donath, Mayer, Frandsen, Ware, Flouri, Beutel and Niehuis2014) for the insects, which utilized 1478 protein-coding genes, provide far more reliable estimates. The study by Mans et al. (Reference Mans, Kelava, Pienaar, Featherston, de Castro, Quetglas, Reeves, Durden, Miller, Laverty and Shao2021) also included <25% of species in the family Argasidae, and did not adequately correct for the problem of long-branch attraction which is sometimes responsible for erroneous interpretations in phylogenomic trees. Undoubtedly, the nomenclature and classification of the Argasidae will change in coming decades as multiple instances of paraphyly are detected within ‘The American school’ system. However, when the Argasidae are correctly reclassified based on robust phylogenomics utilizing hundreds of genes with good levels of sampling (e.g. 75% of species), we may then adopt such a system. At the present time, studies like that of Mans et al. (Reference Mans, Kelava, Pienaar, Featherston, de Castro, Quetglas, Reeves, Durden, Miller, Laverty and Shao2021) provide very weak support for major changes to the classification of the Argasidae and as such we choose not to accept this until stronger evidence is provided in support of this system. In this study, we elect to refer to the taxon under examination as A. dewae rather than Carios dewae.
Results
Phenology and ecology
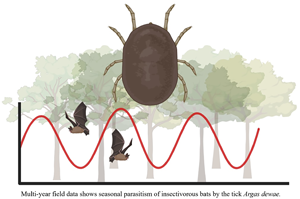
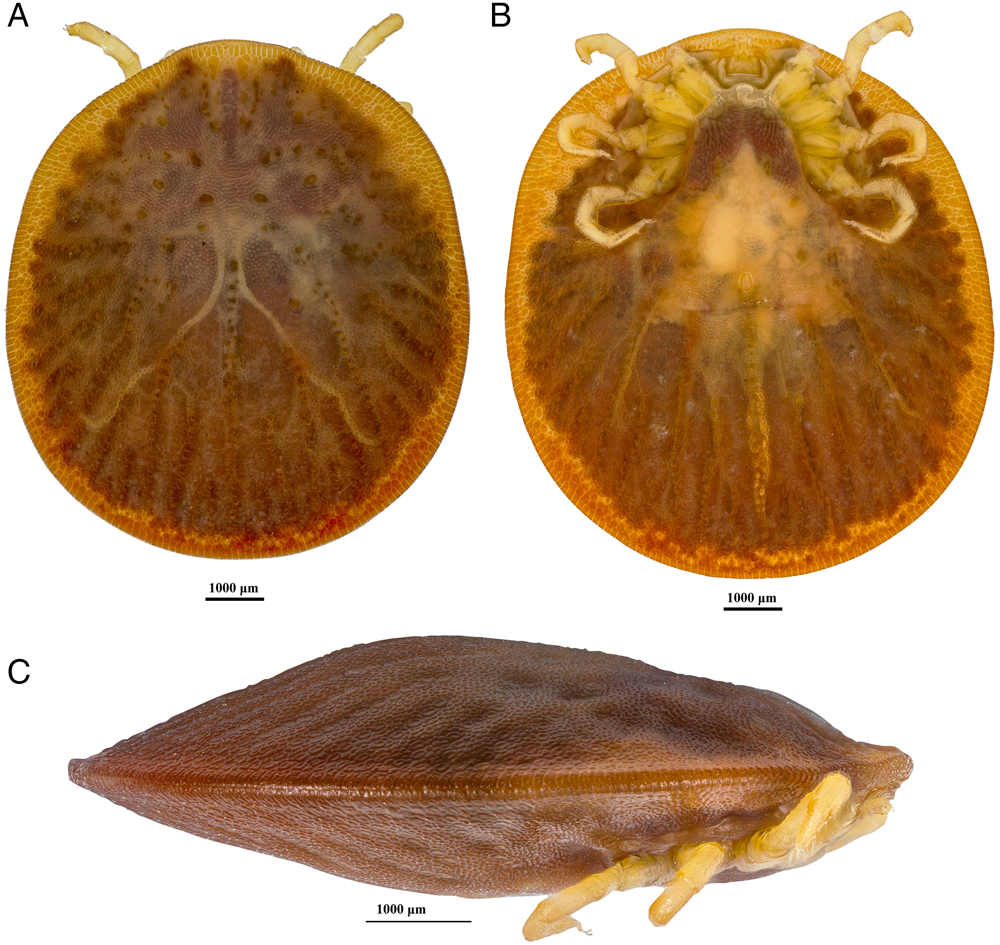
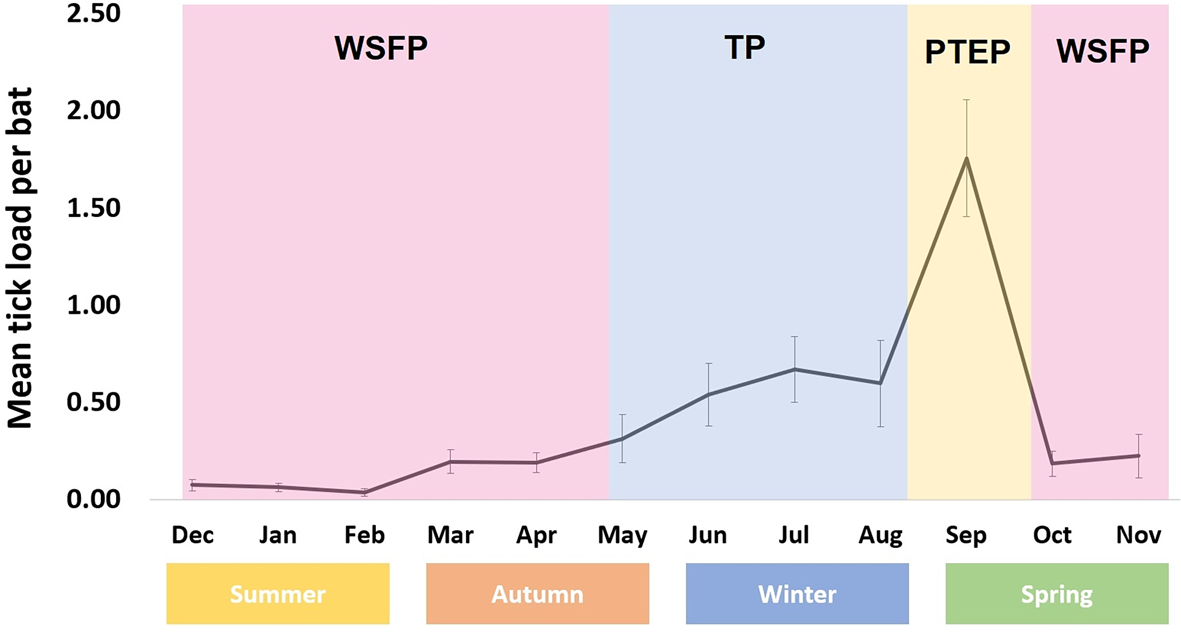
Argas dewae (Fig. 1) load varied markedly throughout the year, with an increase through autumn and winter and a peak in early spring (September), followed by a rapid decline through late spring and into summer. Although adult A. dewae were observed in the bat boxes, it was only larvae and/or nymph stage ticks that were observed attached to hosts and are thereby represented in the data presented. Overall infestation rate was 10.7% in C. gouldii and 7.9% in A. australis (Table 1).
Dew's Australian bat argasid (Argas dewae).
Tick prevalence and load on sampled Chalinolobus gouldii and Austronomus australis
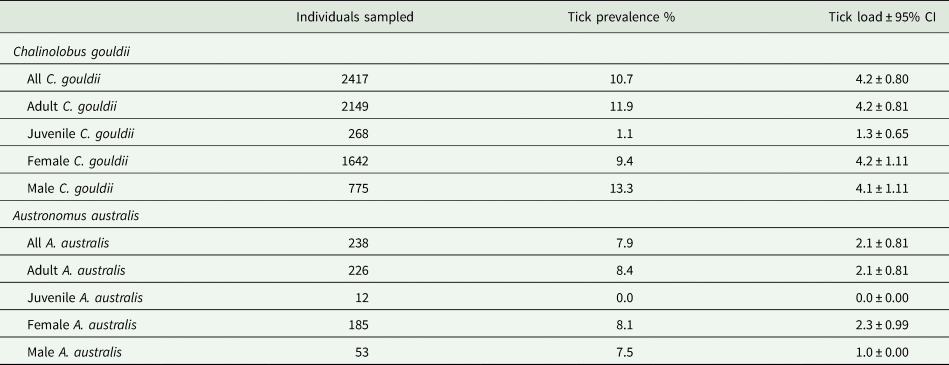
In total, 2417 observations of the parasite load of C. gouldii (Fig. 2) were made; some 11% were juvenile (Table 2). Male and female reproductive states varied strongly across the bioseasons. Bat recapture rates were affected by site: at Gresswell, 146/352 (41.5%) were recaptured, whereas at OPNP only 109/645 (16.9%) were recaptured (χ 21 = 70.744, P < 0.001). The mean intraclass correlation coefficient tick load within individuals that had been captured between 2 and 10 times was 3.63%, justifying the use of tick load data from recaptured bats as independent data points.
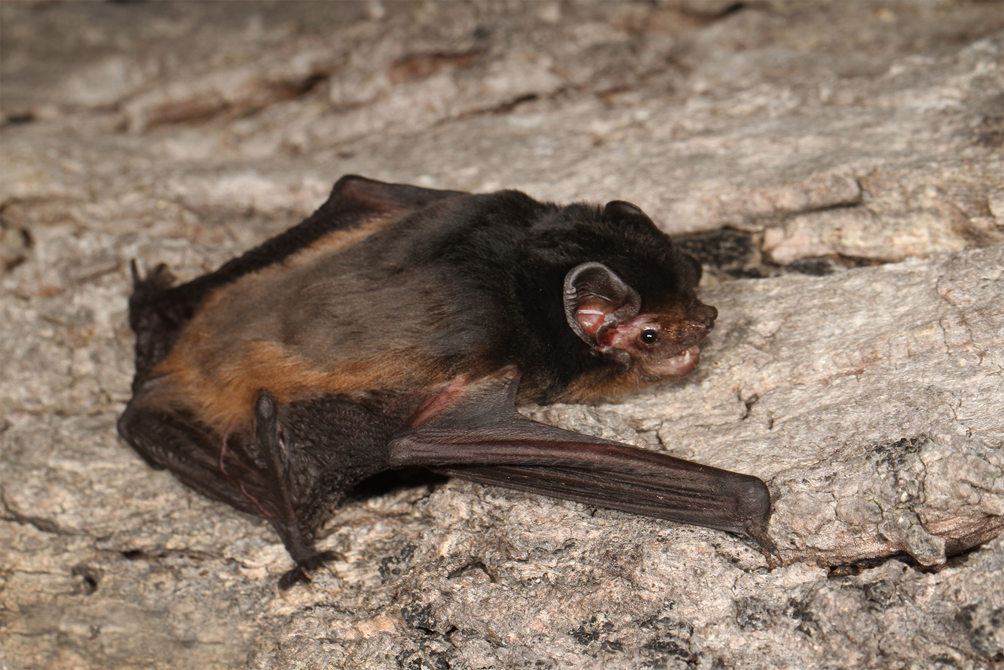
Gould's wattled bat (Chalinolobus gouldii).
Sample sizes of adult and juvenile C. gouldii bats across the 3 bioseasons for the 3 sampled sites
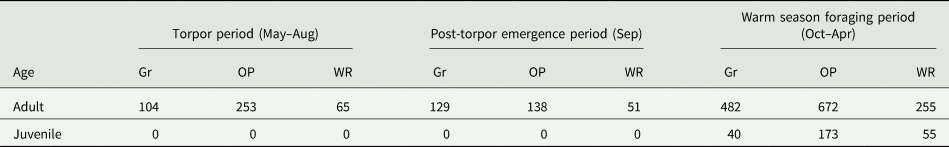
Gr, Gresswell National Conservation Reserves; OP, Organ Pipes National Park; WR, Wilson Reserve.
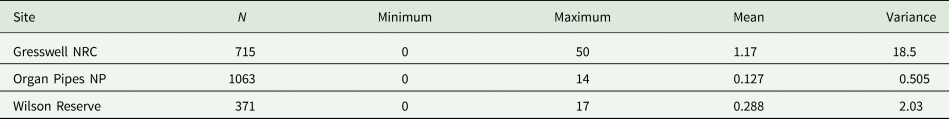
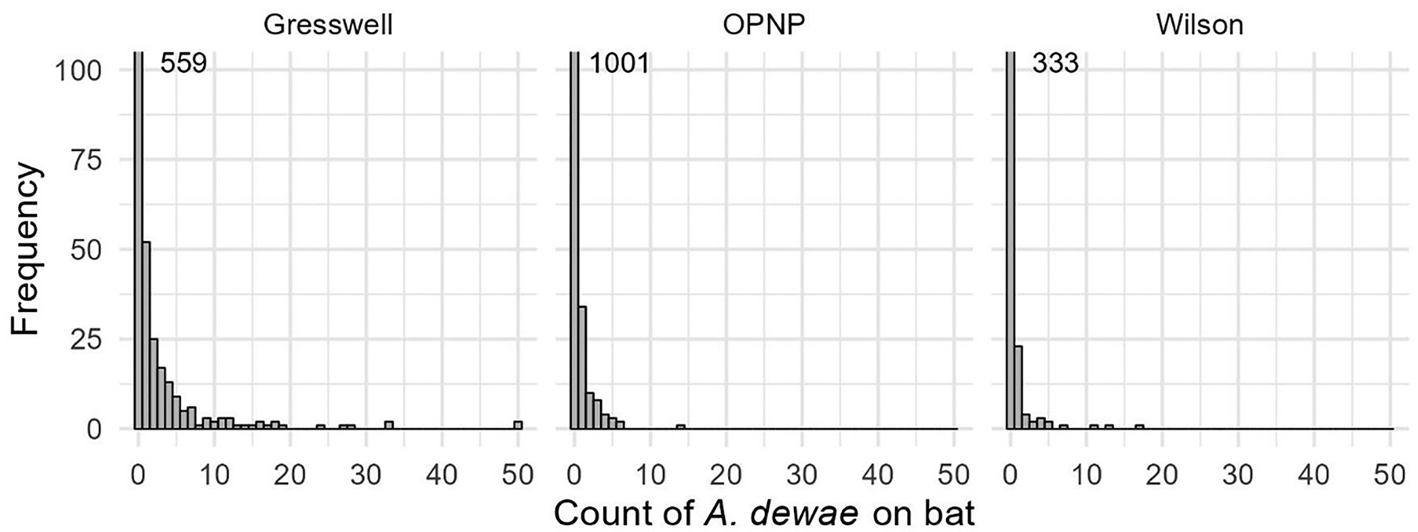
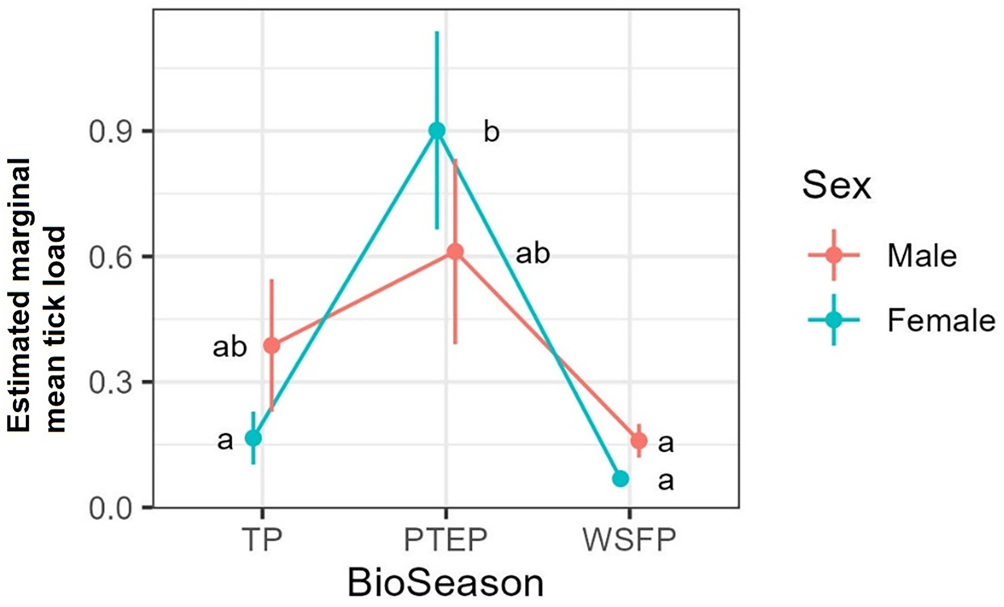
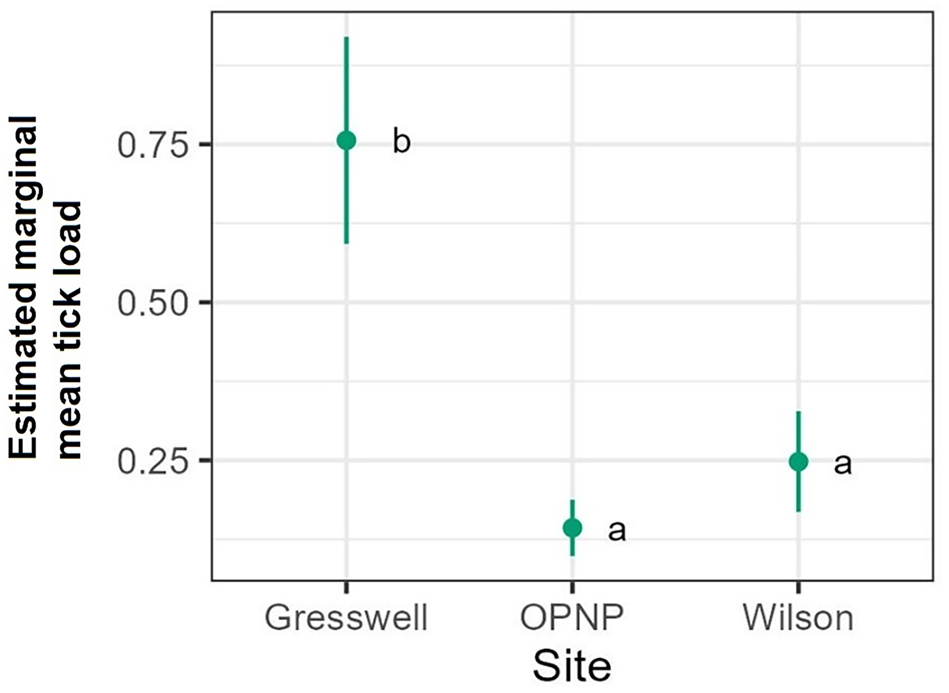
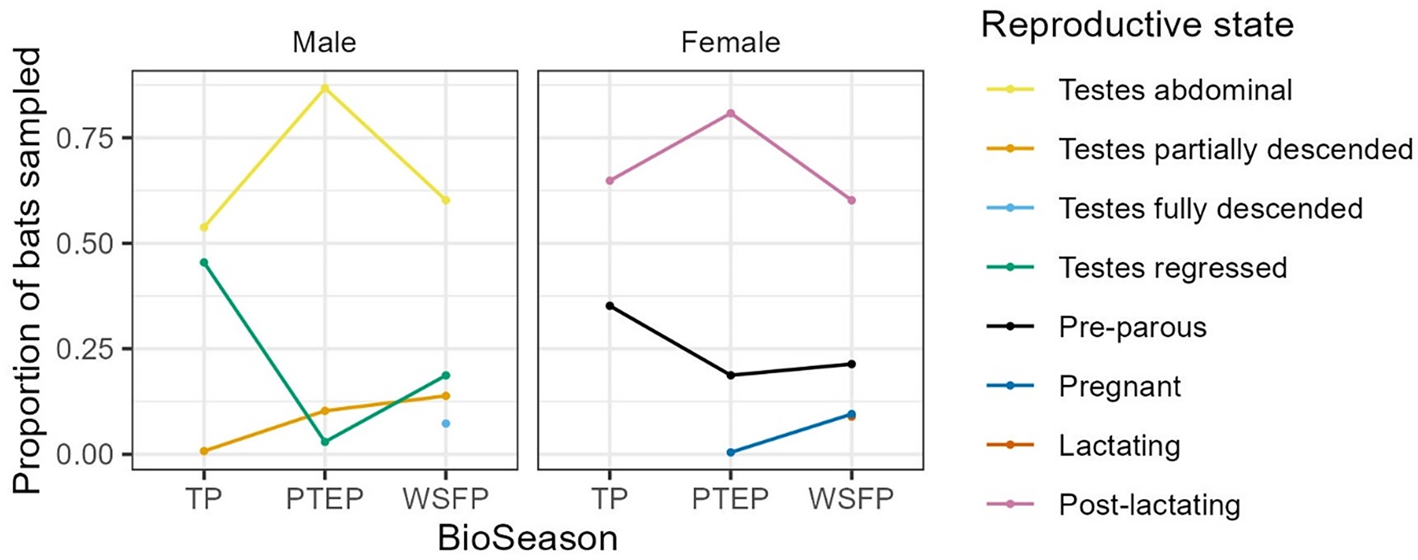
The tick count data were highly over-dispersed relative to a Poisson distribution (variance exceeded the mean, see Table 3). Indeed, the distribution of numbers of A. dewae counted was highly biased towards zero across all sites (Fig. 3). Our ZINB model explained a moderate amount of the total variation in tick load (Nagelkerke pseudo R 2: 0.31). The count component of the model indicated that tick abundance was influenced by an interaction of sex and bioseason (Table 4). This interaction was evident in the estimated marginal mean tick loads of the overall model: males and females during the warm season form 1 group with females in the torpor season, with distinctly lower tick loads than females in the post-torpor emergence season, while the remaining groups (males in the torpor and post-torpor emergence season) having tick loads similar to both aforementioned groups (Figs 4 and 5). Additionally, tick load differed between sites: bats from Gresswell had higher tick loads than those from OPNP and Wilson reserve (see Fig. 6). Tick abundances were lower in juveniles and in boxes with greater numbers of bats (see Table 4). In contrast, the sole factor that influenced the probability of zero tick loads was site, with the lowest probability found in Gresswell (see Table 4, Fig. 3). Additionally, greater body condition indices were associated with greater probabilities of zero tick loads (Table 4). Male and female reproductive states varied strongly across the year and were confounded by bioseason, thus making it infeasible to analyse the impact of reproductive variables on tick infestation (Fig. 7).
Descriptive statistics for counts of A. dewae ticks on adult Gould's wattled bat hosts at the 3 sites in Melbourne, Australia
Histograms for counts of A. dewae ticks on C. gouldii bat across the 3 sites sampled. Note that captures with zero tick counts exceed the y-axis range and exact numbers are indicated in the graph.
Zero-inflated negative binomial (ZINB) mixture modelling results for A. dewae tick load on C. gouldii. Bold values indicate statistically significant p values.
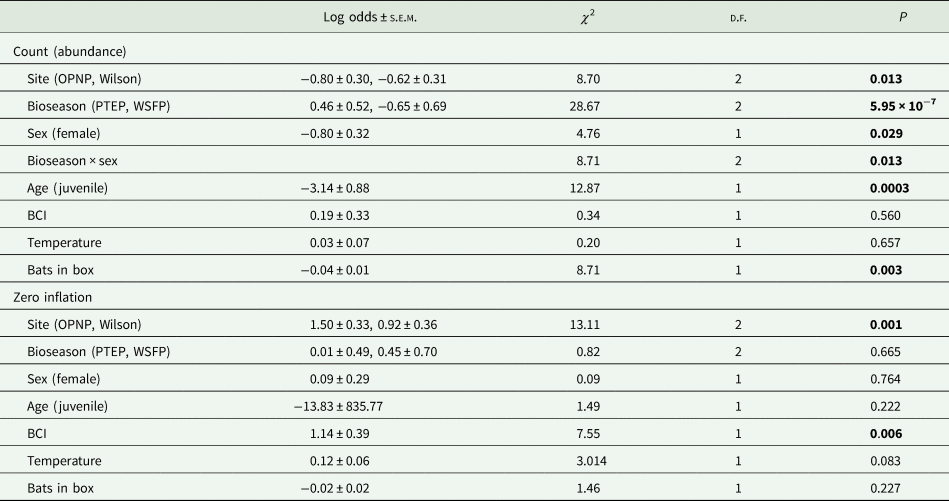
Model output is split into abundance and binomial components, which separately describe the influence of predictors on non-zero tick loads and the likelihood of zero tick loads, respectively. Estimates for site and bioseason are relative to reference levels (Gresswell and TP, respectively).
Phenological map of Argas dewae annual abundance on its bat hosts (errors bars denote standard error).
Estimated marginal mean tick loads on Gould's wattled bats by sex over the 3 bioseasons (TP, torpor period; PTEP, post-torpor emergence period; WSFP, warm season foraging period). Values are averaged across sampled sites and ages. Different letters indicate significant differences following Sidak post-hoc pairwise comparisons at α = 0.05.
Estimated marginal mean tick loads on Gould's wattled bats across the 3 sampled sites Values are averaged across sexes, ages, and bioseasons. Different letters indicate significant differences following Sidak post-hoc pairwise comparisons at α = 0.05.
Changes in male and female reproductive states over the bioseasons (TP, torpor period; PTEP, post-torpor emergence period; WSFP, warm season foraging period). Note that the lactating and pregnant female data points largely overlap in the WSFP.
Host interactions and distribution
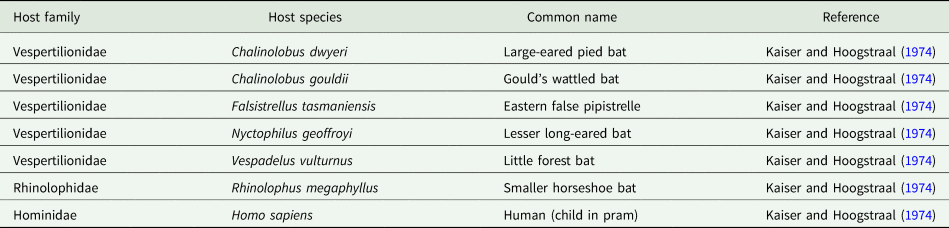
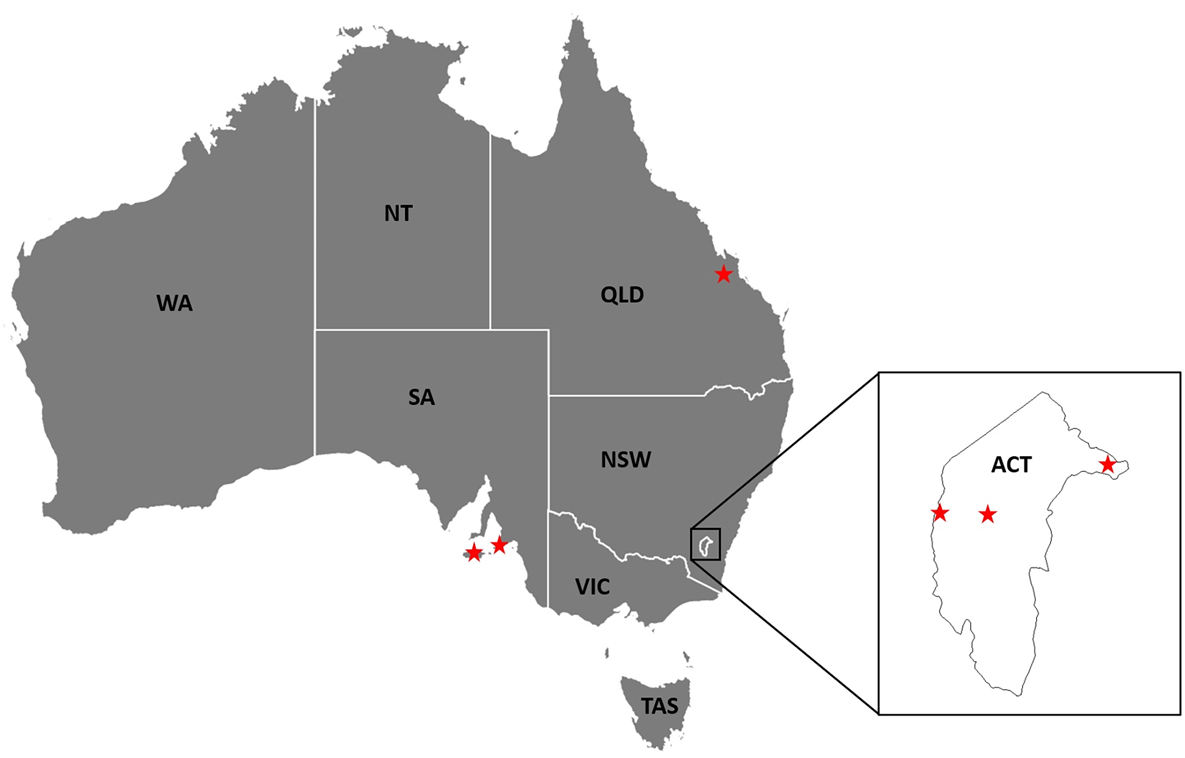
Argas dewae has been recorded from 7 different host species in past publications (Table 5). Based on specimens at the ANIC, records are presented from 6 new hosts of A. dewae, namely A. australis, C. morio, large-footed Myotis (Myotis macropus), large forest bat (V. darlingtoni), southern forest bat (Vespadelus regulus) and little bent-wing bat (Miniopterus australis) (Table 6). These new host records also represent the first records of A. dewae from the 2 bat families Molossidae (A. australis) and Miniopteridae (M. australis). Another notable interaction record based on museum specimens was that of A. dewae crawling on a human at Batemans Bay (NSW) on 24 December 1975 (Table 6). In addition, this study includes the first records of A. dewae from the 3 new states/territories: Queensland, Australian Capital Territory, South Australia (Table 7, Fig. 8).
Hosts of Dew's bat tick (Argas dewae) reported in the literature
New host records for Dew's bat tick (Argas dewae)
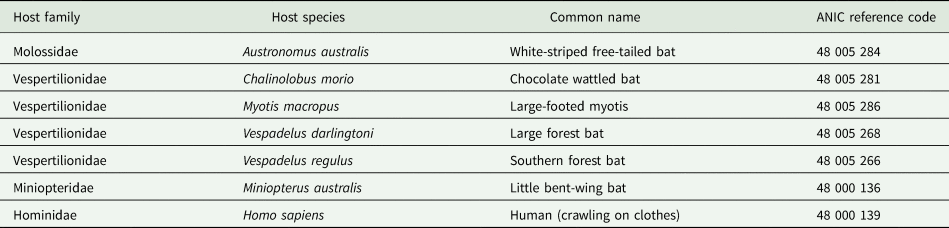
ANIC, Australian National Insect Collection.
New state/territory records within Australia for Argas (Carios) dewae
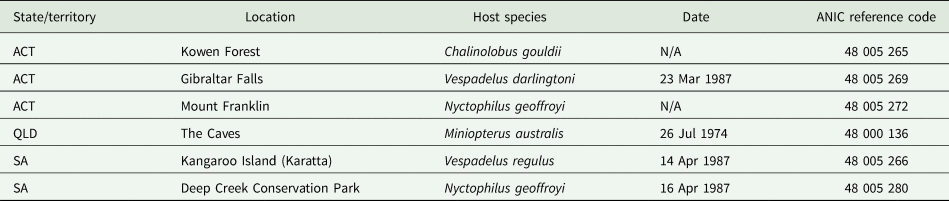
ACT, Australian Capital Territory; SA, South Australia; QLD, Queensland; N/A, not available.
New state and territory records for Argas dewae in Australia (QLD, Queensland; NSW, New South Wale; VIC, Victoria, ACT, Australian Capital Territory; TAS, Tasmania; SA, South Australia; WA, Western Australia; NT, Northern Territory).
Discussion
Phenology of A. dewae
In our study, the abundance of A. dewae was correlated with seasonal activity patterns of its host C. gouldii. As bats in this species enter torpor during winter in southern Australia, they become largely inactive and only rewarm during ephemeral mild weather events (Dixon and Huxley, Reference Dixon and Huxley1989; Churchill, Reference Churchill2008), probably in relation to temporary increases in insect abundance (Turbill, Reference Turbill2006, Reference Turbill2008). Since grooming requires arousal from torpor, the progressive increase in abundance of ticks throughout the cooler autumn and winter months suggests grooming is markedly reducing during this period. As the main torpor period ends for C. gouldii in early spring, the bats tend to form large groups in bat boxes (e.g. up to 58 bats; Godinho et al., Reference Godinho, Lumsden, Coulson and Griffiths2020). This type of clustering behaviour likely elevates temperatures inside bat boxes containing many bats (Willis and Brigham, Reference Willis and Brigham2007). The combination of high host density and higher roost temperatures may facilitate higher tick numbers due to the abundance of food, which facilitates higher metabolic rates (and likely faster growth rates) in the poikilothermic ticks. Following the PTEP, ambient temperatures continued to rise at the onset of the WSFP, and the abundance of ticks markedly declined. This decline may be due to increased grooming activity by the bat hosts, as the abundance of their insect prey during the warmer spring and summer months allows them to meet the energetic demands needed to fuel frequent grooming (Godinho et al., Reference Godinho, Cripps, Coulson and Lumsden2013). Although C. gouldii use winter torpor in the southern part of their range (Stawski and Currie, Reference Stawski and Currie2016), in the northern reaches of their distribution, they are generally active all year and are not torpid during the winter (Chruszcz and Barclay, Reference Chruszcz and Barclay2002). It is unclear whether the phenological patterns observed for A. dewae in the south mirror those in the northern populations. In other tick species, climate has been shown to have a marked effect on tick activity (Qviller et al., Reference Qviller, Grøva, Viljugrein, Klingen and Mysterud2014). Therefore, future studies should seek to address this, as the phenology of A. dewae may be more flexible than this study suggests.
Although there was no direct effect of host sex on tick load and prevalence, the phenological patterns of A. dewae load did depend on sex: with a significant spike in tick load detected during PTEP only in female bats. The effect of sex on tick load and prevalence in bats is variable but tends to be male biased (Piksa et al., Reference Piksa, Górz, Nowak-Chmura and Siuda2014; Kwak et al., Reference Kwak, Hitch, Borthwick, Low, Markowsky, McInnes, Smith, Nakao and Mendenhall2023; but see: Sándor et al., Reference Sándor, Corduneanu, Péter, Mihalca, Barti, Csősz, Szőke and Hornok2019). This general pattern is consistent with theory that predicts that the expression of male secondary sexual characteristics signals the ability to resist parasites (Balenger and Zuk, Reference Balenger and Zuk2014) and that the magnitude of this difference should depend on the degree of sexual selection in a species (Moore and Wilson, Reference Moore and Wilson2002). Gould's wattled bats show little sexual dimorphism beyond that in overall size in favour of females (Tidemann, Reference Tidemann1986) as is common across bats (Muñoz-Romo et al., Reference Muñoz-Romo, Page and Kunz2021), although little research effort has been dedicated to this species in this regard. The exact reason for the discrepant phenology of tick load between the sexes remains unclear but could be related to differences in immune function and condition during this period.
Infestation ecology of bat ticks
Although higher parasite loads are often associated with high host densities in roosts (e.g. Christe et al., Reference Christe, Glaizot, Evanno, Bruyndonckx, Devevey, Yannic, Patthey, Maeder, Vogel and Arlettaz2007; Sharifi et al., Reference Sharifi, Mozafari, Taghinezhad and Javanbakht2008), in this study they were not. Individual C. gouldii often utilize large numbers of different roosting sites across their range (Godinho et al., Reference Godinho, Lumsden, Coulson and Griffiths2015, Reference Godinho, Lumsden, Coulson and Griffiths2020). This tendency allows ticks to disperse across the range of the individual, preventing tick numbers from building up within any single roost. While solitary bats are vulnerable to accumulating large numbers of nidicolous ectoparasites such as A. dewae, particularly when the roost has not been visited frequently, gregarious species may dilute individual parasite loads when parasites can switch hosts. This may explain why lower tick loads were correlated with nest box which had higher numbers of bats. The lower tick prevalence and loads in juvenile bats may be explained by the fact that they are much more abundant during the WSFP, during which tick abundance is far lower than in the PTEP or WHP. Juvenile bats are also commonly encountered with their mothers, which may also act to dilute the ticks present in the roost.
In correlational studies of parasite load, low body condition is often assumed to increase susceptibility to parasites or, inversely, to result from infestation. However, causality in the relationship between parasite load and condition is difficult to ascertain (Coulson et al., Reference Coulson, Cripps, Garnick, Bristow and Beveridge2018). In fact, the relationship between these variables can range from positive to negative and may be due to the indirect effects of other environmental factors (Amo et al., Reference Amo, Lopez and Martin2007; Sanchez et al., Reference Sánchez, Becker, Teitelbaum, Barriga, Brown, Majewska, Hall and Altizer2018). In this study, higher BCI values were associated with greater probabilities of zero tick load, although it should be noted that other variables such as bioseason and site were much more strongly associated with risk of infestation. This suggests that, while BCI may have some bearing on tick–host ecology, other factors may act as more important determinants of tick load in C. gouldii. It is therefore suggested that further studies which manipulate tick load are necessary in this species to reveal the underlying relationships that parasite load and presence have with factors such as host condition, behaviour, habitat and season.
Distribution and hosts
Argas dewae is primarily a parasite of insectivorous bats and appears to tolerate both cave and tree hollow roosting habits in its hosts. Based on previously published records (Kohls and Hoogstraal, Reference Kohls and Hoogstraal1962; Kaiser and Hoogstraal, Reference Kaiser and Hoogstraal1974), as well as those newly reported here, A. dewae has been collected from 12 bat species from 4 bat families. It has also been found on humans on 2 occasions, though the extent of feeding is unclear, and humans clearly represent atypical interactions.
In this study, the results indicate that the probability of bats carrying any A. dewae ticks can vary significantly between relatively proximate populations. The exact reasons for these between-population differences are unclear but can be associated with both host and environmental factors (Ruiz-Fons et al., Reference Ruiz-Fons, Fernández-de-Mera, Acevedo, Gortázar and de la Fuente2012). Argas dewae is distributed across most of eastern Australia from as far west as South Australia (Kangaroo Is.) and south into Tasmania, then extends through Victoria, the Australian Capital Territory, New South Wales and into Queensland to just north of Rockhampton (Fig. 8). Distribution records for A. dewae are sparse owing to relatively limited research on the Australian native Argasidae and the specialized ecology of the tick which makes sampling challenging. It is unclear whether the range of A. dewae extends into the Northern Territory or Western Australia, as one of its primary hosts, C. gouldii, also occurs in both of these regions (Churchill, Reference Churchill2008). Although a number of the hosts of A. dewae have ranges which extend into New Guinea (e.g. M. australis) (Kitchener and Suyanto, Reference Kitchener and Suyanto2002), it is unknown whether the range of A. dewae also extends outside of Australia. The lesser oriental bat argasid (Argas pusillus) has been recorded on insectivorous bats north of Australia, in New Guinea, but A. dewae has not been reported (Hoogstraal, Reference Hoogstraal1982). This may suggest that A. pusillus is occupying the niche that A. dewae fills in Australia and that competitive exclusion has prevented A. dewae from becoming established in this region.
One Health risk
Phenological data on vectors are important when formulating public health policy or undertaking surveillance efforts. In southern Australia, September may represent a period of higher risk of zoonotic spillover for A. dewae, and potentially also R. japonica from this tick. During the PTEP, ticks are significantly more abundant than at any other time of year, corresponding to increased activity of their hosts. The main bat species at the 3 peri-urban habitats sampled in this study, C. gouldii, was the dominant host of A. dewae. Chalinolobus gouldii is well adapted to living in urbanized habitats and is known to roost in ceilings and basements (Dixon and Huxley, Reference Dixon and Huxley1989; Chruszcz and Barclay, Reference Chruszcz and Barclay2002). Therefore, C. gouldii may bring A. dewae into homes from which they may parasitize humans and transmit R. japonica. Notably, interactions between humans and A. dewae to date have rarely been recorded (but see Kaiser and Hoogstraal, Reference Kaiser and Hoogstraal1974). However, shifts and changes in tick or host ecology driven by habitat loss or climate change may increase the likelihood of human–bat–tick interactions and result in future spillover events. To better prepare for such possibilities, more extensive bio-surveillance efforts should be directed at elucidating the microbiomes of both A. dewae and C. gouldii; as well as the extent to which A. dewae and C. gouldii cohabitate with humans.
Data availability statement
The data that support the findings of this study are openly available in figshare at http://dx.doi.org/10.26188/27321879.
Acknowledgements
We thank Robert Bender and staff at the La Trobe University Wildlife Sanctuary for help during fieldwork. The authors kindly thank Matt Clancy for the use of his photograph of Gould's Wattled Bat (Chalinolobus gouldii) for which he retains full copyright.
Author contributions
Lisa Godinho: hypothesis generation, study design, field data collection, tick specimen collection, data analysis and interpretation, manuscript preparation. Emile van Lieshout: statistical analysis, data interpretation and manuscript preparation. Stephen Griffiths: field data collection, tick specimen collection, data interpretation, manuscript preparation. Mackenzie Kwak: tick specimen imaging and identification, museum data collection of new A. dewae host and distribution records, manuscript preparation.
Financial support
Financial support for this study was provided by the Holsworth Wildlife Research Endowment (grant to Lisa Godinho) and Bat Conservation International (grant to Lisa Godinho).
Competing interests
None.
Ethical standards
All animal capture and handling procedures were carried out under permits from the University of Melbourne Animal Ethics Committee (Ethics ID 0701162) and the (then) Department of Environment and Primary Industries, Victoria (Research Permit 10003144).


 Open access