

Sucrase–isomaltase (SI) is expressed in the brush-border membranes of small intestinal epithelial cells, and plays a role in the digestion and absorption of carbohydrate. Many studies, including our own, have demonstrated that expression of the SI gene is gradually increased by feeding rats a high-carbohydrate (starch)/low-fat diet for 1 week compared with a low-carbohydrate/high-fat diet(Reference Yasutake, Goda and Takase1, Reference Goda2). Furthermore, we have previously shown that expression of the SI gene is rapidly induced by force-feeding fructose or sucrose within 3 h in rats(Reference Kishi, Takase and Goda3). This induction of the SI gene by fructose or sucrose is thought to be regulated at the mRNA transcriptional level, because it has clearly been shown in vitro that transcription in the nuclei of the jejunum in rats fed fructose or sucrose is higher than that in rats fed glucose or water.
Many recent studies have indicated that acute induction of gene expression at the transcriptional level is accompanied by dramatic chromatin changes that are triggered by histone modifications. Such modifications, called the histone code, have a central role in the regulation of transcription. Multiple lysine or arginine residues in the core histones, particularly H3 and H4, are subject to post-translational modifications, including methylation and acetylation, and many of these modifications are associated with distinct transcription states. Several studies have confirmed not only that hyperacetylation of histones H3 and H4 is associated with the euchromatin region on the genome(Reference Schneider, Bannister, Myers, Thorne, Crane-Robinson and Kouzarides4–Reference Roh, Ngau, Cui, Landsman and Zhao6), but also induces transcription through recruiting the transcriptional complex on the target genes(Reference Soutoglou and Talianidis7). Recent studies have indicated that one of the major carbohydrates, glucose, induces histones H3 and H4 acetylations on insulin (in β-cells)(Reference Mosley, Corbett and Ozcan8) and TNF-α (in monocytes) genes(Reference Miao, Gonzalo, Lanting and Natarajan9). Our recent results have demonstrated that acetylations of histones H3 and H4, as well as binding of transcriptional factors, caudal type homeobox transcription factor 2 (Cdx-2) and hepatocyte nuclear factor-1, which are putative transcriptional factors for SI gene expression, in mice fed a high-carbohydrate (starch)/low-fat diet for 1 week is higher than that in mice fed a high-fat/low-carbohydrate diet(Reference Honma, Mochizuki and Goda10). These earlier results indicate that some nutrients, such as glucose, are able to enhance gene expression and acetylations of histones H3 and H4 on their gene. However, it has not been determined whether acute induction of the SI gene by force-feeding fructose is regulated by histone acetylation of the SI gene.
In the present study, we examined whether induction of the SI gene expression by force-feeding fructose is associated with acetylations of histones H3 and H4 on the SI gene.
Material and methods
Animals
Male mice (7 weeks old) of the C57BL/6J strain (Japan SLC, Hamamatsu, Japan) received isoenergetic synthetic diets for 7 d: high-fat, low-carbohydrate (high-fat diet: 5 % energy as β-maize starch, 73 % energy as maize oil) diet(Reference Honma, Mochizuki and Goda10). They were subsequently force-fed 23·7 % fructose, 23·7 % glucose or dilution water in 1·61 ml/100 g body weight. Force-feeding was performed twice in 6 h: at 04.00 and 07.00 hours. The mice were killed by decapitation between 10.00 and 11.00 hours. Diet was removed from the rats from 0.00 hours to the time of decapitation.
Preparation of intestinal samples
The entire small intestine was removed and the jejunoileum was divided into three segments of equal length. The proximal one-third was flushed twice with ice-cold 0·9 % NaCl solution. A 1 cm segment (100 mg) was excised from the middle region of the jejunal loop, and immediately used for RNA extraction. The remaining part of the jejunal loop was used for the chromatin immunoprecipitation (ChIP) assay.
Quantitative RT–PCR
Total RNA was extracted by the acidified guanidine thiocyanate method, as described by Chomczynski & Sacchi(Reference Chomczynski and Sacchi11). Real-time RT–PCR for SI, cellular retinol-binding protein, type II (CRBPII) mRNA and 18S rRNA levels was performed on a LightCycler Instrument (Roche Molecular Biochemicals, Tokyo, Japan), as described previously(Reference Honma, Mochizuki and Goda10). The cycle threshold (CT) value, which was determined by the second derivative maximum method using LightCycler software, of SI and CRBPII mRNA, was converted to each signal intensity relative to 18S rRNA by the ΔΔ method, in which the difference of one cycle between samples was calculated as a twofold difference. The sequences of the PCR primer pair and the fragment size are shown in Table 1.
The sequences of oligonucleotide primers used in the present study
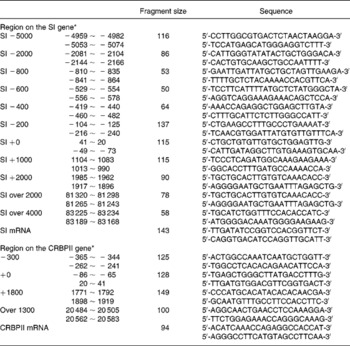
CRBPII, cellular retinol-binding protein, type II; SI, sucrase–isomaltase; ~, indicating a range in the region.
* The region is denoted relative to the transcription initiation site.
Chromatin immunoprecipitation assay
To isolate mucosa from the jejunum, the jejunum for ChIP assays was opened longitudinally, flattened on a glass plate, and the mucosa was scraped from each segment with a glass microscope slide. The mucosa was immediately incubated with fixation solution (1 % formaldehyde, 4·5 mm-HEPES, pH 8·0, 9 mm-NaCl, 0·09 mm-EDTA, 0·04 mm-EGTA) in PBS for 30 min at 37°C. The reaction was terminated by addition of glycine to a final concentration of 150 mm. After being washed in FACS solution (1 × PBS( − ), 2 % bovine serum, 0·05 % NaN3), the samples were lysed by incubating with SDS lysis buffer (50 mm-2-amino-2-hydroxymethyl-1,3-propanediol hydrochloride, pH 8·0, 10 mm-EDTA, pH 8·0, 1 % SDS, 0·5 mm-phenylmethylsulphonyl fluoride) for 2 h. The samples in SDS lysis buffer were sonicated as the DNA size of samples was 200–500 bp. One-tenth volume of the sample was diluted in a dilution buffer (50 mm-2-amino-2-hydroxymethyl-1,3-propanediol hydrochloride, pH 8·0, 167 mm-NaCl, 1·1 % Triton X-100, 0·11 % sodium deoxycholate, 0·5 mm-phenylmethylsulphonyl fluoride). The ChIP assay using 2 μg antibody of anti-acetyl-histone H3 (Millipore, Burlington, MA, USA), anti-acetyl-histone H4 (Millipore) or normal rabbit IgG, was performed as described previously(Reference Honma, Mochizuki and Goda10). The precipitated DNA was subjected to real-time PCR using primers corresponding to the indicated sites in the promoter/enhancer, transcriptional and downstream regions (Table 1). The CT value of ChIP signals detected by real-time PCR was converted to the percentage of each ChIP signal for input DNA, which was calculated by the ΔΔ method, in that the difference of one CT value between the CT value for a ChIP signal and the input signals was calculated as twofold.
Results and discussion
In the present study, we demonstrated that jejunal expression of the SI gene was up-regulated by force-feeding fructose, but not glucose, in mice that were fed a low-carbohydrate, high-fat diet for 1 week before administration (Fig. 1 (A)). The present result is consistent with our previous studies in rats, which indicate that up-regulation of the SI gene by fructose is regulated at the transcriptional level(Reference Kishi, Tanaka, Igawa, Takase and Goda12). Our previous studies have indicated that feeding a diet containing high β-maize starch, which is finally digested to glucose by α-amylase and α-glucosidases, for 1 week, induces SI gene expression(Reference Kishi, Takase and Goda3). Taking these results together, feeding fructose, but not glucose, induces rapid jejunal expression of the SI gene, however, feeding β-maize starch induces gradual expression.
Effects of force-feeding fructose on sucrase–isomaltase (SI; A (i)) and cellular retinol-binding protein, type II (CRBPII; A (ii)) gene expression, and acetylation of histones H3 and H4 on SI (B (i and ii, respectively)) and CRBPII (C (i and ii, respectively)) in mouse jejunum. After receiving a high-fat, low-carbohydrate diet for 7 d, C57BL /6J mice were force-fed fructose (■), glucose (▲) or water (●). (A), Results of real-time RT–PCR for each sample were normalized for 18S rRNA abundance and are expressed as arbitrary units, which represented the mean value of the mice fed glucose as 1. Values are means with their standard errors depicted by vertical bars (n 6–8). a,b Mean values with unlike superscript letters were significantly different by Tukey's multiple range test (P < 0·05). (B, C), Chromatin immunoprecipitation signals were detected by quantitative real-time PCR and normalized to input signals. Values are means with their standard errors depicted by vertical bars (n 3–4). Mean values were significantly different from those of the mice force-fed water on the same region of the SI gene (Tukey's multiple range test): *P < 0·05.
Recent studies have suggested that transcriptional regulation of many genes is associated with the acetylations of histones H3 and H4(Reference Roh, Cuddapah and Zhao5, Reference Roh, Ngau, Cui, Landsman and Zhao6). Indeed, several studies have confirmed that enhanced histones H3 and H4 acetylations induce transcription through recruitment of a transcriptional complex of target genes(Reference Soutoglou and Talianidis7). Our previous study suggests that induction of the SI gene by intake of a high-carbohydrate (starch)/low-fat diet is associated with acetylation levels of histones H3 and H4(Reference Honma, Mochizuki and Goda10). The question remains whether the acute response of SI gene expression to the monosaccharide fructose is regulated by histone modification. Therefore, we focused in the present study on acetylations of histones H3 and H4 in mice force-fed fructose or glucose. We used primer sets suitable for different parts of the SI gene in order to detect ChIP signals (Table 1). ChIP signals for IgG were < 0·0215 % per input. Neither of the ChIP signals of acetylated histones H3 and H4 on regions far upstream or downstream of the SI gene ( − 5000 bp from the transcription start site, 2000 and 4000 bp downstream of the transcription termination site) detected significant differences compared with that of IgG. On the other hand, the ChIP signals of acetylated histones H3 and H4 on the regions of the promoter/enhancer ( − 2000, − 800, − 600, − 400 and − 200 bp) and transcription (0, 1000 and 2000 bp) of the SI gene were markedly higher than that of IgG (Fig. 1 (B) and (C)). Interestingly, acetylation of histone H3 on the promoter/enhancer region ( − 800 to − 200 bp) in mice force-fed fructose was higher than in those fed glucose or water (P < 0·05; Fig. 1 (B)). Acetylation of histone H4 on the SI gene promoter/enhancer region in mice force-fed fructose tended to be higher than in those fed glucose or water (Fig. 1 (C)). In contrast, acetylations of histones H3 and H4 on the CRBPII gene, which did not respond to force-feeding with fructose (Fig. 1 (A)), was not induced by force-feeding with fructose (Fig. 1 (C)). The present results suggest that acetylations of histones H3 and H4 on the promoter/enhancer region of the SI gene is important for the induction of the gene by fructose. It should be noted that the acetylation level of histone H3 on the SI gene is higher than that of histone H4. Although antibody reactivity to the protein differs between antibodies for histones H3 and H4, expression of the SI gene might be strongly regulated by acetylated histone H3 rather than acetylated histone H4. It is not known which factors induce acetylations of histones H3 and H4 in mice force-fed fructose. To assess this, we performed real-time RT–PCR of major proteins with histone acetyltransferase, such as p300/cAMP-response element binding protein (CREB) binding protein (CBP)-associated factor (PCAF), general control of amino acid synthesis 5 (GCN5), CBP and p300. However, expressions of these genes were not induced by force-feeding fructose in the jejunum (data not shown). Our previous study indicates that CBP/p300 recruitment on the CRBPII gene increases without any change in the expression, when CRBPII gene expression and acetylation of histones H3 and H4 on the gene are induced in perinatal small intestine(Reference Ogura, Mochizuki and Goda13). Thus, histone acetyltransferase recruitment on the SI gene might be increased by force-feeding fructose. Further work is needed to establish whether proteins with histone acetyltransferase are recruited on the jejunal SI gene when mice are force-fed fructose.
Several transcription factors involved in SI gene expression have already been identified. The SIF1 element ( − 55 to − 33 bp) is known to interact with Cdx-1/2, the SIF3 element ( − 174 to − 155 bp) interacts with HNF-1, and among these, there is the SIF2 element which is bound to GATA-4(Reference Bosse, Fialkovich, Piaseckyj, Beuling, Broekman, Grand, Montgomery and Krasinski14–Reference Bosse, van Wering and Gielen16). A lot of evidence from cell and animal studies has shown that these transcriptional factors strongly regulate SI gene expression(Reference Bosse, Fialkovich, Piaseckyj, Beuling, Broekman, Grand, Montgomery and Krasinski14–Reference Bosse, van Wering and Gielen16). Our recent study has revealed that Cdx-2 and HNF-1 are bound to the SI promoter region in mice fed either a high-carbohydrate (starch) or high-fat diet(Reference Honma, Mochizuki and Goda10). Thus, it is speculated that Cdx-2 and HNF-1 are also bound to the SI promoter region in mice force-fed fructose, glucose or water. In the present study, we showed that acetylation of histones H3 and H4 induced by fructose in regions SIF1, SIF2 and SIF3 ( − 200, 0 bp) was lower than that in the enhancer regions ( − 800, − 600, − 400 bp). This indicates that cis-elements of other transcriptional factors, probably located on the enhancer region ( − 800 to − 400 bp), may be important for induction of the SI gene by fructose. It has previously been shown that fructose increases intracellular concentration of cAMP(Reference Mesonero, Matosin, Cambier, Rodriguez-Yoldi and Brot-Laroche17). In particular, GLUT5, a fructose transporter expressed in the small intestine, is known to be regulated by CREB, which is bound to the cAMP-response element on the promoter/enhancer region of the target gene, and activates target gene expression(Reference Cui, Ananian, Perez, Strenger, Beuve and Ferraris18). It has recently been shown that phosphatidylinositol 3 kinase is activated in the small intestine of rat pups by force-feeding of fructose(Reference Cui, Schlesier, Fisher, Cerqueira and Ferraris19). Although it is unknown whether CREB or its receptors activated by phosphatidylinositol 3 kinase are bound to the SI gene promoter/enhancer, second messengers including cAMP, and kinases including phosphatidylinositol 3 kinase, which are activated by fructose, may regulate SI gene expression through inducing binding of transcriptional factors and histone acetylations of the SI enhancer region.
The reason why SI gene expression is induced by feeding fructose is unknown. It seems not to be a physiological event, because in most common feedback systems, substrates activate and products repress. Our previous studies have indicated that gene expression of GLUT5 is also up-regulated by feeding fructose(Reference Kishi, Takase and Goda3). Fructose may have a function to coordinately up-regulate genes related to digestion/absorption of sucrose and fructose through enhancing acetylation of histones H3 and H4.
In conclusion, we demonstrated in the present study that acetylations of histones H3 and H4 on the SI gene were rapidly enhanced by force-feeding fructose. The results in the present study suggest that acute induction of SI gene expression by fructose is associated with histone acetylation on the SI gene.
Acknowledgements
This work was supported by a Grant-in-Aid for Scientific Research from the Ministry of Education, Science, Sports and Culture of Japan (18590220, 18790171) and the COE program in the 21st century for the Center of Excellence for Evolutionary Human Health Sciences. The authors declare no conflicts of interest.


