


Diet and nutrition have a critical connection to human health, but there are multiple challenges in their accurate assessment( Reference Subar, Freedman and Tooze 1 ). Even when dietary intake is not the primary focus of a research study, dietary assessment is a complicated task requiring nutrition and statistical expertise, along with appropriate population-specific resources.
Dietary assessment involves the collection of information on foods and drinks consumed over a specified time that is coded and processed to compute intakes of energy, nutrients and other dietary constituents using food composition tables. A wide variety of dietary assessment methods are available to collect dietary information, each one with different strengths and weaknesses. Consideration of the purpose for collecting dietary data is necessary to enable selection of the most appropriate method( Reference Bates, Bogin and Holmes 2 ).
The current paper presents an overview of dietary assessment toolkits that provide comprehensive information on dietary assessment and was developed to aid users in the selection and implementation of the most appropriate dietary assessment method, or combination of methods, with the goal of collecting the highest-quality dietary data possible, within local practical and financial restraints.
The case for toolkits to guide dietary assessment choice
Selecting a dietary assessment method that is valid and acceptable to both respondents and researchers can be challenging, especially for non-specialists. The most commonly used methods include: FFQs; either single or repeated 24 h recalls; and food records or diaries which can be administered for a variable number of days and can be weighed or non-weighed. Different methods for portion size estimation can be used and include standardized or population-averaged portion sizes (often used for FFQs), household measures, images and food models, as well as new imaging technologies that automate volume and portion estimation( Reference Gemming, Utter and Ni Mhurchu 3 , Reference Hassannejad, Matrella and Ciampolini 4 ). Other dietary assessment methods include the diet history, diet checklist, direct observation, dietary screeners and novel technology-assisted methods. For readers seeking more detailed information or a comprehensive description of all dietary assessment methods, please refer to Bates et al. ( Reference Bates, Bogin and Holmes 2 ). Despite considerable respondent and researcher burden, dietary assessment methods that do not rely on recent technological advances have been most commonly used in nutrition surveys. However, new technologies offer potential advantages over more traditional approaches, including faster and less error-prone data processing( Reference Amoutzopoulos, Steer and Roberts 5 ). In the current paper, the term ‘method’ refers to the different dietary assessment methods (e.g. FFQ as a dietary assessment method), whereas the term ‘tool’ or ‘instrument’ refers specifically to what the researcher intends to use to measure dietary intake (e.g. the European Prospective Investigation into Cancer and Nutrition (EPIC)–Norfolk FFQ( Reference Day, McKeown and Wong 6 )).
An FFQ is a questionnaire designed to capture habitual dietary intake (for examples see references Reference Cade, Burley and Greenwood7–Reference Moskal, Pisa and Ferrari10). FFQs include defined lists of foods and drinks (or foods and drinks from given groups) for which participants are asked to indicate their typical frequency of consumption over a specified period in the past (usually the past year, but shorter periods can be used). Frequency responses are usually in a closed-ended multiple-choice format and may range from several times per day to a number of times per year to never, depending on the item, questionnaire design and the period of time covered by the FFQ( Reference Bates, Bogin and Holmes 2 ). The number of food and drink items and scope depend on the purpose of the questionnaire, varying from a few questions on selected items (e.g. twenty items, sometimes referred to as a ‘screener’) to a fully comprehensive list of items (e.g. 200 items) intended to assess total diet. Portion sizes may be specified on the FFQ and participants can select a frequency based on how often they consume the specified portion size. Semi-quantified FFQs use individual or standard portion sizes to estimate food quantities( Reference Cade, Thompson and Burley 11 ). The burden on study participants is lower than for other methods but the approach challenges the participant with rather complex cognitive tasks, for example recall over several weeks or months, estimating an average intake over time and issues where the participant does not consume food items in the amounts specified( Reference Cade, Thompson and Burley 11 ). Participant burden is thus dependent on the length and complexity of the questionnaire and may also vary with the use of technology and online completion. Additionally, developing an FFQ requires considerable time and resources compared with other methods, with tasks including the development of a population-specific food list, the grouping of conceptually similar foods based on nutrient intake and/or portion or manner of serving, assignment of nutrient values to each line, and advanced testing and validation. FFQs are usually self-administered in populations with a high literacy and numeracy level but can be interviewer-administered or interviewer-assisted, if required. Coding and analysis are usually automated.
A 24 h recall captures dietary intake, including a detailed description of the foods and beverages consumed, amount (portion size), brand (if relevant) and preparation (e.g. cooking method, addition of fat, recipe ingredients, etc.) over a 24 h period (for examples see references Reference Robertson, Conway and Dennis12–Reference Rehm, Peñalvo and Afshin15). It has traditionally been administered by a trained interviewer; however, there are multiple automated self-administered versions that have been developed (e.g. ASA24( Reference Subar, Kirkpatrick and Mittl 13 ) or myfood24( Reference Albar, Alwan and Evans 16 , Reference Carter, Albar and Morris 17 )). Participants are asked a series of structured but open-ended, non-leading questions about each food or beverage consumed over 24 h (usually midnight to midnight of the previous day; or for the previous 24 h from the time the recall is started, if appropriate). Amounts can be described in household measures with or without the aid of food models or photographs. The ‘multiple pass’ 24 h recall is now in widespread use( Reference Raper, Perloff and Ingwersen 18 , Reference Moshfegh, Goldman and Lacomb 19 ) and consists of several passes designed to aid memory including an uninterrupted ‘quick list’ of items consumed, detailed probes that query food characteristics and amounts, a forgotten food list and a thorough review. Ideally, the recall day is unannounced to reduce the likelihood of change in habitual dietary intake. Multiple non-consecutive recalls can be collected to capture a more complete estimate of usual intake, adjusting for day-to-day variation. Collection of data and coding can be time-consuming and expensive. For electronic recalls, either self-reported or interviewer-administered, coding is automated and subsequently coding costs are greatly reduced. Importantly, regardless of the approach to the data collection (electronic or paper-based), valid and up-to-date food composition tables and population-appropriate recipes, food lists and portion sizes must be available. It can be extremely time-consuming and challenging to find or access such information, especially in regions where methodology has not yet been established.
Food records or diaries are intended to be completed by study participants at the time of consumption (i.e. in real time, not from memory) for a specific period of time (for examples see references Reference Cade, Burley and Greenwood7 and Reference Prentice, Caan and Chlebowski20–Reference Verreijen, Verlaan and Engberink22). The recording of foods and beverages, amount and preparation can take place from one to several consecutive or non-consecutive days, although three to seven consecutive days is the most widely used recording period for the purpose of estimating usual intake. The data can be captured on paper or within electronic automated systems. Recording on paper usually occurs in an open format, where the participant details his/her intake with no pre-set options for selection. Electronic systems, such as those developed as smartphone applications, can have a closed format where the participant chooses from a pre-existing list of foods and beverages, and enters the amount consumed. Portion sizes may be weighed (weighed diary) or estimated (non-weighed diary) using food models, images or standard household measures (e.g. cups, glasses, bowls, spoons, etc.). The estimation of portion size reduces burden for participants but is less precise compared with weighing. As with 24 h recalls that are not automated, coding of food diaries requires considerable time and resources. Valid food composition tables and locally relevant recipes, food lists and portion sizes are also required in this methodology.
There are strengths and limitations and multiple sources of potential error or bias that may occur when using any dietary assessment method( Reference Westerterp and Goris 23 , Reference Poslusna, Ruprich and de Vries 24 ). Methods are usually designed for a specific country or population, and therefore should be adapted, evaluated and validated whenever they are used in different settings (e.g. different country) or populations (e.g. different age group or gender). Misreporting is a common challenge in dietary assessment( Reference Westerterp and Goris 23 – Reference Johansson, Solvoll and Bjorneboe 26 ). A participant may report dietary intake inaccurately for a variety of reasons (e.g. memory, social desirability). The approach taken to develop a method, including the foods or drinks included and response options, may introduce systematic bias; for example, by not capturing specific aspects of the local diet, or by asking questions in a manner that leads the participant to reply in a biased way. Errors may also be made during coding of reported intakes, with the risk being greater if coders are inadequately trained. Electronic systems completed by the participant could minimize this problem if the food composition table underlying the tool is comprehensive since the participant could select the item he/she actually consumed. The availability and use of country-relevant food composition tables to convert food consumption into nutrient or food group intakes are critical to all methods of dietary assessment. Many countries have their own national tables of food composition, although they are of varying levels of quality and stage of completion. Low- and middle-income countries are less likely to have complete, up-to-date high-quality food composition tables, and efforts are being made to enhance dietary assessment in these settings( Reference Bell, Colaiezzi and Prata 27 , Reference Coates, Colaiezzi and Bell 28 ).
Following a poster presentation at the 9th International Conference on Diet and Activity Methods (ICDAM9), held in Brisbane, Australia in September 2015( Reference Holmes, Dao and Verger 29 ), considerable interest was raised from conference attendees on the subject of toolkits to facilitate dietary assessment method choice. Researchers working with toolkits in the fields of dietary assessment were contacted by authors B.A.H. and M.C.D. to establish interest in sharing more widely on their existence. The toolkits reviewed here, all of which are freely available online, aim to bring together information including practical considerations, strengths and limitations of dietary assessment methods, guidance for method selection and study design, and recommendations for dietary data analysis. There may be toolkits with different scope or format not included in the present paper. For example, a dietary assessment guide, available as a pdf, for method selection in low-resource settings has been recently published by the FAO( 30 ). The Strengthening the Reporting of Observational Studies in Epidemiology–Nutritional Epidemiology (STROBE-nut) is an additional source of information to improve dietary assessment research practices( Reference Lachat, Hawwash and Ocké 31 ). Increasing visibility of all these resources may improve the quality of dietary assessment. The included toolkits are tailored for researchers seeking to optimize dietary data collection in their research and to facilitate the choice of method for the collection, analysis and reporting of dietary data, with the aim to bring awareness of best practices. To the best of our knowledge, the current paper is the first presenting a comprehensive review of toolkits that contain the above-mentioned information on dietary assessment.
Overview of dietary assessment toolkits
The present paper includes a review of five dietary assessment toolkits: (i) the Diet, Anthropometry and Physical Activity Measurement Toolkit (DAPA; UK); (ii) the National Cancer Institute’s (NCI) Dietary Assessment Primer (USA); (iii) the Nutritools website (UK); (iv) the Australasian Child and Adolescent Obesity Research Network (ACAORN) method selector (Australia); and (v) the Danone Dietary Assessment Toolkit (DanoneDAT; France).
Diet, Anthropometry and Physical Activity Measurement Toolkit
The DAPA toolkit is a free web-based resource for researchers and other users who seek to assess diet, physical activity or anthropometric markers including body size or composition. The goal of DAPA is to provide information for users to be better equipped at utilizing and interpreting data from methods and instruments used in existing studies, or for reaching an appropriate decision on choosing methods that are fit for purpose when planning new studies, using a ‘one-stop shop’ approach.
The development of DAPA is led by the Medical Research Council (MRC) Epidemiology Unit, University of Cambridge, UK. The current DAPA toolkit was launched in March 2017 and it builds upon, expands and replaces an earlier version that was initiated in 2008 funded by the MRC Population Health Sciences Research Network (PHSRN).
The subjective and objective methods described in DAPA can be applied to a variety of study types within population health research; for example, aetiological studies, population surveillance and evaluations of interventions all require valid methods but have different feasibility concerns. Despite being developed in the UK and published in English, DAPA is intended to be relevant for research conducted in different countries and settings, across a range of age, sex or ethnicity. The toolkit links to external resources which aid data collection, processing and analysis in languages other than English where these are available.
The principal content of DAPA is organized in sections for overarching measurement concepts and three domains including assessment of diet, assessment of physical activity and anthropometry. The dietary assessment component has five subsections: (i) an introduction covering key concepts in dietary assessment; (ii) subjective methods of dietary assessment; (iii) objective methods of dietary assessment; (iv) a method selector decision matrix which summarizes the information on subjective and objective methods; and (v) data harmonization for dietary intake. There is also a glossary section, as well as pop-up definitions for specific terms within the text throughout the toolkit pages. The structure of the dietary assessment component and the individual pages included in subjective and objective method subsections are shown in Fig. 1.
The structure of the dietary assessment component of the Diet, Anthropometry and Physical Activity Measurement Toolkit (DAPA), including the methods described on dedicated pages
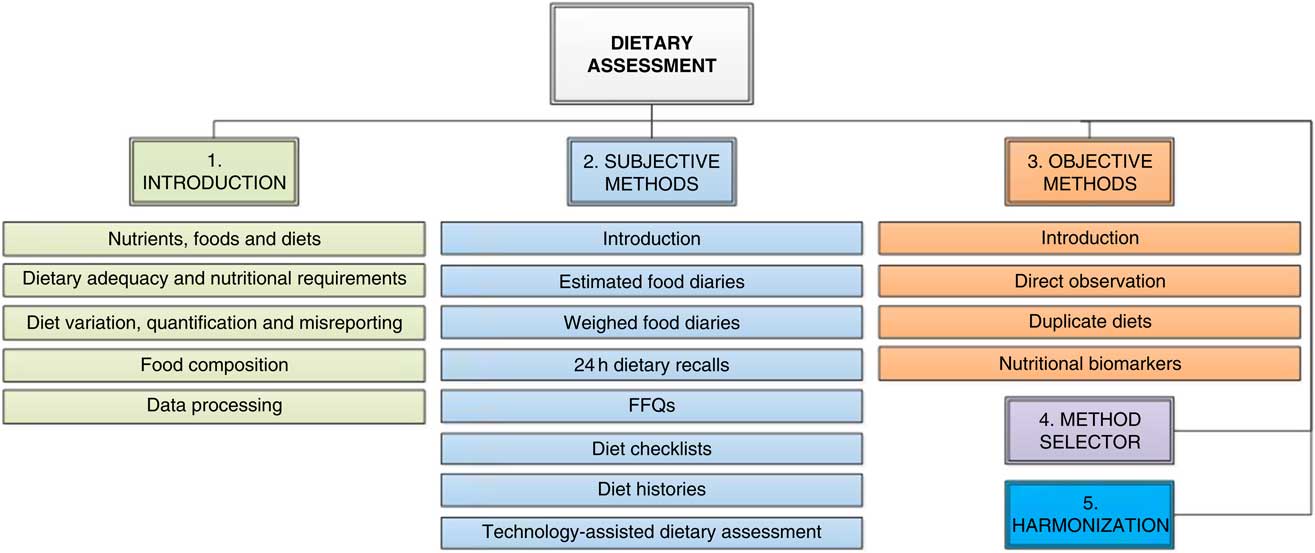
Methods suitable for fieldwork are described on web pages that aid interpretation and analysis of data from existing studies and provide guidance about protocols and feasibility for non-specialists so that optimal methods can be used more readily in future studies. Each method page also links to an instrument library, which provides dedicated pages for specific instruments of that method type. Entries in the toolkit instrument library provide information such as the variables measured and design features, alongside useful resources including links to literature describing validity in different populations/settings, the instrument itself, user guides, processing code and analysis software. A web-form is also in the process of development which will allow researchers or institutions to upload information about existing and newly developed instruments. It is anticipated that this will considerably enlarge the number and improve the quality of information about individual instruments for the assessment of diet, physical activity or anthropometry.
DAPA is a free-to-use website available at www.measurement-toolkit.org. Further developments of the toolkit include: interactive method selector matrices, search and filter functions for the instrument library, video content and a web-form for user-generated content. DAPA is a dynamic, continually updated resource for researchers and other users interested in dietary assessment.
The Dietary Assessment Primer
The Dietary Assessment Primer is a web-based toolkit developed by researchers in the Risk Factor Assessment Branch of the Division of Cancer Control and Population Sciences at the US NCI( 32 , Reference Thompson, Kirkpatrick and Subar 33 ). The objective of the toolkit is to provide information to researchers worldwide that would allow for making informed decisions regarding dietary assessment tools to use in studies seeking to collect dietary intake data. It was not designed for clinical applications, that is for clinical counselling of an individual, but rather for use in collecting and interpreting data collected among a group of individuals participating in a research study.
The Dietary Assessment Primer describes all the major dietary assessment methods (FFQs, 24 h recalls, food records/diaries, dietary screeners) in detail, providing information regarding benefits, drawbacks and limitations. In addition, recommendations are provided regarding potential approaches for collecting and analysing dietary data for many common research questions. The current version was completed in 2015 and is organized into six sections: (i) Instrument profiles: information on specific dietary assessment instruments; (ii) Key concepts: detailed information about the topics of measurement error and validation; (iii) Choosing an approach: recommendations for which tools to use in research settings; (iv) Learn more: brief overviews of important concepts in dietary assessment; (v) Glossary: definition of terms used throughout the primer; and (vi) References and resources: a comprehensive list of all references and links to other resources.
This toolkit, which is publicly available at https://dietassessmentprimer.cancer.gov, seeks to address the questions and concerns of researchers in any country with different levels of expertise and experience in dietary assessment by providing both basic and advanced information and concepts. Features include a roadmap of the website to guide users to the information they seek, as well as an in-depth discussion of measurement error and validation, two topics frequently misunderstood by those collecting dietary data. The ‘Learn More’ section includes twenty-six specific and current topics of interest (e.g. energy adjustment, regression calibration, statistical modelling, usual dietary intake) and the glossary provides definitions for more than 100 terms that are hyperlinked throughout so that users can toggle between content and definitions.
A major highlight of the toolkit is the summary table (Fig. 2) that provides detailed recommendations, with caveats, regarding the use of the most common dietary tools in four common research applications: (i) describing dietary intakes (e.g. for dietary surveillance); (ii) examining the association between diet as an independent variable and a dependent variable such as a health outcome; (iii) examining the association between an independent variable (e.g. socio-economic status) and diet as a dependent variable; and (iv) examining the effect of a dietary intervention.
Summary table and comparison of dietary assessment methods in the Dietary Assessment Primer (24HR, 24 h recall; SCR, screener)
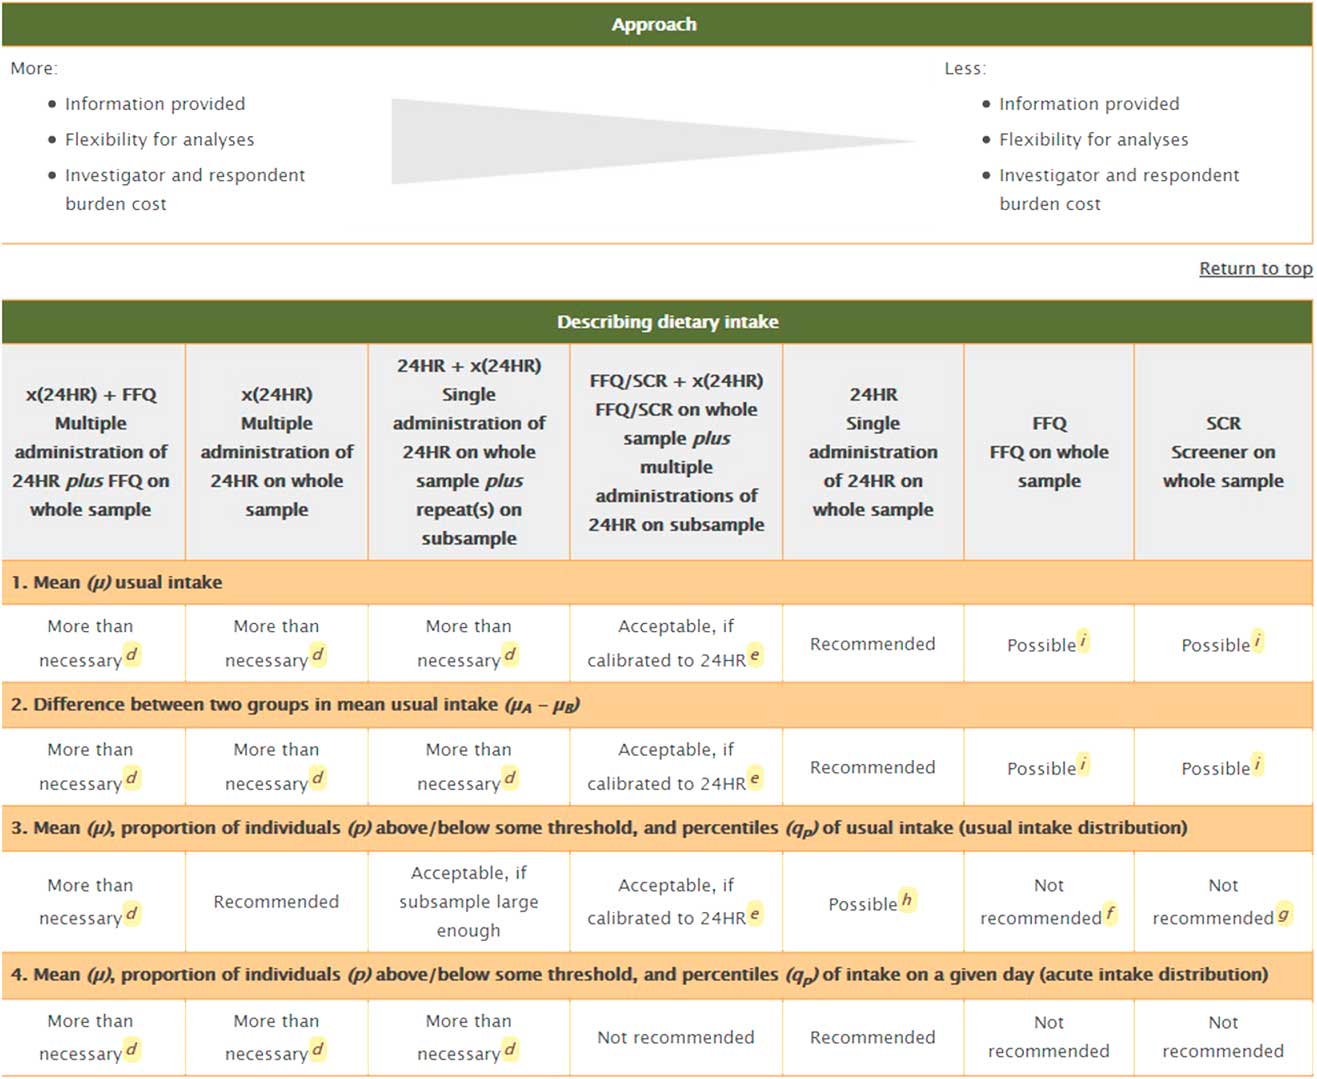
For each of these four research scenarios, more detail is provided regarding the benefits and limitations of using each of the common dietary assessment tools. Given the varying errors associated with each dietary assessment instrument, the Dietary Assessment Primer considers the collection of dietary data using a combination of different instruments (such as 24 h recalls and FFQs) as potentially optimal. Such data are thought to exploit the strengths and minimize the weaknesses of both methods( Reference Carroll, Midthune and Subar 34 ).
Nutritools
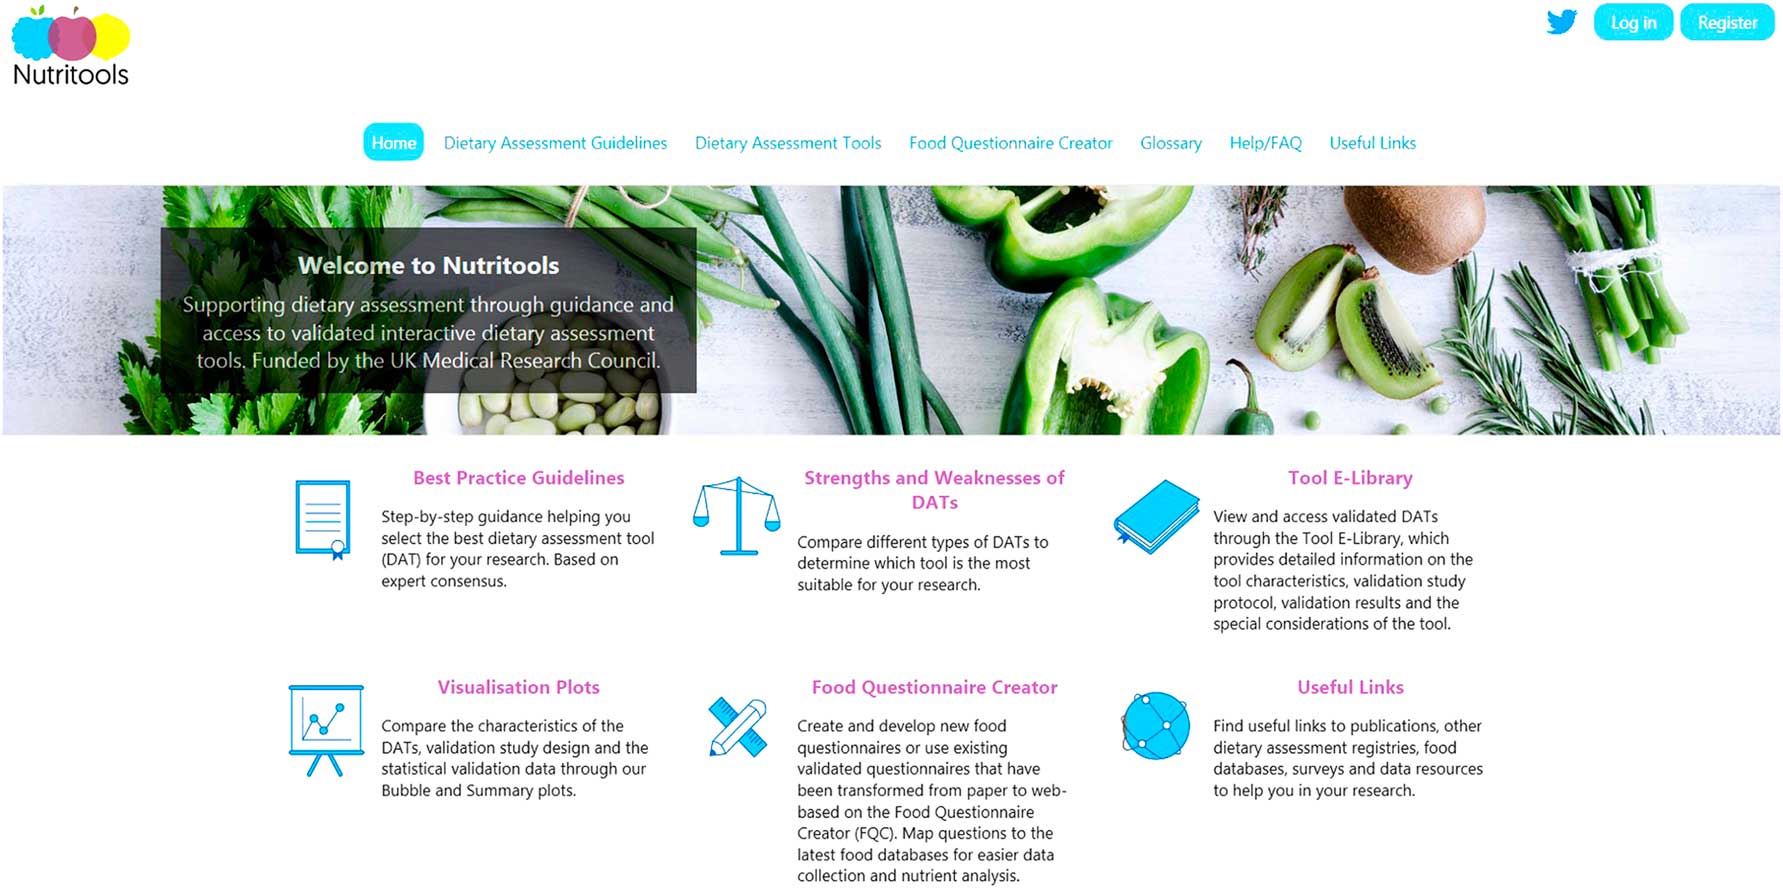
The aim of the DIETary Assessment Tool NETwork (DIET@NET) partnership is to improve the quality, consistency and comparability of dietary data collected in epidemiological and clinical studies through the creation of the Nutritools website (www.nutritools.org; Fig. 3). This is a freely available website aiming to provide non-nutritional epidemiologist experts, researchers and practitioners guidance and support in identifying and accessing the most appropriate dietary assessment tools for their study. The Nutritools website( Reference Warthon-Medina, Hooson and Hancock 35 ) provides several features including Best Practice Guidelines (BPG) for dietary assessment research( Reference Cade, Warthon-Medina and Albar 36 ), to assist researchers and public health practitioners.
Homepage and introduction to the Nutritools website, including the main features on dedicated pages
The BPG were generated by the Delphi process technique, which involved fifty-seven experts within nutritional epidemiology, public health and statistics. The Delphi process generated a forty-three step-by-step process which was split up into four key stages: Stage I. Define what is to be measured in terms of dietary intake (what? who? and when?); Stage II. Investigate different types of tools; Stage III. Evaluate existing tools to select the most appropriate by evaluating published validation studies; and Stage IV. Think through the implementation of the chosen tool and consider sources of potential bias. Furthermore, the BPG provide a summary of the strengths and weaknesses for each type of dietary assessment method.
The Nutritools website also provides an interactive dietary assessment tools (DAT) e-library of tools with accompanying validity data, which were identified through a systematic review of reviews( Reference Hooson, Hancock and Greenwood 37 ). Tools were usually validated against another self-reported dietary assessment method. The e-library provides key summary information and validation data for each of the tools. The website currently hosts 127 tools of which sixty-three have been validated within the UK population. Over 1500 non-UK papers were identified; from these, sixty-four international tools were extracted from other countries in Europe (e.g. Germany, Spain, Italy, Denmark), countries in Asia (e.g. Malaysia), Africa (e.g. South Africa) and Latin America (e.g. Brazil, Mexico). Nutritools provides in-depth information about the tools, validation study characteristics and results. Where available, the tools have external links and downloadable documentation. The website also provides researchers new visual approaches in comparing dietary assessment tools and validation data through bubble charts and summary plots. The bubble charts allow users to compare the different types of dietary assessment tools based on the characteristics of the tool and validation study design, while the summary plots allow researchers to compare validation statistical data for a specific nutrient on a single plot.
The Food Questionnaire Creator (FQC) is an online platform within Nutritools that holds existing food questionnaires for adults and children which have been transformed from paper-based to web-based tools and mapped to the latest (7th) edition of McCance and Widdowson’s The Composition of Foods ( Reference Finglas, Roe and Pinchen 38 ). The UK National Diet and Nutrition Survey (NDNS) rolling programme from Year 6 has been incorporated( 39 ), so that researchers can develop their own FFQ with information about the most commonly consumed foods providing nutrients of interest generated from the NDNS data. Researchers can also add their own food composition tables for nutrient analysis. Additionally, users have the ability to create and develop new food questionnaires on the FQC( Reference Hooson, Warthon-Medina and Hancock 40 ). Participants taking part in a research study are given a unique link to complete the selected or newly created online questionnaire. When the questionnaire is completed, the researcher can download the energy and nutrient information for the participants.
The Australasian Child and Adolescent Obesity Research Network online decision tool to guide dietary intake methodology selection in the context of child obesity
The ACAORN research network operated between 2002 and 2015 by bringing together leaders in child obesity research with the goal of fostering and coordinating high-quality research among Australian and New Zealand child and adolescent obesity research groups. Within the network, the Food and Nutrition Stream aimed to improve the quality of dietary methodologies and the reporting of dietary intake for child obesity research( Reference Burrows, Golley and Khambalia 41 – Reference Golley, McNaughton and Collins 43 ). Reporting the dietary intakes of children, particularly in the context of obesity, brings with it additional challenges and considerations; for example, the potential need for proxy (e.g. caregiver) reporting, consideration of developmental stage (cognitive, numeracy/literacy skills) and consumption away from the proxy.
The ACAORN Food and Nutrition Stream developed an online decision tool in 2009 to guide dietary intake method selection, specifically in the context of child and adolescent obesity. The Stream was comprised of researchers, academics and clinicians, primarily dietitians. The development of the online tool was informed by a literature review to identify current Australasian research activities that include assessment of the dietary intakes of children and adolescents within obesity research.
The online decision tool is designed as a series of steps to guide researchers and practitioners when selecting dietary assessment methods. An overview of common dietary assessment methods and information on key issues (i.e. reliability, validity, when to use, common sources of bias) are provided. Specifically, several dietary assessment matrices (Fig. 4) exist, including: outcomes of interest (i.e. energy, foods and beverages, nutrients, environmental considerations); practical considerations (i.e. burden, sample size, budget); potential for bias; representativeness of usual intake; population of interest (age groups:<1 year old, 1–10 years, 3–5 years, 10–12 years, 12+ years); settings (community, inpatient, clinical); and administration method (face-to-face, self-report, direct observation, electronic).
Comparison of dietary assessment methodologies on the Australasian Child and Adolescent Obesity Research Network (ACAORN) toolkit
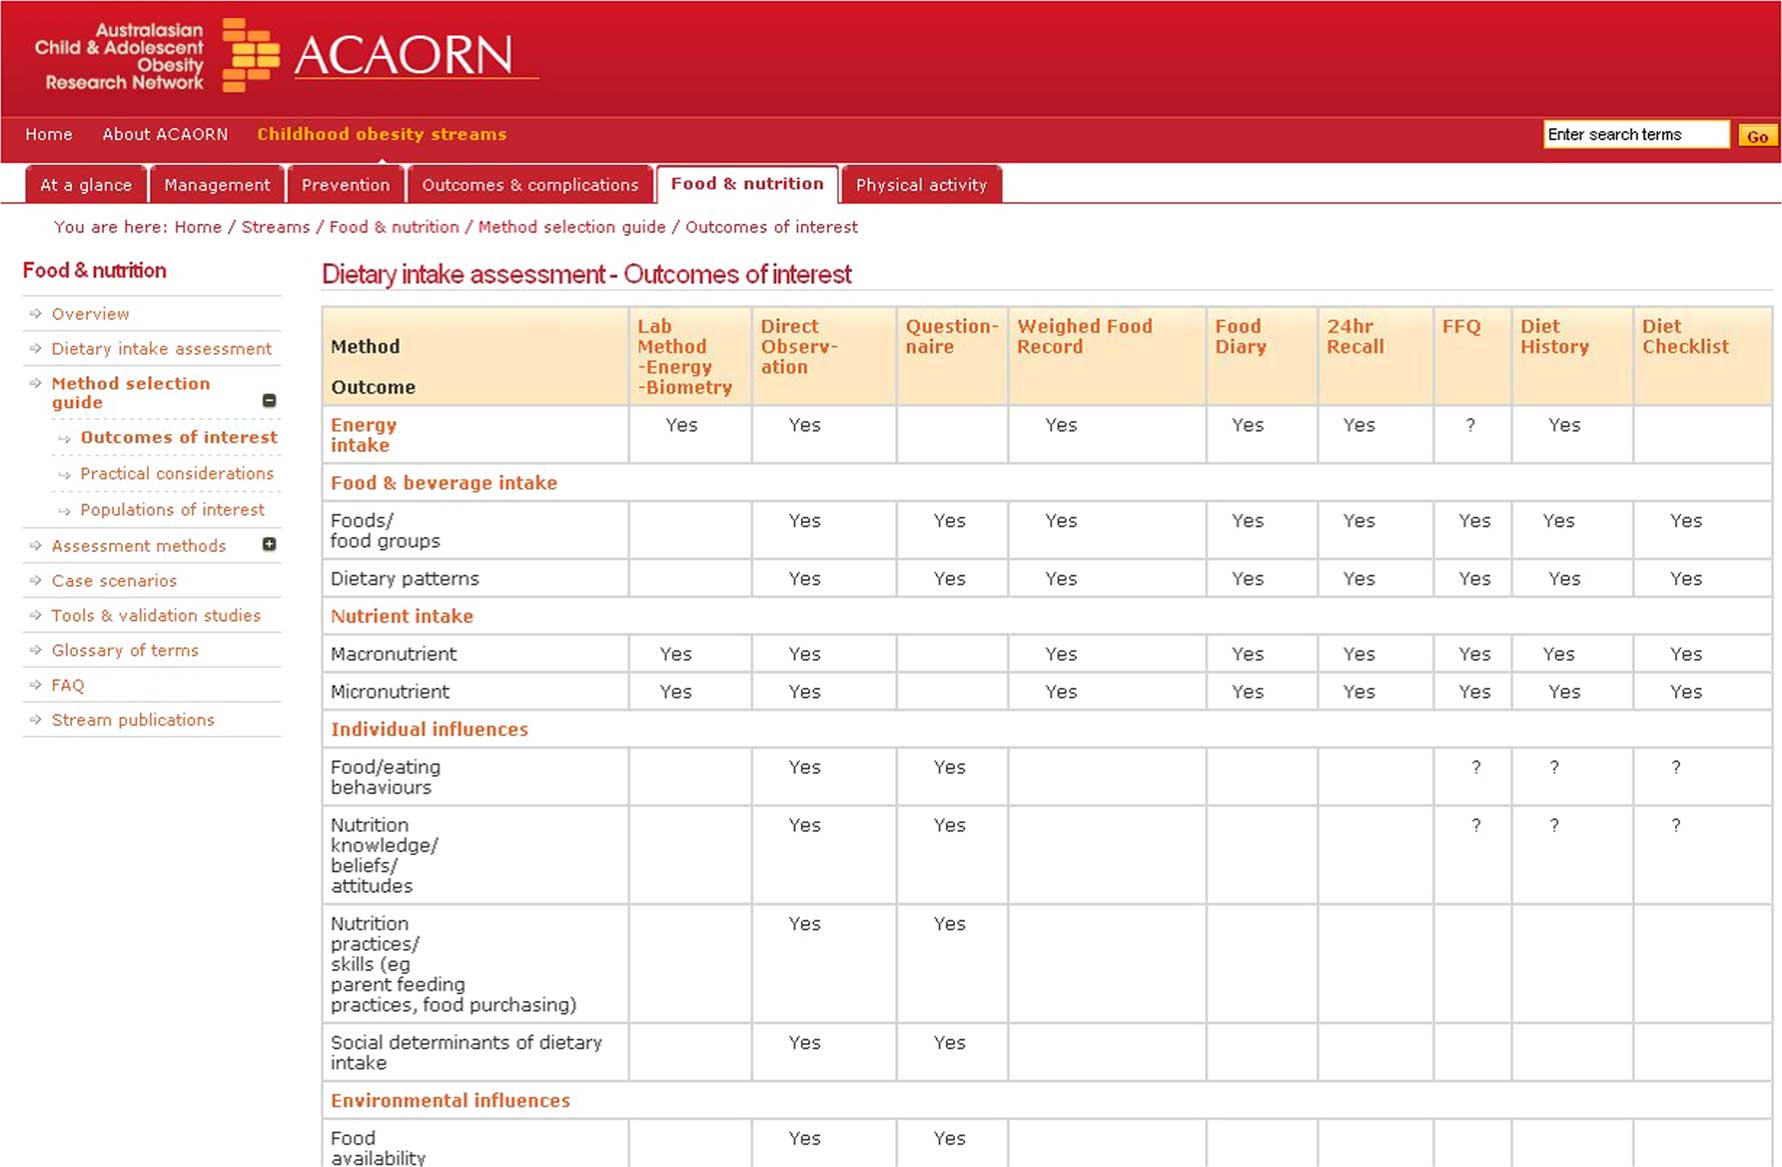
This toolkit, which is publicly available at http://anzos.com/acaorn/food-and-nutrition/, also includes a quick reference guide for each method, case studies, glossary of terms, frequently asked questions and a database of validated Australian tools available for download. The intent of the database is to highlight existing tools for consideration by researchers and practitioners planning research with a dietary outcome.
The Danone Dietary Assessment Toolkit
The Danone Dietary Assessment Toolkit (DanoneDAT) was developed at Danone Nutricia Research with the goal of providing general guidance to investigators with a clinical, yet not necessarily nutrition background, for the incorporation of dietary assessment into a clinical study design. The toolkit is freely available from the authors upon request in Excel format, and available online at https://devhyp.nutriomique.org/tools/.
The first part of the toolkit provides a step-by-step guide for selection of the most relevant method for a given study design (Fig. 5). The guide involves introductory questions that prompt the researcher to identify precisely what research question(s) the collected dietary data are intended to answer. This is followed by an overview of common errors and pitfalls of dietary assessment and a decision tree that guides the researcher to one of three of the most commonly used dietary assessment methods (food diaries, repeated 24 h recalls or FFQs). Decisions are based on the main research question relating to dietary intake (e.g. need to assess recent or habitual dietary intake) and available resources such as estimated time required for administering the tool. Finally, a decision matrix provides additional detail on elements that would influence the method selection, such as what is being measured, study sample size, population characteristics, etc. This matrix was directly adapted from the DAPA toolkit. Diet method flashcards provide general information on each of the three diet data collection methods included. After reviewing these sections, the researcher should have a clearer idea of which method would best suit his/her goals and requirements.
Introduction to the Danone Dietary Assessment Toolkit (DanoneDAT)
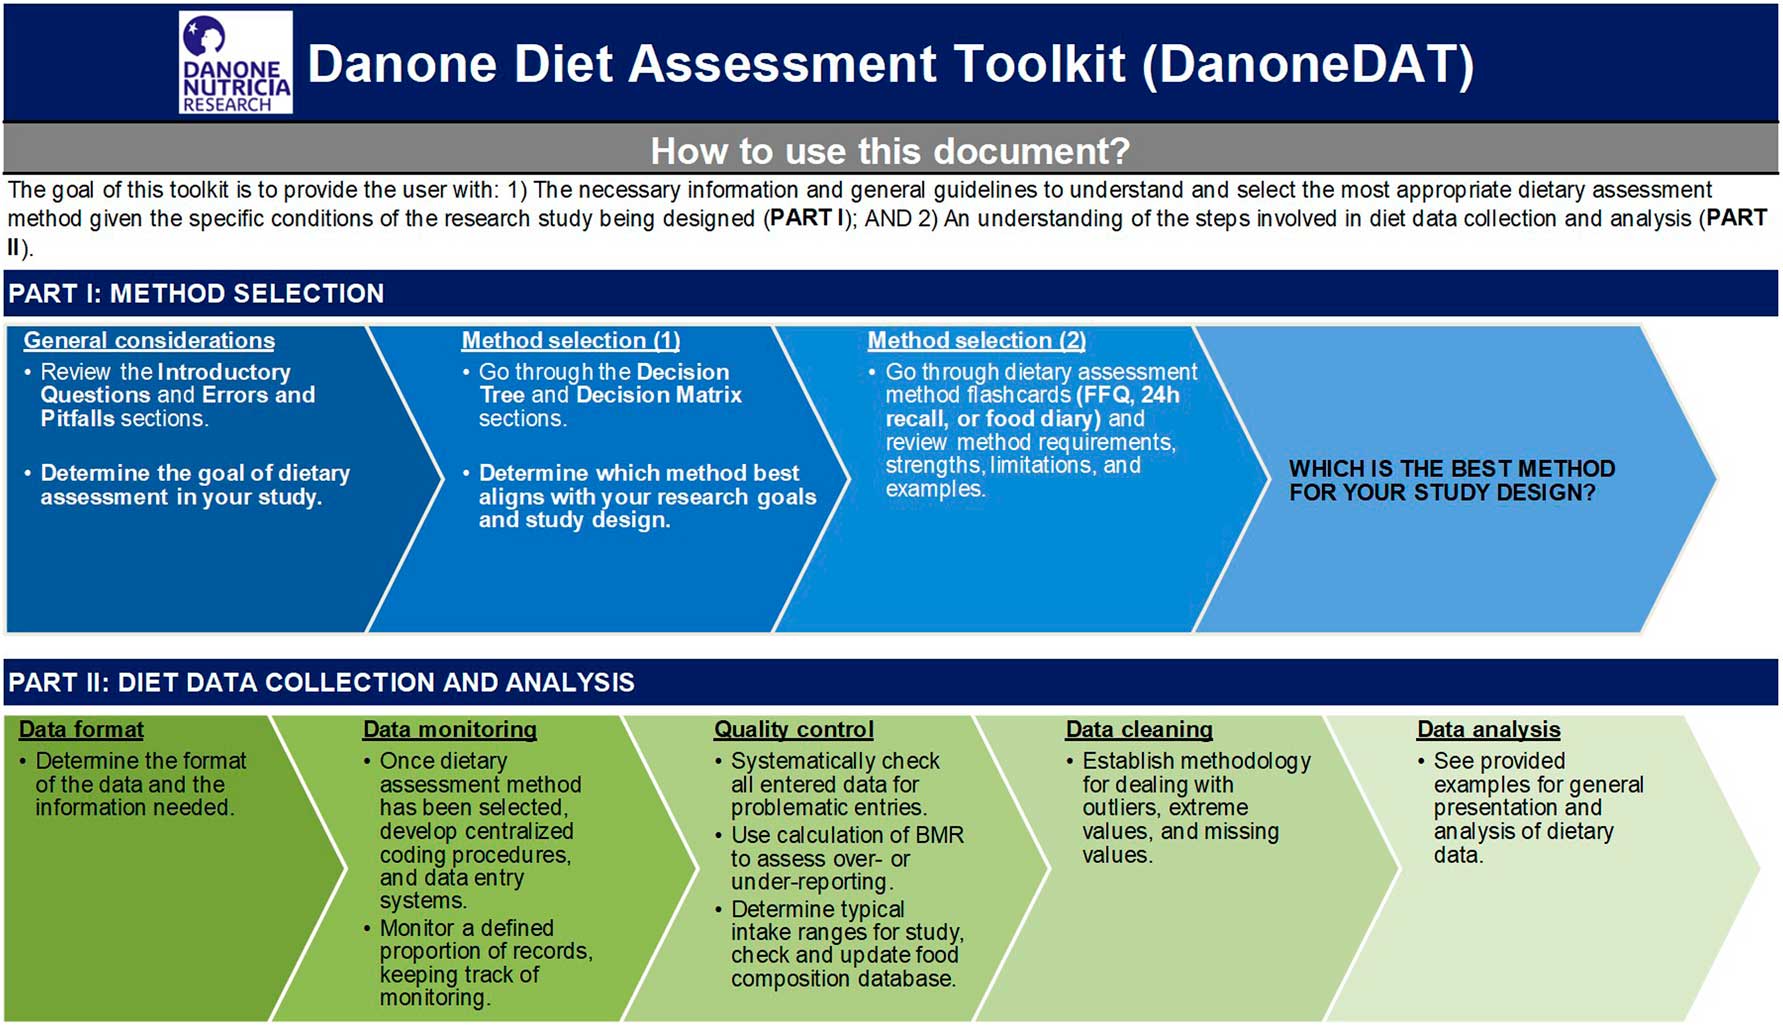
The second part of the toolkit is focused on dietary data collection and analysis. Key issues in data collection, such as format of data tables, are explained. For example, investigators are asked about the format in which intakes should be provided at the end of the study, such as per day or meal in the case of food diaries or 24 h recalls, and whether food and/or nutrient intakes are of interest.
Identification of under- and over-reporters is covered within this section, for which users are guided on how to estimate BMR. A decision tree is provided to select the most suitable strategy for over- and under-reporter identification. The decision is based mainly on the data available to calculate individual BMR, dietary data collection tool and sample size. If data are available to calculate BMR (age, sex, weight and height), the Schofield equations are recommended( Reference Schofield 44 ). A series of calculations is shown to determine the acceptable range for the ratio of reported energy intake to BMI, although it should be understood that on any given day (for a recall or diary), intakes above and below the acceptable range are to be expected. The methodology provided is solely for the identification of over- and under-reporters, and not for their exclusion from data analysis.
Some general guidelines on cleaning dietary intake data, such as how to deal with missing and extreme values, are discussed. Finally, options for general analyses of food and nutrient intakes are listed, together with considerations such as whether energy adjustment is appropriate.
Discussion
In the present paper we provide an overview of dietary assessment toolkits developed to aid users in the selection and implementation of the most appropriate dietary assessment method for their research study. These toolkits are all easily accessible to researchers seeking to measure dietary intake. It is not necessary to have a nutrition background to use these toolkits if researchers are only seeking to learn more about dietary assessment and consider incorporating this into their research. In fact, we encourage the use of the toolkits for non-nutrition experts to become more aware of the requirements and limitations of dietary assessment. However, we strongly recommend collaboration with nutrition experts for the implementation of studies with a dietary intake component. None of the toolkits presented were designed for clinical application, such as patient nutrition counselling.
The present paper is the first comprehensive summary synthesizing the information available from various dietary assessment toolkits, developed by different institutions internationally. To our knowledge, these toolkits are the only freely available online set of tools in existence that provide background information on various dietary assessment methods, as well as guidance for method selection, application in research and data analysis. The toolkits provide both overlapping and complementary information, summarized in the feature comparison table (Table 1). In summary, the DAPA toolkit offers a comprehensive overview of dietary assessment methodologies, as well as equivalent sections on the measurement of physical activity and anthropometric markers. The ACAORN toolkit includes information on dietary assessment specifically in infants, toddlers, children and adolescents, and is particularly useful for studies of childhood obesity. It was developed at a similar time as the DAPA version 1 toolkit, which was more focused on adults, so corresponding and complementary links between the two sites were created. The Dietary Assessment Primer is an extensive guide to dietary assessment, providing information on methods, validation, as well as references, resources and topics of interest for the measurement of diet. Nutritools includes an FQC that will include existing validated tools, in addition to containing other dietary assessment resources. DanoneDAT provides a systematic guide to incorporating dietary assessment in research studies, from the study design stage through data analysis.
Comparison of features offered by the different dietary assessment toolkits
Y, yes; N, no.
* University of Leeds; Quadram Institute Bioscience, Norwich; Coventry University/Imperial College London; MRC Human Nutrition Research (HNR), Cambridge; MRC Lifecourse Epidemiology Unit, Southampton; University of Bristol; University of Oxford; and University of Southampton.
All toolkits are applicable to dietary assessment in nutrition, clinical and epidemiological research studies, and to populations of different ages, genders and health status. They all present an overview of dietary assessment methodologies, with limitations and advantages discussed. However, the methodologies included in each toolkit vary; for instance, with DAPA covering a wide variety of methods, while the DanoneDAT focuses on the three most widely used methods in research studies (FFQ, 24 h recall, food diary). In addition, ACAORN, DAPA and the Dietary Assessment Primer provide information on the measurement of nutritional biomarkers.
Nutritools and the Dietary Assessment Primer, in addition to information about different tools and methodologies, include comprehensive information on the validation of dietary assessment tools. Nutritools and DAPA have instrument libraries for users to search for previously published tools. The Dietary Assessment Primer, DAPA and DanoneDAT have information on data analysis, measurement error correction and identification of misreporters. Misreporting is a common problem in dietary assessment( Reference Westerterp and Goris 23 – Reference Johansson, Solvoll and Bjorneboe 26 ) and careful consideration should be given to this issue from the early stages of study design.
All toolkits are freely available to users and can be found online, the use of one or a combination of these toolkits cannot replace consultation with a nutrition researcher and statistician with expertise in diet assessment methodology, study design and analysis of nutritional data. However, these toolkits provide valuable information regarding the selection of an appropriate tool for a given research context and are especially useful for those without access to the above resources. Although the toolkits might differ in their content, they are, for the most part, complementary, serving a purpose for different research contexts or interests. Links to the toolkits are provided in Table 1.
The development of toolkit content, online hosting, updates and maintenance all require time and resources. Nevertheless, as dietary assessment evolves, so too should these toolkits be updated on a regular basis to stay current. Evolving topics include new technology-based tools, ‘blended’ methods which broaden traditional definitions of current tools, and new statistical methods in the areas of data design, collection and analysis.
Conclusion
In conclusion, the current synthesis highlights the common and unique features among multiple toolkits available to the research community that provide information and guidance on the selection of a dietary assessment method, and the evaluation and analysis of dietary data. The present paper provides an at-a-glance summary of features of the toolkits, thereby aiding investigators in where to find useful information about collecting dietary data for a given research context.
Acknowledgements
Acknowledgements: The DAPA toolkit coordination team includes Matthew Pearce, Fumiaki Imamura, Emanuella De Lucia Rolfe, Soren Brage and Nita Forouhi, with technical support from David Vaughan and Adam Dickinson. The principal investigators of the DAPA toolkit are Nita Forouhi, Soren Brage and Nick Wareham. The team acknowledges contributions from across the MRC Epidemiology Unit and other institutions (http://www.measurement-toolkit.org/acknowledgements). The NCI Dietary Assessment Primer site is administered by the Epidemiology and Genomics Research Program. The scientific leads were Susan M. Krebs-Smith, Amy F. Subar, Frances E. Thompson, Jill Reedy and Tusa Rebecca Panucci in the NCI Division of Cancer Control and Population Science’s Risk Factor Assessment Branch (RFAB) at the time it was published; Anne Brown Rodgers, science writer; and Sharon I. Kirkpatrick, formerly with the NCI and currently Assistant Professor at the University of Waterloo School of Public Health and Health Systems. Valuable statistical support was obtained from Laurence S. Freedman of the Gertner Institute, and Victor Kipnis, Kevin Dodd and Douglas Midthune of the NCI Division of Cancer Prevention’s Biometry Research Group. The members of the DIET@NET consortium are: Dr Nisreen A. Alwan; Professor Janet E. Cade; Paul Finglas; Professor Tim Key; Professor Barrie Margetts; Professor Andy Ness; Professor Sian Robinson; Dr Toni Steer; Polly Page; and Professor Petra Wark. The members of the DIET@NET project team are: Professor Janet E. Cade; Dr Marisol Warthon-Medina; Neil Hancock; and Jozef Hooson. The team developed the Nutritools website. The ACAORN executive and Food and Nutrition Stream member contribution to the development of the ACAORN online decision tool is acknowledged. We also acknowledge the equivalent tool to guide selection of methods to assess physical and sedentary activity in the context of child obesity (http://test.acaorn.med.usyd.edu.au/streams/activity/method-selection/index.php).
Financial support: The development of DAPA is led by the MRC Epidemiology Unit, University of Cambridge, supported by the UK National Institute for Health Research (NIHR) Cambridge Biomedical Research Centre (BRC) (Nutrition, Diet, and Lifestyle Research Theme; grant number IS-BRC-1215-20014) and the EU-FP7 InterConnect Project (www.interconnect-diabetes.eu). N.G.F. acknowledges core MRC support (grant number MC_UU_12015/5). The Dietary Assessment Primer is an official National Cancer Institute website. The content was created, approved and funded by NCI. The DIETary Assessment Tool NETwork (DIET@NET) is a UK MRC-funded partnership of experts in the field of dietary assessment, nutritional epidemiology, public health and clinical studies from eight UK universities and institutions: University of Leeds; Quadram Institute Bioscience, Norwich; Coventry University/Imperial College London; MRC Human Nutrition Research (HNR) Cambridge; MRC Lifecourse Epidemiology Unit, Southampton; University of Bristol; University of Oxford; and University of Southampton (grant number MRC MR/L02019X/1). ACAORN was funded by the NSW (2002–2010) and QLD Health (2010–2014) Departments. Development of DanoneDAT was supported by Danone Nutricia Research and by the EU’s Seventh Framework Programme under grant agreement HEALTH-F4-2012-305312 (METACARDIS). Conflicts of interest: B.A.H. is a full-time employee of Danone Research. J.E.C. is Director of Dietary Assessment Ltd, a University of Leeds spin-out company supporting myfood24, an online dietary assessment tool. M.C.D. received an honorarium for her participation in the Danone YINI conference (Mexico, February 2018). R.K.G. has no conflicts of interest to declare. A.F.S. has no conflicts of interest to declare. N.G.F. has no conflicts of interest to declare. M.P. has no conflicts of interest to declare. M.W.M. has no conflicts of interest to declare. T.B. has no conflicts of interest to declare. Authorship: B.A.H. and M.C.D. designed the review and managed the work. Authors drafted text specifically for their institutional toolkit. All authors provided critical comments, read and approved the final manuscript. Ethics of human subject participation: Not applicable.


