Assessing dietary intake accurately is important for understanding the role of diet in causing and preventing chronic diseases. The technical capabilities of smartphones offer the potential to increase the accuracy and effectiveness of diet monitoring( Reference Bardus, van Beurden and Smith 1 , Reference Thompson, Subar and Loria 2 ). One such capability is barcode scanning. By utilizing the smartphone’s built-in camera to scan the Universal Product Code (UPC) printed on food packages, food products can be identified and information about foods including nutrient and energy contents can be retrieved( Reference Arens-Volland, Spassova and Bohn 3 – Reference Rusin, Arsand and Hartvigsen 5 ). The retrieved product information can be used as input for dietary assessments (e.g. digital food diaries). Due to its low user involvement and efficiency, barcode scanning has been claimed to reduce the burden of food recording( Reference Pagoto, Schneider and Jojic 6 , Reference Weinstein, Phillips and MacLeod 7 ) and participants evaluated the barcode scanner method as comprehensive, easy to use and non-intrusive( Reference Byrd‐Bredbenner and Bredbenner 8 ).
Despite a clear shift towards new and technically innovative solutions for dietary assessment in nutrition research, barcode scanning is hardly ever used as a food input method in technical research solutions( Reference Arens-Volland, Spassova and Bohn 3 , Reference Rusin, Arsand and Hartvigsen 5 , Reference Ngo, Engelen and Molag 9 ). In commercial nutrition applications (apps), on the other hand, it is one of the most commonly implemented technologies supporting dietary assessments( Reference Pagoto, Schneider and Jojic 6 , Reference Chen, Cade and Allman-Farinelli 10 , Reference Franco, Fallaize and Lovegrove 11 ). Due to the advantages of unambiguous product identification( Reference Steele 4 ), ease of use( Reference Pagoto, Schneider and Jojic 6 , Reference Weinstein, Phillips and MacLeod 7 ) and potential level of detail provided about the consumed products( Reference Steele 4 ), popular nutrition apps with barcode scanners might be valuable tools for researchers interested in assessing people’s dietary intakes.
Although the technical challenges in capturing barcode information from packages are considered relatively low( Reference Steele 4 ), one of the biggest challenges might be the size and quality of the underlying food product database( Reference Arens-Volland, Spassova and Bohn 3 , Reference Brinkerhoff, Clark and Jordan 12 , Reference French, Shimotsu and Wall 13 ). The value of barcode scanning for food identification depends on a sufficiently large, comprehensive and accurate food product database that stores the barcodes and associated product information. Since compiling and continuously updating food databases to support dietary assessment is challenging and cost-intensive, it is common practice by diet apps to ‘crowdsource’ the data compilation process, whereby users are provided the option to add new food products including their energy and nutrient values( Reference Carter, Burley and Cade 14 ). The size of user-generated databases can increase very rapidly, however, when users enter food data themselves and loss of accuracy can occur. Hence, although user-generated food databases provide the benefit of user customization of foods consumed, it might be an important source of error in dietary assessments( Reference Chen, Cade and Allman-Farinelli 10 ).
Since the quality of packaged food databases underlying popular nutrition apps is widely unexplored, the value of using their barcode scanner solutions as efficient and accurate means for monitoring food consumption remains uncertain. The aim of the present study was to investigate the quality of the labelled food product databases underlying today’s most popular food consumption apps with barcode scanners with respect to their rate of product identification and the availability and accuracy of nutrient values for the scanned products.
Methods
App selection
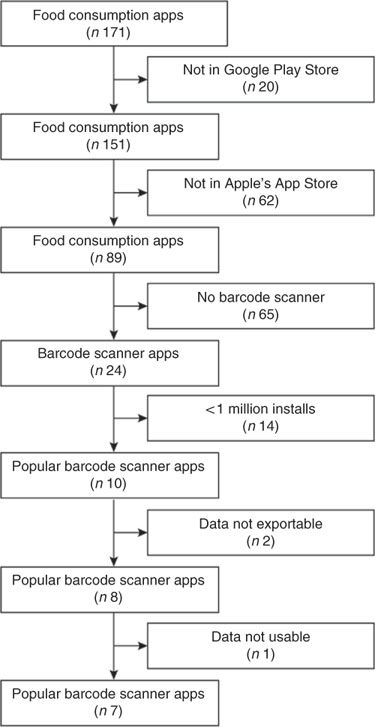
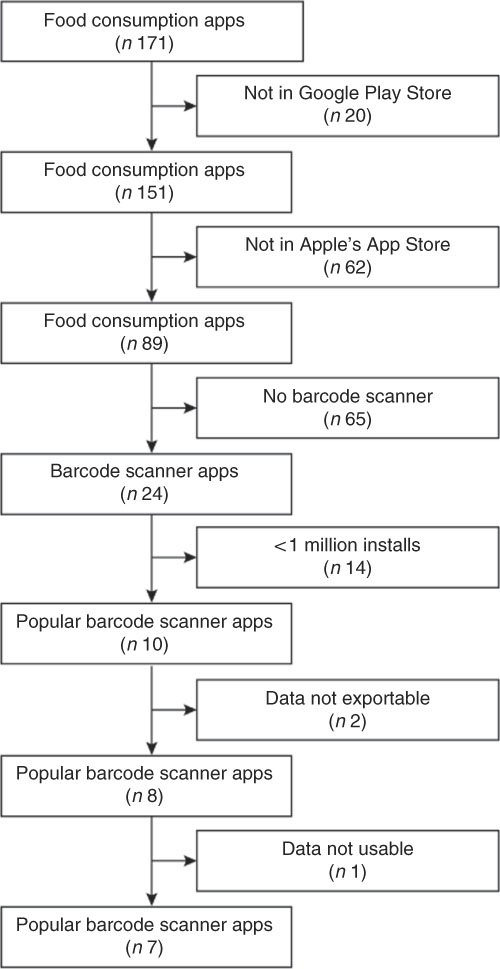
In a recent study, Maringer et al. created an inventory of 171 apps available in the Google Play Store and Apple’s App Store that enable users to monitor dietary intake( Reference Maringer, Van’t Veer and Klepacz 15 ). These two app distribution services were used as primary sources for apps, because they provide the apps available for Android and iOS devices, respectively. Android and iOS devices together hold a current market share of 99·7 % worldwide( 16 ). From this data set we selected apps that were available in both app stores (see Fig. 1). Within the resulting pool of food consumption apps (n 89), we identified twenty-four apps that implemented a barcode scanner for food product identification. Next, we excluded apps with less than 1 million installs from the Google Play Store and, as a result, our initial selection consisted of ten apps.
Flow diagram of the search for popular nutrition applications (apps) with barcode scanner and food recording feature, and the progression of app selection
Data export
After scanning a test sample of three products, we investigated the possibilities for exporting the collected data. Two of the selected ten apps did not provide the option to export the collected food consumption data, neither through the app’s user interface, home page or connected data aggregator (e.g. Apple’s Health app), and were therefore excluded from our selection. Data were freely available for download for four of the eight remaining apps from their websites as CSV (comma separated values) or Excel files. For the six apps that allowed data integration with Apple’s Health app, collected food consumption data were synchronized with the Health app and exported as an XML (Extensible Markup Language) file from its user interface. A web application was developed for the conversion of the provided XML format to a CSV format. If possible, we also exported CSV files of the collected food consumption data via the user interfaces of the apps’ home pages.
Data usability
Since food data per food product were essential for our investigation, we inspected the exported data regarding their usability for the present research purpose. For MyFitnessPal, product names were not available in the exported data file. Since nutrient and energy information was provided for each individual entry, we decided to record the product names from the app’s user interface for each response. This enabled us to further investigate this app. Data exported from Fitbit only included daily aggregated nutrient values (which could be expanded to averages per meal by upgrading to a paid user account) and hence Fitbit was excluded from our sample. All other apps provided food data on a product level and the final selection of apps included for testing the quality of the underlying labelled food product databases therefore consisted of seven food consumption apps (see Table 1).
Selected popular nutrition applications (apps) with barcode scanner and food recording feature, and their general characteristics
Labelled food product selection
We created a set of 100 labelled food products available in at least one of the two largest supermarket chains in the Netherlands (Albert Heijn and Jumbo). Food products were selected from the following five food groups contained in the Dutch Food Composition Database (NEVO): non-alcoholic beverages; milk and milk products; nuts, seeds and snacks; sugar, sweets and sweet sauces; and fats, oils and savoury sauces( 17 ). These food groups were chosen since most food products in these categories exist in packaged form and most likely include a barcode. Within these five food groups, prepared products (e.g. pastry puff cheese-filled prepared) and products that are unlikely to be available in supermarkets (e.g. cow’s colostrum) were excluded. From the resulting food products, we selected a set of twenty food items randomly within each food group. We included five spare food products in case some of the selected food products could not be found in the local supermarkets (see the online supplementary material, Supplemental Table 1, for a complete list of included food products). For more generic food products included from the NEVO (e.g. butter, ketchup), we arbitrarily selected a corresponding labelled product from the available products in the supermarkets (e.g. Campina gold butter, Jumbo tomato ketchup). Within the list of corresponding food products in the supermarket (see Supplemental Table 1), half of the food products were selected from premium brands and the other half from private Albert Heijn- or Jumbo-manufactured products. For each item in the list of selected food products we identified the corresponding labelled food product in one of the two local supermarkets and took a picture of the food label including nutrient information and barcode. In addition, from the collected images, energy and nutrient information was noted for each product.
Barcode scanning
Using the barcode scanner functionality of the seven included apps, we scanned the barcodes depicted on the collected images of the food product labels. Product information responses were logged as separate food diary entries. If possible, the portion size of a scanned product was set to 100 g or 100 ml before entering it into the food diary. This ensured a better comparison of the nutrient and energy contents of the food products from the app with the information provided on the food labels. Although all apps allowed users to adjust portion sizes for the entered foods, for 5 % (n 34) of the 700 scan episodes (7 apps × 100 products) we were unable to set the portion size to 100 g/100 ml. In these cases, we transformed the energy and nutrient values to match the value per 100 g/100 ml. For 1 % (n 9) of the scan episodes, no reference weight or volume was available for the provided energy and nutrient values (e.g. 1 piece Werthers Original, 1 scoop margarine). These values were excluded from further investigations.
Product identification
The percentages of non-response were calculated. In addition, product information responses from the apps were categorized into correct, incorrect and incomplete responses for each food product and each app. As the food products were selected from food groups from the NEVO database, each product scanned could be identified by its NEVO code. The researcher judged whether the product information the app provided would lead to the same NEVO code as originally selected (correct response), a different NEVO code (incorrect response) or if the information was not sufficient to choose between more than one NEVO code (incomplete response).
Availability of nutrient data
Data of the correctly identified products from the seven apps were further investigated regarding the availability of nutrient values for the scanned products. Percentages of available values were calculated for energy, fat, saturated fat, carbohydrates, sugar and protein. In addition, since the products selected in the supermarkets listed salt on their food labels, but none of the apps provided values for salt, but for sodium instead, we calculated the percentage availability for sodium instead of salt. These values are mandatory and must be provided by manufacturers on the label of their food products( 18 ).
Accuracy of nutrient data
The accuracy of the available nutrient data was calculated for the correctly identified products only. The values on the food labels were compared with the values provided by the apps for energy, fat, saturated fat, carbohydrates, sugar, protein and sodium. For each nutrient and each app, we calculated the percentage of food products with nutrient values from the app that deviated not more than 5 % from the values on the food labels. To calculate the deviation of sodium values, we calculated sodium values based on the salt values from the packaged food labels (1 g salt=0·4 g Na).
Results
Product identification
The number of incorrectly identified products was overall relatively low, with an average of 4 % incorrectly identified products. The product identification rates varied strongly between apps (see Fig. 2). MyFitnessPal identified most scanned products correctly with 96 % correct responses, followed by Virtuagym Food with 88 % and Lifesum with 72 % correct responses. Lose it! and SparkPeople identified the smallest number of scanned products with 25 and 5 % correctly identified products, respectively. FatSecret showed, with 10 %, the largest number of incorrectly identified products in the sample. The smallest number of incorrectly identified products was shown by MyFitnessPal and Yazio with 1 % each. The number of incomplete responses varied between 17 % for Lifesum and 0 % for SparkPeople.
Identification rates (
![]() , complete;
, complete;
![]() , incomplete;
, incomplete;
![]() , wrong) of scanned food products for each selected popular nutrition application (app) with barcode scanner and food recording feature. One hundred products from the two largest supermarket chains in the Netherlands were scanned using the barcode scanner of the selected apps and the researcher judged whether the product information the app provided would lead to the same NEVO code as originally selected (NEVO, Dutch Food Composition Database)
, wrong) of scanned food products for each selected popular nutrition application (app) with barcode scanner and food recording feature. One hundred products from the two largest supermarket chains in the Netherlands were scanned using the barcode scanner of the selected apps and the researcher judged whether the product information the app provided would lead to the same NEVO code as originally selected (NEVO, Dutch Food Composition Database)

Availability of nutrient data
Whereas information about the mandatory product data including energy, fat, saturated fat, carbohydrates, sugar, protein and salt was provided on the nutrient label of all scanned products, the product information provided by the apps varied strongly between apps (see Table 2). In general, the most reported product information was energy which was on average reported for 100 % of the correctly identified products, followed by fat for an average of 94 %, carbohydrates for 92 % and protein for 88 % of the correctly identified products. Saturated fats and sugar were reported by MyFitnessPal, FatSecret, Lifesum and Lose It!. MyFitnessPal data contained, with energy and fifteen additional nutrients, the largest array of product data and was the only app that provided values on mono- (for 90 % of correctly identified products) and polyunsaturated fats (87 %), calcium (40 %), vitamin C (43 %) and iron (38 %). The smallest number of nutrients was provided by Yazio and Virtuagym Food with energy and the three macronutrients fat, carbohydrates and protein (all of which were provided for 100 % of the correctly identified products from both apps). A large number of nutrients provided on the labels of the scanned products was not represented in the exported data (e.g. vitamins). Four of the investigated apps provided values for sodium (in milligrams) and none of the apps provided values for salt.
Availability of energy and nutrient values for correctly identified products (%), and available energy and nutrient values deviating not more than 5 % from values on product labels (%), for the selected popular nutrition applications (apps) with barcode scanner and food recording featureFootnote *

n/a, not applicable.
* Energy and nutrient values of 100 food products from the two largest supermarket chains in the Netherlands were obtained using the barcode scanner of the selected apps and compared with corresponding data from photographs of the food label including nutrient information and barcode.
† Number of correctly identified food products.
‡ Availability.
§ Deviation from true value.
Accuracy of nutrient data
Accuracy of the available nutrient data varied between apps and type of nutrient value (see Table 2). Overall, energy and fat values were reported most accurately by the apps with an average of 79 % of accurately reported values within the 5 % range of deviation. Sugar and protein were reported on average the least accurately, with 64 % of accurately reported values each. Considering the number of correct identifications and the number of product data provided, MyFitnessPal appeared the most accurate among the investigated apps with an overall average of 74 % of accurately reported values. As with all investigated apps, MyFitnessPal’s accuracy, however, varied strongly depending on the type of information investigated. Whereas energy values deviated for 89 % of the scanned products not more than 5 % from the value on the label, sugar values deviated for 54 % of the scanned products not more than 5 % from the value on the label.
Discussion
The aim of the present study was to investigate the quality of the labelled food product databases underlying popular diet apps with barcode scanners. The variation in the number of correctly identified food products suggests that the effectiveness of barcode scanning for product identification depends on the app used. MyFitnessPal and Virtuagym Food appeared to be the most suitable apps for product identification among the investigated apps. Due to the overall low percentage of incorrectly identified products, the investigated apps appear to be useful for assessing diets on the product level. Product brand names can provide valuable information for researchers interested in users’ product preferences and choices. In addition, since energy was overall reported very consistently and accurately, the collected data of the investigated apps might also provide valuable insights in users’ energy intake in relation to the specific products they consume. The variations in availability and accuracy of nutrient information such as protein, carbohydrates or sugar for the scanned products implies, however, that these values lack the necessary consistency and accuracy for assessing dietary intake on the nutrient level. Nutrient values for the scanned products might be estimated post hoc by matching the identified products to product entries in a quality-controlled food composition database (e.g. NEVO). This way of estimating nutrient intake is less efficient, albeit more accurate.
Several aspects might have contributed to the availability and accuracy of reported nutrient information in the present research. Continuously updating a large food product database is challenging since food manufacturers might reformulate food products, which results in outdated nutrient values in food databases( 19 , Reference Carter, Hancock and Albar 20 ). In addition, not only the nutrient content of products might vary depending on the country of origin( Reference Pickles and Poulter 21 ), but also the requirements for food labels might differ in different countries( Reference Entis 22 ). Products sold in the USA, for instance, list sodium content (measured in milligrams) on nutrition labels, while the European Union lists salt content (measured in grams). The presence of sodium values in the data of the investigated apps and the absence of salt values might be an indication of these country-specific differences. Hence, the comparison of the same product from different countries might be challenging and a potential source of deviation. What is more, all investigated apps allowed users to add food products to the database. Due to the user-generated nature of the databases, it is possible that users enter incomplete or incorrect food data( Reference Carter, Burley and Cade 14 , Reference Chen, Cade and Allman-Farinelli 10 ). Next, the absence of quality control increases the chance for incorrect food product entries. Although the presence of professional database quality controls could not be identified for the investigated apps, we identified user-based quality controls in all apps. MyFitnessPal and Lose It!, for instance, use a quality label in the form of a ‘checkmark’ that can be assigned to correct food products. Although it is claimed that such labels aim to make food product information more reliable( 23 ), it remains unclear whether such user-based quality controls are able to enhance the quality of the underlying food database. It should be noted that the presence of a quality label for a specific food product was not visible in the exported data, but was solely indicated in the apps’ user interfaces. Finally, the larger availability and accuracy of energy and fat as opposed to other values might be related to the stated purposes of the investigated apps, which were prominently related to weight loss.
An important source of the variability in identification rates of the investigated apps might also be the size and diversity of an app’s user base. MyFitnessPal, which has the largest number of estimated downloads and supports a large array of languages (including Dutch), showed the largest number of correct identifications of the investigated apps. In contrast, SparkPeople and Lose it!, which were available only in English, correctly identified less than a quarter of the scanned products. Although our selection of products for testing database quality also contained premium international brands, all products were selected from Dutch supermarkets. A large portion consisted of national as well as private supermarket brands. Hence, the cultural background of the selected sample of products might have favoured some apps over the others. The company behind Virtuagym Food, for instance, is located in the Netherlands, which might explain the higher proportion of correctly identified products as compared with other apps whose developers are located outside the Netherlands and are available only in English. Since product identification rates are likely to depend on how commonly the scanned products are consumed by the apps’ user bases, selecting products from a different country, or based on product sales data (e.g. high v. low selling products), might have yielded different results.
Considering the overall low accuracy of the nutrient values of products listed in the food product databases underlying popular nutrition apps, there might be a common need by nutrition researchers as well as app vendors for efficient access to harmonized, country-specific and quality-controlled food composition databases which reflect the wide range of labelled food products available to consumers. Such a database might not only increase the efficiency and quality of commercial diet apps, but might also encourage more innovation in research-driven app development. In addition, access to quality-controlled food product databases is important not only for dietitians, nutrition researchers and health professionals interested in utilizing barcode scanning for dietary assessment purposes, but also for users of diet apps who previously indicated their need for accurate food data( 19 ) and complained about missing or incorrect food products( Reference Carter, Hancock and Albar 20 – 23 ). In addition, food manufacturers and retailers might also benefit, since the quality of the food data retrieved from nutrition apps might have a strong influence on users’ future shopping behaviours( 24 ).
Practical issues
Some additional issues were identified in the investigated apps which might have negative implications regarding the use of the apps for nutrition research. In some apps only standard portion sizes, defined by the app, could be assigned to the scanned products. Standard portion sizes might be helpful for consumers who are unable to estimate the amount consumed from a specific food; however, this will result in less precise estimates at the individual level and less variation between people. In addition, the specified portion size for each scanned food product was available only in the Lifesum data set and none of the apps provided food consumption date and time information in the exported Health app data. Only three of the apps (MyFitnessPal, Lose It!, Lifesum) provided information about the meal during which the products were consumed or entered. Date and time of consumption, meal information and portion sizes, however, were available in the data sets exported from the apps’ home pages. Hence, the type of food consumption data available varied depending on the data export method. Although MyFitnessPal was found to be most complete and accurate in the sample of apps investigated, values of food products entered at the same eating moment (e.g. breakfast) were summed when the data were synchronized with the Health app, which resulted in cumulative values for each eating moment, instead of separate entries for each food product. In addition, food product names appeared in the app, but were lacking in the XML file, which renders food identification based solely on the exported data impossible.
Finally, data could only be exported from the websites of less than half of the investigated apps. The lack of procedures for exporting collected data poses a clear barrier for nutrition researchers towards data sharing and analysis( 24 – Reference Chen, Lieffers and Bauman 26 ). Although Apple’s Health app provides a convenient solution to export data from various apps using a single interface, converting the exported XML file into a spreadsheet-compatible format is challenging and requires at least basic levels of programming expertise. The major challenge with processing Apple’s Health data was the lack of harmonization between the data collected from the various connected apps( 27 ). In addition, the availability of nutrient values for the scanned food products also varied between data export method. Both FatSecret and Lose It! provided fewer nutritional values when data were retrieved via the Health app compared with data exports from the home page.
Conclusion
The variability in the number of identified products and the availability and accuracy of nutrient data provided might indicate variations in the investigated apps’ effectiveness and precision for dietary assessment purposes. Whereas popular diet apps with barcode scanners might be more valuable for dietary assessments on the food product and energy level, they appear less suitable for assessments on the nutrient level. Allowing users to actively take part in the database compilation process might have advantages for generating more complete and representative repositories of food products. In combination with the absence of professional quality control routines, however, this approach might favour the quantity of the available food products at the expense of their quality. A closer collaboration between app vendors, food manufacturers and nutrition researchers might be beneficial for creating harmonized, country-specific and quality-controlled food databases.
Acknowledgements
Financial support: This research received no specific grant from any funding agency in the public, commercial or not-for-profit sectors. Conflict of interest: The authors certify that they have no affiliations with or involvement in any organization or entity with any financial interest (such as honoraria; educational grants; participation in speakers’ bureaus; membership, employment, consultancies, stock ownership or other equity interest; and expert testimony or patent-licensing arrangements) or non-financial interest (such as personal or professional relationships, affiliations, knowledge or beliefs) in the subject matter or materials discussed in this manuscript. Authorship: M.M. made substantial contributions to conception and design, analysis and interpretation of data and the manuscript draft; and gave final approval of the manuscript to be published. N.W.-V. made substantial contributions to conception and design, acquisition of data, analysis and interpretation of data; and provided critical revisions of the manuscript and final approval of the manuscript to be published. P.v.t.V. was involved in revising the manuscript critically for important intellectual content and gave final approval of the manuscript to be published. A.G. made substantial contributions to conception and design, analysis and interpretation of data; was involved in revising the manuscript critically for important intellectual content; and gave final approval of the manuscript to be published. Ethics of human subject participation: Not applicable.
Supplementary material
To view supplementary material for this article, please visit https://doi.org/10.1017/S136898001800157X