


Implications
Leg weakness in pigs is a serious problem in the pig industry. It leads to a decrease in the longevity of breeding pigs and an increase in the rate of premature culling of breeding animals in breeding programs. In addition, the production performance of pigs will be influenced dramatically. Our study will help to solve these problems through studying the genetic architecture of limb-and-hoof firmness in three commercial pig populations. It will accelerate the progress in genetic breeding, decrease the cost for the pig industry, improve animal welfare and provide useful information for the study of human osteoporosis.
Introduction
Reproduction performance and service longevity are economically important and have been intensively selected in the global pig industry. Leg weakness (LW) has a great impact on fitness and service longevity of animals, which influences not only animal welfare but also production and reproduction performance. Pigs with LW are more likely to suffer from limb-and-hoof diseases and be eliminated early, which greatly limits the service longevity of excellent pigs. Some previous studies reported that better leg status would decrease involuntary culling through the genetic correlations between LW-related traits and longevity in breeding sows (de Sevilla et al., Reference de Sevilla, Fabrega, Tibau and Casellas2009). Dissection of the genetic architecture of LW in pigs not only benefits the pig industry and animal welfare but also sheds insight into our understanding of human osteoporosis because pig is an ideal animal model for humans and the shape and size of pig’s organ is similar to that of humans.
The factors that cause LW are mainly environment, nutrition and heritability. Heritability may have more influence on LW, because pigs are bred with the same diet and environment, according to their growth requirements in modern pig farms (Fukawa and Kusuhara, Reference Fukawa and Kusuhara2001). Previous studies had detected a series of quantitative trait locus (QTLs) with LW on pig chromosomes 1, 2, 3, 10 and 11 in multiple populations (Laenoi et al., Reference Laenoi, Uddin, Cinar, Großebrinkhaus, Tesfaye, Jonas, Scholz, Tholen, Looft and Wimmers2011). Nevertheless, due to a low density of microsatellite markers, the application of these identified QTLs in pig breeding programs is hindered. With the commercialization of the Illumina PorcineSNP60 Beadchip in 2008, genome-wide association study (GWAS) have been widely explored to detect associations with LW (Rangkasenee et al., Reference Rangkasenee, Murani, Brunner, Schellander, Cinar, Luther, Hofer, Stoll, Witten, Ponsuksili and Wimmers2013; Rothammer et al., Reference Rothammer, Bernau, Kremer-Rücker, Medugorac and Scholz2017). However, the study of LW compared with other traits is limited, especially in pig populations. Additionally, the methods for measuring phenotypes, including scoring, slaughtering and dual-energy X-ray absorptiometry, are not suitable (Fan et al., Reference Fan, Onteru, Mote, Serenius, Stalder and Rothschild2009; Laenoi et al., Reference Laenoi, Uddin, Cinar, Großebrinkhaus, Tesfaye, Jonas, Scholz, Tholen, Looft and Wimmers2011), because the score system is subjective and dual-energy X-ray will affect the health of pigs. Furthermore, slaughtering pigs will finish their service directly, and it is not advisable. Therefore, applying an unharmful and objective method to assess the LW of alive pigs will benefit animal welfare and improve the accuracy of phenotype data. Bone mineral density (BMD) can reflect how weakness the leg is, our phenotypic data were measured objectively and harmlessly for pigs by ultrasonic bone densitometer and the genotype data were acquired by genotyping-by-sequencing (GBS).
The aim of our study was to identify single-nucleotide polymorphism (SNP) associated with BMD across three populations, including Duroc, Landrace and Yorkshire pigs, by GWAS method.
Materials and methods
Animals and phenotypic measurements
Pigs were not raised or treated distinguishingly in any way for the purpose of this study, and for this reason, the ethical statement was not needed. A total of 812 purebred sows (115 Duroc, 243 Landrace and 454 Yorkshire) were included in this study. They are all from a large-scale pig farm in Guangxi, China. To avoid the impact of nutrition and environment, these pigs with different parties were fed with the same diet in the same fenced environment. The floor type of this pig farm was leaky, and the pig house was cooled by water curtain and ventilated by negative pressure. At the beginning of the measurement, we recorded the individual identification (ID), breed, age and parity in detail. Then we collected the ear tissue of each pig from June to November 2017 for subsequent genotyping. The BMD was measured using an ultrasonic bone densitometer from the company Sunlight, Petah Tikva City, Israel. The measurement time of BMD is 1 day after sow parturition, and the target position was the metatarsal bone of the left back leg. The measurement method had been described in detail in Shanks (2016). The result measured by the ultrasonic bone densitometer is the speed of sound (SOS) in bone, rather than the actual BMD value. However, we can use the SOS as the BMD value because of the positive correlation between SOS and BMD based on previous studies (Peter et al., Reference Peter, Charles, Gonzales, Anderson, Sakhaee and Rubin1993; Moris et al., Reference Moris, Peretz, Tjeka, Negaban and Bergmann1995). According to the classified recommendation of World Health Organization in 1994, we classified these sows with their BMD data. The criteria for judging the weakness of legs is shown in Supplementary Table S1. Bone strength: SOS > A + SD; normal bone: A − SD < SOS < A + SD; less bone: A − 2.5SD < SOS < A − SD and osteoporosis: SOS < A − 2.5SD.
Excel 2016 software was used to record the phenotype data and statistics was run with the number of individuals and the mean, variance, CV, maximum and minimum of BMD. Breed, parity and age were taken as factors affecting BMD. Multivariate variance analysis was applied to analyze which factor impacts the metatarsal BMD of sows more, and multiple comparisons were performed among sows of different breeds, parities and ages using R Studio software (version 3.5.3) (Racine, Reference Racine2012).
Genotyping-by-sequencing
The ear tissue samples that acquired from 812 purebred sows were stored in 75% alcohol. DNA was extracted using TIANamp Genomic DNA kits (Tiangen Biotech, Beijing, China), and the DNA concentration was measured with spectrophotometer (Nanodrop 2000; Thermo Fisher Scientific, Wilmington, DE, USA). Meanwhile, the quality of DNA was tested by agarose gel electrophoresis. After that the DNA was diluted to 100 ng/µl for genotyping with HiSeq X Ten (Illumina, Inc., San Diego, CA, USA).
Single-nucleotide polymorphism calling and genotype estimation
The quality control of low-quality data for the initial sequence mainly includes two steps: remove the joint reads and the low-quality base reads. Cutadapt software (version 1.5) was applied to cut the joint reads and adjust the error rate to 0.1. Low-quality reads were removed using Sickle software (Joshi and Fass, Reference Joshi and Fass2011). The conditions that satisfied the exclusion criteria were as follows: the mass value of each base was not less than 10, and the length of reads was not less than 20. If the first base of reads was N, it would be removed.
All clean reads of individuals were aligned against the NCBI Sus scrofa 11.1 genome (https://www.ncbi.nlm.nih.gov/) using Burrows-Wheeler Aligner (BWA) (Li and Durbin, Reference Li and Durbin2009). Then the results of the alignment were filtered, and only the reads in which both ends were aligned to the same location were retained. Then Picard (http://broadinstitute.github.io/picard/) was used to sort the data that passed the quality control and remove the repetitive reads generated by PCR amplification.
The Genome Anlysis Toolkit (GATK) software (version 3.8.0) (Mckenna et al., Reference Mckenna, Hanna, Banks, Sivachenko, Cibulskis, Kernytsky, Garimella, Altshuler, Gabriel and Daly2010) was used to perform partial multiple alignment after eliminating the repetitive reads. The aim was to reconstruct the regions including sequence with insertion or deletion (Indel). Detecting variation depends heavily on the quality of the bases; therefore, the base quality score needs to be recalibrated (BQSR) after partial multiple alignment. The BQSR is an important (or even the only) indicator to evaluate whether the bases are correct. The HaplotypeCaller module of GATK software was used to detect and filter the variation in samples.
The SNPs that satisfy the following conditions were retained:
 $${\rm{QUAL }} < 30.0\left| {\left| {{\rm{ QD }} < 2.0} \right|} \right|{\rm{ FS }} > 60.0\left| {\left| {{\rm{ MQ }} < 40.0} \right|} \right|{\rm{ SOR }} > 4.0||{\rm{ ReadPOSRanSum }} < - 8.0;$$
The parameter of Indel variation is:
 $$\eqalign{{\rm{QUAL }} < 30.0| {| {{\rm{ QD }} < 2.0} |} |{\rm{ FS }} > 200.0| {{\rm{ SOR }}} \cr {\ > 10.0} || {{\rm{ InbreedingCoeff }}} \cr {\ < - 0.8 } || {{\rm{ ReadPOSRankSum }} < 20.0} || {{\rm{ MQ }}} \cr {\ < 40.0} ||{\rm{ MQRankSum }} < - 12.5.$$
Quality control and imputation
A total of 224 162 SNPs were obtained from GBS, and quality control was carried out by Plink (version 1.9) (Purcell et al., Reference Purcell, Neale, Todd-Brown, Thomas, Ferreira, Bender, Maller, Sklar, Bakker and Daly2007). Briefly, SNPs with minor allele frequencies of less than 0.01 or a low call rate of less than 90% were removed. Samples with low call rates of less than 80% were also removed. Missing genotype data were imputed by Beagle (version 4.0) program (Browning and Browning, Reference Browning and Browning2007). Then quality control was carried out again. Finally, a set of 218 141 SNPs was selected for subsequent genome-wide association analysis.
Genome-wide association analysis
According to the results of multivariate analysis of variance and previous studies, we used the FarmCPU model (Liu et al., Reference Liu, Huang, Fan, Buckler and Zhang2016) of the R package MVP developed by Xiaolei Liu (https://github.com/XiaoleiLiuBio/rMVP) to perform a genome-wide association analysis. The FarmCPU model used a fixed effects model and a random effects model as the loop. The fixed effects model was used to detect genetic markers $m$ one by one. Potential association sites were included in the model as covariates to control false positive. Fixed effects model can be written as follows:
 $${y_i} = {M_{i1}}{b_1} + {M_{i2}}{b_2} + \ldots + {M_{it}}{b_t} + {S_{ij}}{d_j} + {e_i}$$
where  ${y_i}$ is the observation value of the ${i^{{\rm{th}}}}$ individual; ${M_{i1}},{M_{i2}} \ldots ,{M_{it}}$ as the genotype of potential association sites were added to the model, which is empty in the first iteration; ${b_1},{b_2},$…, ${b_t}$ as the corresponding effect value of potential association sites were added to the model; ${S_{ij}}$ is the genotype of the ${j^{{\rm{th}}}}$ genetic marker of the ${i^{{\rm{th}}}}$ individual; ${d_j}$ is the corresponding effect value of ${S_{ij}}$ and ${e_i}$ is a residual vector which obeys a normal distribution with zero mean and variance of $\sigma _e^2$.
The random-effects model uses the SUPER algorithm to optimize the potential association sites of different combinations using the P value and location information of the genetic markers. Random effects model can be written mathematically as follows:
 $${y_i} = {u_i} + {e_i}$$
where  ${y_i}$ is the observation value of the ${i^{{\rm{th}}}}$ individual; ${u_i}$ is the total genetic effect of the ${i^{{\rm{th}}}}$ individual and ${e_i}$ is a residual vector which obeys a normal distribution with zero mean 0 and variance of $\sigma _e^2$.
The expected value of the total genetic effect is 0, and the variance and covariance matrix of the individual’s total genetic effects is  $G = 2K\sigma _a^2$, where $\sigma _a^2$ is an unknown genetic variance and K is a kinship matrix calculated from the significant association sites of different combinations.
In our study, we took breed as fixed effect because it is an intrinsic characteristic, parity and age that can be changeable were added as covariates in the fixed effect model for association test. In addition, pseudo quantitative trait nucleotides (QTNs) were added as covariates. The fixed effects model in our study can be written as:
 $$y = A{b_a} + {M_t}{b_t} + {S_j}{d_j} + e$$
where  $y$ is phenotypic observation vector (BMD); A is a matrix of fixed effects, including breed, parity and age; ${M_t}$ is the genotype matrix of $t$ pseudo QTNs that was used as fixed effects; ${b_a}$ and ${b_t}$ are the relevant matrices designed for $A$ and ${M_t}$, respectively; ${S_j}$ is the ${i^{{\rm{th}}}}$ marker to be tested and ${d_j}$ is the corresponding effect; $e$ is the residual effect vector and obeys a normal distribution with zero mean and variance of $\sigma _e^2$.
The random effect model in our study is written as:
 $$y=u + e$$
where  $y$ and $e$ stay the same as in fixed effects model and $u$ is the genetic effect.
Gene ontology
The associated gene stable IDs located in the 1 Mb region on either side of significant SNPs were extracted from the Ensembl genome browser (http://asia.ensembl.org/index.html). Gene ontology enrichment analysis was performed using the database for annotation, visualization and integrated discovery (DAVID) (https://david.ncifcrf.gov/).
Result
Statistical analysis of metatarsal bone mineral density
In order to determine the main and interactive effects of breed, parity and age on metatarsal BMD in sows, variance analysis was performed among the three varieties of sow. The result (Table 1) showed that breed, parity and the interaction effects between breed and parity on metatarsal BMD of sows were very significant (P < 0.01).
Variance analysis of the metatarsal BMD in the Duroc, Landrace and Yorkshire pig breeds

‘***’ = indicates a highly significant difference; ‘–’ = indicates no significant difference; BMD = bone mineral density.
Then the mean, SD, CV, maximum and minimum values of metatarsal BMD of different breeds were summarized. From the result (Supplementary Table S2), we know that the metatarsal BMD of Duroc was the lowest, and the average ultrasound value was 4130.33 m/s. The maximum and minimum BMD values of Landrace were the highest among the three breeds, indicating that Landrace have the best limb-and-hoof firmness among the three breeds. Then we make multiple comparisons using Tukey honest significance test (HSD) method. The result (Supplementary Table S3) showed a very significant difference in metatarsal BMD between Duroc and Landrace as well as Yorkshire (P < 0.01), but no significant difference was observed between Landrace and Yorkshire (P > 0.05).
Age was divided into different age-groups at an interval of 100 days for statistical analysis of the mean, SD, CV, maximum and minimum values of metatarsal BMD in different age-groups. The result (Supplementary Table S4) showed that the highest metatarsal BMD was age-group 8 (SOS = 4695 m/s), and the lowest BMD was age-group 5 (SOS = 3388 m/s). Then we make multiple comparisons using Tukey HSD method to find out which age-groups are significantly different. The results of multiple comparisons among different age-groups (Supplementary Table S5) showed that there is very significant difference in metatarsal BMD between age-group 1 and three age groups (age-group 6, 8 and 9) (P < 0.01). And there is very significant difference in metatarsal BMD between age-group 2 and age-group 6 (P < 0.01). Also, age-group 3 has significant difference in metatarsal BMD with three age groups (age-group 5, 6 and 8) (P < 0.01).
According to the different parities, the mean, SD, CV, and maximum and minimum values of metatarsal BMD were calculated. The result (Supplementary Table S6) showed that the mean of metatarsal BMD was the largest in the eighth parity (SOS = 4365 m/s) and the smallest in the second parity (SOS = 4203 m/s). Only three sows had reproduced six times, so there was no further analysis with this parity. The metatarsal BMD of the sows with first and second parities was significantly lower than that of the sows with third, fourth, fifth, seventh and eighth parities (P < 0.01). Then we make multiple comparisons using Tukey HSD method to find out which parities are significantly different. The results (Supplementary Table S7) showed that the metatarsal BMD of the first parity has very significant difference with two parities (the fourth and the fifth parity) (P < 0.01). And there is aslo very significant difference in metatarsal BMD between the second parity and four parities (the third, the fourth, the fifth and the seventh parity) (P < 0.01).
Genome-wide association analysis
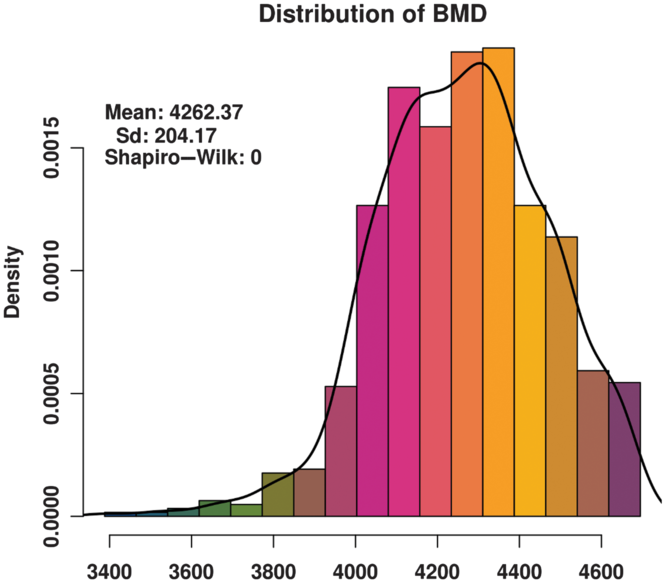
The BMD of these animals basically conforms to a normal distribution (Figure 1) and satisfies the GWAS phenotype data requirement. The distribution of SNPs on chromosomes (Supplementary Figure S1) shows that the coverage and quality of the SNPs is enough for subsequent genome-wide association analysis.
Histogram of the bone mineral density (BMD) distribution among three varieties (Duroc, Landrace and Yorkshire) of sow. Standard deviation is abbreviated as SD. The x-axis indicates the speed of sound in the metatarsal, that is, BMD. The y-axis indicates the density of experimental animals. The Shapiro-Wilk test shows that the phenotype data satisfy a normal distribution.
The association analyses were conducted using the FarmCPU model of the R package MVP. From the quantile-quantile (Q-Q) plot (Figure 2a), the y-axis indicates observed value (−log10(P-value)) and the x-axis indicates expected value (−log10(probability value of uniform distribution)). We can see a very high-fitting precision between observed value and expected value when the P-value is more than 10e−4. And a separation appears seriously when the P-value is less than 10e−4. It indicates a significant natural selection between phenotype and genotype. And the lambda value of the Q-Q plot is 0.973, indicating a slight population stratification. The Manhattan plot (Figure 2b) shows that nine SNPs significantly associated with BMD were found on SSC3, SSC5, SSC6, SSC7, SSC9, SSC10, SSC12 and SSC18 (SSC stands for Sus scrofa chromosome). The details are shown in Table 2, and these loci that related to BMD are reported for the first time as far as we know. But some genes that located adjacent to significant SNPs are reported in previous studies, and we will show them in the discussion section.
(a) Quantitle-quantitle (Q-Q) plots of the observed P values for bone mineral density (BMD) of three populations (Duroc, Landrace and Yorkshire). The Q-Q plot shows the observed −log10P values (y-axis) and the expected −log10P values (x-axis). And the lambda value on Q-Q plot is 0.973. (b) Manhattan plot of the observed P values for BMD of three populations (Duroc, Landrace and Yorkshire). The horizontal black line in the Manhattan plot indicates the genome-wide (2.29 × 10⁻⁷) threshold. FarmCPU: a model for genome-wide association study and the abbreviation of fixed and random model circulating probability unification.

SNPs significantly associated with BMD obtained by GWAS among three varieties (Duroc, Landrace and Yorkshire) of sow

BMD = bone mineral density; GWAS = genome-wide association study; SNP ID = single-nucleotide polymorphism identification, where ‘S + chromosome + position’ is the name of the marker; SSC = Sus scrofa chromosome.
Gene ontology
Genes within 1 Mb distance on either side of lead SNPs were downloaded from the Ensembl genome browser. The GO enrichment analysis was performed using DAVID, and the secondary classification bar plot and the bubble plot of GO results are shown in Supplementary Figure S2 and Figure 3, respectively. These genes are mainly enriched in these GO terms such as ATP binding, lipid transport and ATPase activity. To identify candidate genes related to BMD, we manually queried the NCBI database and PubMed to find genes related to bone development, bone cell differentiation or bone metabolism. Eventually, gene cullin protein family member 7 (CUL7), tyrosine protein kinase 7 (PTK7), serum response factor (SRF), vascular endothelial growth factor A (VEGFA), Ras homologs (RHEB), protein kinase A regulatory subunit 1α (PRKAR1A) and thrombopoietin (TPO) were selected as candidate genes related to BMD. The details are shown in Table 3.
Top 10 enriched gene ontology (GO) terms for bone mineral density (BMD) in sow. Rich factor indicates the percentage of genes associated with the pathways with respect to the total number of genes in the pathway; gene number indicates the quantity of genes associated with these pathways.

Important candidate genes related to BMD among three varieties (Duroc, Landrace and Yorkshire) of sow

BMD = bone mineral density; SSC = Sus scrofa chromosome; mTORC1 = mammalian target of rapamycin complex 1; cAMP = cyclic adenosine monophosphate.
Discussion
The BMD as a parameter to evaluate LW is conducive for genetic improvement. At present, the methods that evaluate LW are mostly visual evaluation, which is subjective. In order to fully identify markers related to LW, if the data generated by subjective evaluation methods were integrated, the measurement error will be further amplified and the result will be more inaccurate. The evaluation of leg appearance is usually classified into different grades according to the degree of injury or firmness, and the classification may also lead to a large CV. The CV of the hind limb structure score was as high as 40% in Laenoi’s experimental animals (Laenoi et al., Reference Laenoi, Uddin, Cinar, Großebrinkhaus, Tesfaye, Jonas, Scholz, Tholen, Looft and Wimmers2011), and the CV of the limb-and-hoof structure score was 6.09% to 15.38% in Guo’s experimental population (Guo et al., Reference Guo, Ai, Ren, Wang, Wen, Mao, Lan, Ma, Brenig and Rothschild2009). In addition, the swelling of the joint is considered one of the criteria in the leg structure score, but it is related to the environmental factors such as hard floor and humid air. The methods of the gait score and joint injury score emphasize that the evaluator should strictly obey the evaluation criteria which indicate a fluctuation in the appearance score to some extent. Quantitative traits are greatly affected by phenotype data. The accuracy of phenotype data directly affects the accuracy of the results. A correct and objective evaluation method is a basis of genetic improvement in limb-and-hoof firmness.
Low BMD is the main cause of bone fracture and osteomalacia. The pain of limb-and-hoof fracture is more severe than hoof injury and joint swelling (Jensen et al., Reference Jensen, Kristensen and Toft2012). Pigs with fractures are difficult to cure and are eliminated frequently, and even if they are not eliminated, their reproductive performance will decrease significantly. Adult pigs with larger body weight need higher requirement for limb-and-hoof firmness. Improving BMD can help reduce the probability of elimination due to limb-and-hoof fracture. Fracture is influenced by genetic factor to a great extent. Blott showed that the ZNF804A gene is a candidate gene related to fracture (Blott et al., Reference Blott, Swinburne, Sibbons, Fox-Clipsham, Helwegen, Hillyer, Parkin, Newton and Vaudin2014), and Li found three QTLs related to BMD affect fracture severity (Li et al., Reference Li, Masinde, Gu, Wergedal, Mohan and Baylink2002). In addition, 11 QTLs affecting lower extremity weakness were found by limb-and-hoof score and measuring BMD (Laenoi et al., Reference Laenoi, Uddin, Cinar, Großebrinkhaus, Tesfaye, Jonas, Scholz, Tholen, Looft and Wimmers2011). Moreover, the CV of BMD in our phenotype data was approximately 6.00% similar to that of Laenoi’s experimental animals. Therefore, BMD as an index for evaluating limb-and-hoof firmness is of great significance for genetic improvement and breeding.
The GBS is a simplified genome sequencing technology. The genomic DNA was digested and two ends of the digested fragment were sequenced with high-throughput sequencing. The genotype obtained by GBS is accurate, reaching 92.6% and consistent with that of the chip of more than 99% (Pértille et al., Reference Pértille, Guerrero-Bosagna, Silva, Boschiero, Nunes, Ledur, Jensen and Coutinho2016; Wang et al., Reference Wang, Xuemin, Yiqiang, Jing, Xiaoxiang, Ning and Peng2017). Moreover, the SNPs obtained by GBS are distributed evenly in the functional area of chromosomes and can represent the genomic information of individuals well (Gurgul et al., Reference Gurgul, Mikszacybulska, Szmatoła, Jasielczuk, Piestrzyńskakajtoch, Fornal, Semikgurgul and Bugnoponiewierska2018). In addition, GBS is economical and efficient and has high throughput. Currently, commercial SNP chips are usually used for sequencing, but the density of the SNP chips is low and the number of markers is limited while the price of high-density SNP chips or resequencing is more expensive which makes it difficult to sequence for large-scale populations. Although advanced imputation algorithm provides a more powerful tool for a question of low coverage in GWAS, the accuracy of imputation is a bit different for various imputation algorithm. And the cost of sequencing is very high for some species with large genome. As we all know, whole-genome sequencing has a wide coverage, which can detect all genetic information in the individual genome with high accuracy. And it will have a wider application in the future with the development of commercial chips and the progress of technology compared with GBS. But GBS has a bit of an advantage to some extent now, it provides high-density markers and has a low cost for GWAS. Therefore, GBS can be used as an important sequencing technology in pig genetic research. In general, the raw genetic difference that was screened are obtained by mutagenizing or sampling from natural population. Any phenotypic difference that was identified is connected back to the underlying causative loci by various mapping approaches including QTL mapping. The GWAS is a powerful tool for connecting the genotype and phenotype in this perspective. Ibeagha-Awemu identified several significant SNPs and candidate genes associated with milk production traits and breast function in dairy cows by GBS (Ibeagha-Awemu et al., Reference Ibeagha-Awemu, Peters, Akwanji, Imumorin and Zhao2016). The SNPs related to teat number, litter size, litter weight and other complex reproductive traits were identified in different pig populations based on the GBS technology in some researchers’ studies (Tan et al., Reference Tan, Wu, Ren and Huang2017).
Nine SNPs related to BMD were significantly identified on eight chromosomes by GWAS. The reason why nine association sites were distributed on eight chromosomes might be that the GWAS method is not appropriate in certain circumstances or the genetic determinism is relatively complex. Previous study showed that GWAS involve the detection and interpretation of epistasis. However, many epistasis detection algorithms cannot be directly applied into GWAS as many combinations of genetic components are present in only a small amount of samples or even none at all (Zhou et al., Reference Zhou, Liu and Su2016). Linear mixed models (LMMs) are widely used in GWAS to account for population structure and relatedness, for both continuous and binary traits. But LMMs are generally inappropriate for analyzing binary traits when population stratification leads to violation of the LMM’s constant-residual variance assumption (Chen et al., Reference Chen, Wang, Conomos, Stilp and Lin2016). There is no population stratification for our experimental animal, according to the front analysis result. In addition, our samples are relatively large to endure the accuracy of our result. After enrichment analysis and annotation for all candidate genes, the genes CUL7, PTK7, SRF, VEGFA, RHEB, PRKAR1A and TPO related to bone development, bone differentiation and bone metabolism were considered candidate genes related to BMD. The genes CUL7, PTK7, SRF and VEGFA are related to bone development and bone homeostasis. Patients with human autosomal recessive disease 3-M syndrome grow slowly and suffer from facial deformities and skeletal dysplasia (Shaikh et al., Reference Shaikh, Shettigar, Kumar, Kantharia, Kurva and Cherian2019). Mutation or deletion of CUL7 is one of the main causes of 3-M syndrome (Dan et al., Reference Dan, O’Sullivan, Urquhart, Daly, Bhaskar, Biesecker, Cole, Kirk, Chandler and Donnai2011; Li et al., Reference Li, Pei, Yan, Yan, Cappell, Whitehurst and Xiong2014). Individuals with homozygous deletion of exon 18 of the CUL7 gene have short and thin skeletons at birth, and they will suffer from hip joint loss and scapula and joint deformation in adulthood (Meazza et al., Reference Meazza, Lausch and Pagani2013). Idiopathic scoliosis is caused by vertebral deformities. Mutation in PTK7 leads to abnormal Wnt signal pathway in zebra fish, leading to scoliosis (Hayes et al., Reference Hayes, Gao, Yu, Paria, Henkelman, Wise and Ciruna2014). The SRF regulates and adheres to genes that relate to migration by gathering cardiac hormone transcription factors that are regulated by G-actin. And the absence of function will lead to defects in the fetal cytoskeleton (Watts et al., Reference Watts, Lewiecki, Miller and Baim2008). VEGFA is an important regulator of osteogenic differentiation, bone development and bone homeostasis (Duan et al., Reference Duan, Murata, Liu, Nicolae, Olsen and Berendsen2015). It is necessary for osteoblast precursor differentiation to regulate the gathering of perichondral vascular and osteoblast differentiation by increasing beta-catenin expression and inhibiting the Notch pathway. Analysis of histomorphology and protein levels in mice with type 2 diabetes mellitus indicated that VEGFA played an important role in angiogenesis, osteogenesis and bone remodeling, and VEGFA was an important regulatory target for osteogenesis in individuals with type 2 diabetes mellitus (Wallner et al., Reference Wallner, Schira, Wagner, Schulte, Fischer, Hirsch, Richter, Abraham, Kneser and Lehnhardt2015). In addition, the absence of VEGFA promotes macrophage aggregation and angiogenesis and promotes the maturation and mineralization of osteoblasts to heal and repair the damaged bone (Hu et al., Reference Hu, Olsen, Hu and Olsen2016). The cyclic adenosine monophosphate-dependent PRKAR1A is an important regulator of osteogenic differentiation. The level of PRKAR1A increased significantly during osteoblast differentiation. After knocking down PRKAR1A in mouse and human cells, the formation of bone nodules was obstructed and osteoblast markers were significantly reduced, suggesting that PRKAR1A was associated with osteogenesis (Zhang et al., Reference Zhang, Manchanda, Wu, Wang and Kirschner2014). Changes in cartilage and bone in mice with bone tumor have shown that it was caused by incomplete differentiation of osteoblasts from tumor cells due to the reduction in PRKAR1A protein in tumor cells (Pavel et al., Reference Pavel, Nadella, Towns and Kirschner2008).
The TPO is a main growth factor of megakaryocytes and can enhance the immune factors of peripheral blood mononuclear cells and promote the resorption of osteoclasts in progenitor cells, thus causing osteoporosis or osteitis (Bethel et al., Reference Bethel, Barnes, Taylor, Cheng, Chitteti, Horowitz, Bruzzaniti, Srour and Kacena2015). In addition, RHEB can promote expression of SRY(sex determining region Y)-box transcription factor 9 (SOX9) and the synthesis of glycosaminoglycan and collagen II, which can promote adipose mesenchymal stem cells to differentiate into chondrocytes, enhance the function of RUNX family transcription factor 2 (RUNX2) to promote bone formation and increase the content of calcium and phosphate. And serine protease 7 (SP7) induced by RUNX2 is an essential transcription factor of osteoblast differentiation and chondrocyte maturation (Komori, Reference Komori2018). These previous studies reflect the reliability of our results, and these genes can be used as candidate genes for studying foot-and-limb firmness.
Our measurement method for BMD is objective and the GWAS approach for detecting candidate genomic region underlying BMD was efficient, though the small sample size was one possible potential limitation of this study to some extent. Future investigations with a larger sample size in other pig breeds and higher throughput sequencing of the candidate genomic region are necessary to confirm and extend our findings.
Conclusion
In our study, it was found that breed, parity and the interaction effect between breed and parity had very significant effect on the metatarsal BMD of sow. The GWAS identified a total of nine SNPs significantly associated with BMD trait, and CUL7, PTK7, SRF, VEGFA, RHEB, PRKAR1A and TPO were selected as the plausible candidate genes related to BMD trait by enrichment analysis and functional annotation.
Acknowledgments
This study was funded by the National Natural Science Foundation of China (31572375), the Fundamental Research Funds for the Central Universities of China (2662018JC033), the Da Bei Nong Group Promoted Project for Young Scholar of HZAU (2017DBN019) and the Fundamental Research Funds for the Central Universities (2662017JC027).
X. Liu 0000-0002-6540-9734
Declaration of interest
The authors declare to have no conflicts of interest.
Ethics statement
All animals used in this study were kept according to the Chinese legislation for pig production. The collection of samples and care of the animals used in this study followed the guidelines for experimental animals established by the Animal Care Committee and were approved by the Ethics Committee of Huazhong Agricultural University, China.
Software and data repository resources
None of the data were deposited in an official repository. Data may be available upon request by contacting the corresponding author.
Supplementary material
To view supplementary material for this article, please visit https://doi.org/10.1017/S1751731120001111


