


Transgenic crops resistant to 2,4-D or dicamba have been widely adopted in the United States and are projected to increase in hectarage (Mortensen et al. Reference Mortensen, Egan, Maxwell, Ryan and Smith2012). Despite decades of 2,4-D and dicamba use in monocot crops and noncrop areas, transgenic cultivars have allowed for wider use patterns (Mortensen et al. Reference Mortensen, Egan, Maxwell, Ryan and Smith2012). Consequently, increased off-target movement and resultant injury to susceptible soybean have been reported since the introduction of resistant cultivars (EPA 2017). Spray drift, vapor drift, sprayer contamination, and misapplication have been identified as common modes of off-target 2,4-D and dicamba movement to susceptible soybean (Behrens and Lueschen Reference Behrens and Lueschen1979; Cundiff et al. Reference Cundiff, Reynolds and Mueller2017; Egan and Mortensen Reference Egan and Mortensen2012; Grover et al. Reference Grover, Yoshida and Maybank1972; Johnson et al. Reference Johnson, Fisher, Jordan, Edminsten, Stewart and York2012; Soltani et al. Reference Soltani, Nurse and Sikkema2016; Steckel et al. Reference Steckel, Chism and Thompson2010; Strachan et al. Reference Strachan, Ferry and Cooper2013). In addition, it has been speculated that injury symptoms from 2,4-D and dicamba, which are unique and conspicuous, even after low-dose exposure, are reported more often than off-target movement of other herbicides, because they are more easily recognized (Sciumbato et al. Reference Sciumbato, Chandler, Senseman, Bovey and Smith2004).
Differential sensitivity of soybean to 2,4-D and dicamba has been well characterized. On an equivalent-rate basis, soybean is far more sensitive to dicamba than to 2,4-D; however, sensitivity often depends on growth stage at the time of exposure (Andersen et al. Reference Anderson, Clay, Wrage and Matthees2004; Egan et al. Reference Egan, Barlow and Mortensen2014; Johnson et al. Reference Johnson, Fisher, Jordan, Edminsten, Stewart and York2012; Kelley et al. Reference Kelley, Wax, Hager and Riechers2005; Robinson et al. Reference Robinson, Davis, Simpson and Johnson2013a, Reference Robinson, Simpson and Johnson2013b; Sciumbato et al. Reference Sciumbato, Chandler, Senseman, Bovey and Smith2004; Wax et al. Reference Wax, Knuth and Slife1969). Sublethal rates of 2,4-D and dicamba can cause alarming levels of soybean injury; however, soybean exposure to dicamba often results in a greater yield loss than exposure to 2,4-D (Egan et al. Reference Egan, Barlow and Mortensen2014; Johnson et al. Reference Johnson, Fisher, Jordan, Edminsten, Stewart and York2012; Kelley et al. Reference Kelley, Wax, Hager and Riechers2005; Wax et al. Reference Wax, Knuth and Slife1969). Dicamba more frequently causes soybean apical meristem death than does 2,4-D (Kelley et al. Reference Kelley, Wax, Hager and Riechers2005). Furthermore, growth stage at the time of soybean exposure to 2,4-D or dicamba and subsequent apical meristem death determines the extent of branching and subsequent reproductive growth at lower nodes (Carpenter and Board Reference Carpenter and Board1997; Kelley et al. Reference Kelley, Wax, Hager and Riechers2005; Robinson et al. Reference Robinson, Simpson and Johnson2013b; Wax et al. Reference Wax, Knuth and Slife1969). Consequently, the magnitude of soybean yield loss from 2,4-D or dicamba can be influenced by the time of exposure in relation to apical meristem death.
Before a universal soybean growth-stage description system was developed, many researchers evaluated herbicide sensitivity at growth stages characterized in relation to bloom. For example, Wax et al. (Reference Wax, Knuth and Slife1969) and Weidenhamer et al. (Reference Weidenhamer, Triplett and Sobotka1989) evaluated soybean response to dicamba and 2,4-D exposure at prebloom and midbloom. However, even after Fehr and Caviness (Reference Fehr and Caviness1977) described soybean growth stages, researchers still commonly only tested soybean response to 2,4-D or dicamba exposure at one or two vegetative or reproductive growth stages. Customarily, soybean sensitivity to 2,4-D and dicamba has been tested at an early vegetative stage (V2 to V4) and an early reproductive stage (R1 or R2) (Al-Khatib and Peterson Reference Al-Khatib and Peterson1999; Anderson et al. Reference Anderson, Clay, Wrage and Matthees2004; Auch and Arnold Reference Auch and Arnold1978; Egan et al. Reference Egan, Barlow and Mortensen2014; Griffin et al. Reference Griffin, Bauerle, Stephenson, Miller and Boudreaux2013; Robinson et al. Reference Robinson, Davis, Simpson and Johnson2013a, Reference Robinson, Simpson and Johnson2013b; Solomon and Bradley Reference Solomon and Bradley2014; Soltani et al. Reference Soltani, Nurse and Sikkema2016). Egan et al. (Reference Egan, Barlow and Mortensen2014) reported a meta-analysis on 2,4-D and dicamba effects on soybean and cotton (Gossypium hirsutum L.). Of the 30 studies reviewed from the last seven decades, they concluded that dicamba was more likely to cause soybean yield loss when exposure occurred at reproductive growth stages rather than at vegetative growth stages; however, soybean response to 2,4-D was similar across all growth stages (Egan et al. Reference Egan, Barlow and Mortensen2014). Egan et al. (Reference Egan, Barlow and Mortensen2014) also noted that soybean exposure to 2,4-D at pod-development stages was not reported in any of the studies. Furthermore, reports of soybean response to 2,4-D are conflicting; Robinson et al. (Reference Robinson, Davis, Simpson and Johnson2013a) determined yield loss was greater at R2 than at vegetative growth stages, whereas Kelley et al. (Reference Kelley, Wax, Hager and Riechers2005) reported greater yield losses at V3 than R2.
Evidence in the literature supports our hypothesis that differential sensitivity to herbicides exists within vegetative or reproductive growth stages. For example, soybean is more sensitive to acifluorfen and naptalam plus dinoseb at V3 than at V5 (Kapusta et al. Reference Kapusta, Jackson and Mason1986). Also, Robinson et al. (Reference Robinson, Davis, Simpson and Johnson2013a) reported soybean was more sensitive to 2,4-D at V5 than at V2, and Kelley et al. (Reference Kelley, Wax, Hager and Riechers2005) reported lower soybean yields after 2,4-D exposure at V3 than at V7. Likewise, Robinson et al. (Reference Robinson, Simpson and Johnson2013b) and Auch and Arnold (Reference Auch and Arnold1978) reported soybean yield was more sensitive to dicamba exposure at early vegetative rather than later vegetative growth stages. However, Kelley et al. (Reference Kelley, Wax, Hager and Riechers2005) reported soybean yield sensitivity to dicamba at V3 versus V7 was rate dependent. Ultimately, to our knowledge, no published experiment has investigated soybean response to 2,4-D or dicamba across all growth stages. Off-target movement of 2,4-D or dicamba can occur at any time; therefore, it is important to understand soybean response at all stages.
Current literature indicates that soybean growth stage plays a major role in soybean sensitivity to 2,4-D and dicamba. However, little is known about soybean response to these herbicides at every growth stage under similar environmental conditions. Accordingly, the objectives of this research were to determine sensitivity of soybean to sublethal rates of 2,4-D and dicamba across all growth stages and to predict the times of soybean maximum susceptibility to 2,4-D and dicamba.
Materials and Methods
Field experiments were conducted in 2012 and 2013 to determine the effect of soybean growth stage at exposure on sensitivity to 2,4-D or dicamba. All experiments were conducted under conventional tillage on raised beds. Plots were 3.9-m wide by 12.2-m long, using four, 97-cm spaced rows. Years, locations, coordinates, soil information, planting dates, varieties, and seeding rates are given in Table 1.
Details of experiments in which time of sublethal 2,4-D or dicamba exposure were evaluated on susceptible soybean.

a AG 4932, Asgrow, Monsanto Company, St. Louis, MO; PKP 95Y61, PKP 95731, PKP 94Y82, Pioneer Hi-Bred International, Inc., Johnston, IA; HBK 4950 Bayer CropScience, Research Triangle Park, NC.
b Asterisk indicates determinate variety.
c Seeding rates are expressed in seeds ha−1.
d Soil organic matter, 2.4%; pH, 5.9; taxonomic class, fine, smectitic, nonacid, thermic vertic epiaquepts.
e Soil organic matter, 1.6%; pH, 7.2; taxonomic class, fine, smectitic, thermic Aquic Hapluderts.
f Soil organic matter, 2.2%; pH, 6.7; taxonomic class, clayey over loamy, smectitic over mixed, superactive, nonacid, thermic vertic epiaquepts.
g Soil organic matter, 2.2%; pH, 7.1; taxonomic class, fine-silty, mixed, superactive, mesic udollic epiaqualfs.
Each herbicide (2,4-D and dicamba) was tested in separate experiments, using a randomized complete block design with four replications. All herbicide treatments were applied using a CO2-pressurized backpack sprayer equipped with a shielded hand-held spray boom calibrated to deliver a spray volume of 140 L ha−1 at 241 kPa (XR 8002 nozzles in 2012) or 207 kPa (TTI 11002 nozzles in 2013) (TeeJet Technologies, Spraying Systems Co., Wheaton, IL). Treatments were applied to the center two rows of each plot, leaving the outside two rows to act as a buffer in preventing contamination of adjacent plots. All fields were maintained weed free for the duration of experiments with broadcast applications of glyphosate and hand weeding to avoid weed competition and interference. Fertility and pest control practices at all sites were conducted as needed according to recommended local standard production practices.
A single sublethal rate of dicamba (8.8 g ae ha−1) (Clarity, BASF Corp., Research Triangle Park, NC) or 2,4-D (140 g ae ha−1) (Weedar 64, Nufarm Inc., Alsip IL) was applied weekly starting 1 wk after emergence through physiological maturity and growth stage of the majority (>50%) of the plot at application was recorded (Fehr and Caviness Reference Fehr and Caviness1977). According to previous research, herbicide rates chosen in the current experiments were similar to rates possible through particle drift of dicamba and application error or tank contamination for 2,4-D (Brown et al. Reference Brown, Carter and Stephenson2004; Carlsen et al. Reference Carlsen, Spliid and Svensmark2006; Egan et al. Reference Egan, Barlow and Mortensen2014). However, because sublethal rates of 2,4-D or dicamba were applied at a constant carrier volume in these experiments, spray coverage, droplet retention, and herbicide solution concentration would be more comparable to a tank contamination exposure rather than to spray drift or vapor exposure (Banks and Schroeder Reference Banks and Schroeder2002; Ellis et al. Reference Ellis, Griffin and Jones2002; Smith et al. Reference Smith, Ferrell, Webster and Fernandez2017). A higher rate of 2,4-D than dicamba was chosen to ensure soybean response would be high enough to observe the effect of growth stage (Egan et al. Reference Egan, Barlow and Mortensen2014; Sciumbato et al. Reference Sciumbato, Chandler, Senseman, Bovey and Smith2004; Solomon and Bradley Reference Solomon and Bradley2014). In addition to herbicide treatments, all experiments included a nontreated control (NTC) for comparison purposes.
Data Collection and Analysis
Visible evaluations of soybean injury were conducted 7, 14, 21, and 28 d after treatment (DAT) on the basis of a 0 (no symptoms) to 100 (plant death) scale similar to the one proposed by Sciumbato et al. (Reference Sciumbato, Chandler, Senseman, Bovey and Smith2004). In addition, heights of six random plants per plot were measured immediately before harvest. At physiological maturity, the center two rows of each plot were machine harvested using a small plot combine and yields were adjusted to 13% moisture. Soybean terminal height and grain yield data were then converted to percentage of the NTC by dividing data by the NTC of the respective block and multiplying by 100.
Because of the differential duration of soybean growth stages, some treatments occurred multiple times per block, because treatments were applied weekly, which resulted in an unbalanced data set. Therefore, data were first subjected to mixed-model ANOVA, and the LSMEANS statement (SAS, version 9.4; SAS Institute, Cary, NC) at α = 0.05 was used to detect treatment means different from the NTC, using the PROC GLIMMIX procedure in SAS. Because of the different nozzles used between years, the main effect and associated interactions of site-year were first considered fixed effects in the ANVOA model to test for significance. However, no interactions between site-year and growth stage were detected (P ≥ 0.13). Consequently, site-year and block (nested within site-year) were considered random effects, and treatment (growth stage at application) was considered a fixed effect in the ANOVA model to allow for inferences across multiple environmental conditions (Blouin et al Reference Blouin, Webster and Bond2011; Carmer et al. Reference Carmer, Nyquist and Walker1989; Yang Reference Yang2010). Furthermore, all data were arcsine–square root transformed and subjected to ANOVA. However, results from transformed data were not different from original (nontransformed) data; therefore, original data were used in analyses.
To further characterize the effect of exposure time, accumulated growing degree days (GDD) from the planting date were calculated for each treatment at each site-year to provide a continuous numeric explanatory variable for regression analysis. Air temperature data were collected by either on-site weather stations or by nearby university-sponsored weather data collectors (Mississippi State University Extension 2018). GDDs were then calculated using the following formula:
 $${\rm{GDD }} = {\rm{ }}\left[ {\sum \left( {{{\rm{T}}_{{\rm{max}}}} + {\rm{ }}{{\rm{T}}_{{\rm{min}}}}} \right)/{\rm{2}}} \right]{\rm{ }} - {\rm{ }}{{\rm{T}}_{\rm{b}}}$$
where Tmax is the maximum daily air temperature, Tmin is the minimum daily air temperature, and Tb is the base threshold temperature, which was set to 10 C, similar to Sbatella et al. (Reference Sbatella, Kniss, Omondi and Wilson2016). Data were then fitted over GDD using several parametric regression models; however, the models evaluated did not adequately describe trends in the data. Therefore, data were regressed using nonparametric local regression fitted with a 95% confidence band (CB), using the loess package in R (version 3.5.1, RStudio Inc, Boston, MA). Points of interest in the local regression and their respective 95% confidence intervals (CIs) were predicted using the stats and base packages in R.
Results and Discussion
Soybean Response to 2,4-D
At 7 DAT, soybean treated with 2,4-D at R5, R6, R6.5, or R7 did not have injury levels higher than the NTC (Supplementary Table 1). However, regression analysis revealed that soybean injury 7 DAT increased with delayed exposure timing from planting until 413 GDD, at which time soybean was most sensitive to 2,4-D until exposure timing reached 1,262 GDD (Figure 1). This period of maximum susceptibility approximately correlated to between V1 and R2 growth stages. After 1,262 GDD, soybean injury decreased as exposure time was delayed until 2,965 GDD (approximately R7 growth stage), when the 95% CB reached 0% injury. By 14 DAT, 2,4-D treatment at V1, V5, or R5.5 resulted in soybean injury levels similar to the NTC (Supplementary Table 1). Soybean injury 14 DAT was highest when exposure occurred from 624 to 1,291 GDD, which was approximately between the V3 and R2 growth stages. Kelley et al. (Reference Kelley, Wax, Hager and Riechers2005) reported approximately 32% higher soybean injury 14 DAT from 2,4-D at 180 g ae ha−1 than we measured in the present experiment when plants were treated at V3; however, injury from treatment at R2 reported by Kelley et al. (Reference Kelley, Wax, Hager and Riechers2005) was similar to that measured in the present experiment. Regression of soybean injury 14 DAT displayed a similar trend to the 7 DAT data for 2,4-D exposure (Figure 1).
Nonparametric local regression of (A) soybean injury 7, 14, 21, and 28 d after treatment (DAT), (B) soybean terminal height, and (C) soybean grain yield after treatment with 2,4-D at 140 g ae ha−1, as affected by time of exposure expressed in accumulated growing degree days (base temperature, 10 C) from planting across 6 site-years in Mississippi and Arkansas in 2012 and 2013. Grey bands represent 95% confidence. Horizontal red lines signify maximum injury, height, or yield of the fitted line. Horizontal green lines signify minimum height or yield of the fitted line. Vertical, dashed blue lines signify points where the 95% confidence band of the fitted line departs from minimum of the fitted line. NTC, nontreated control.
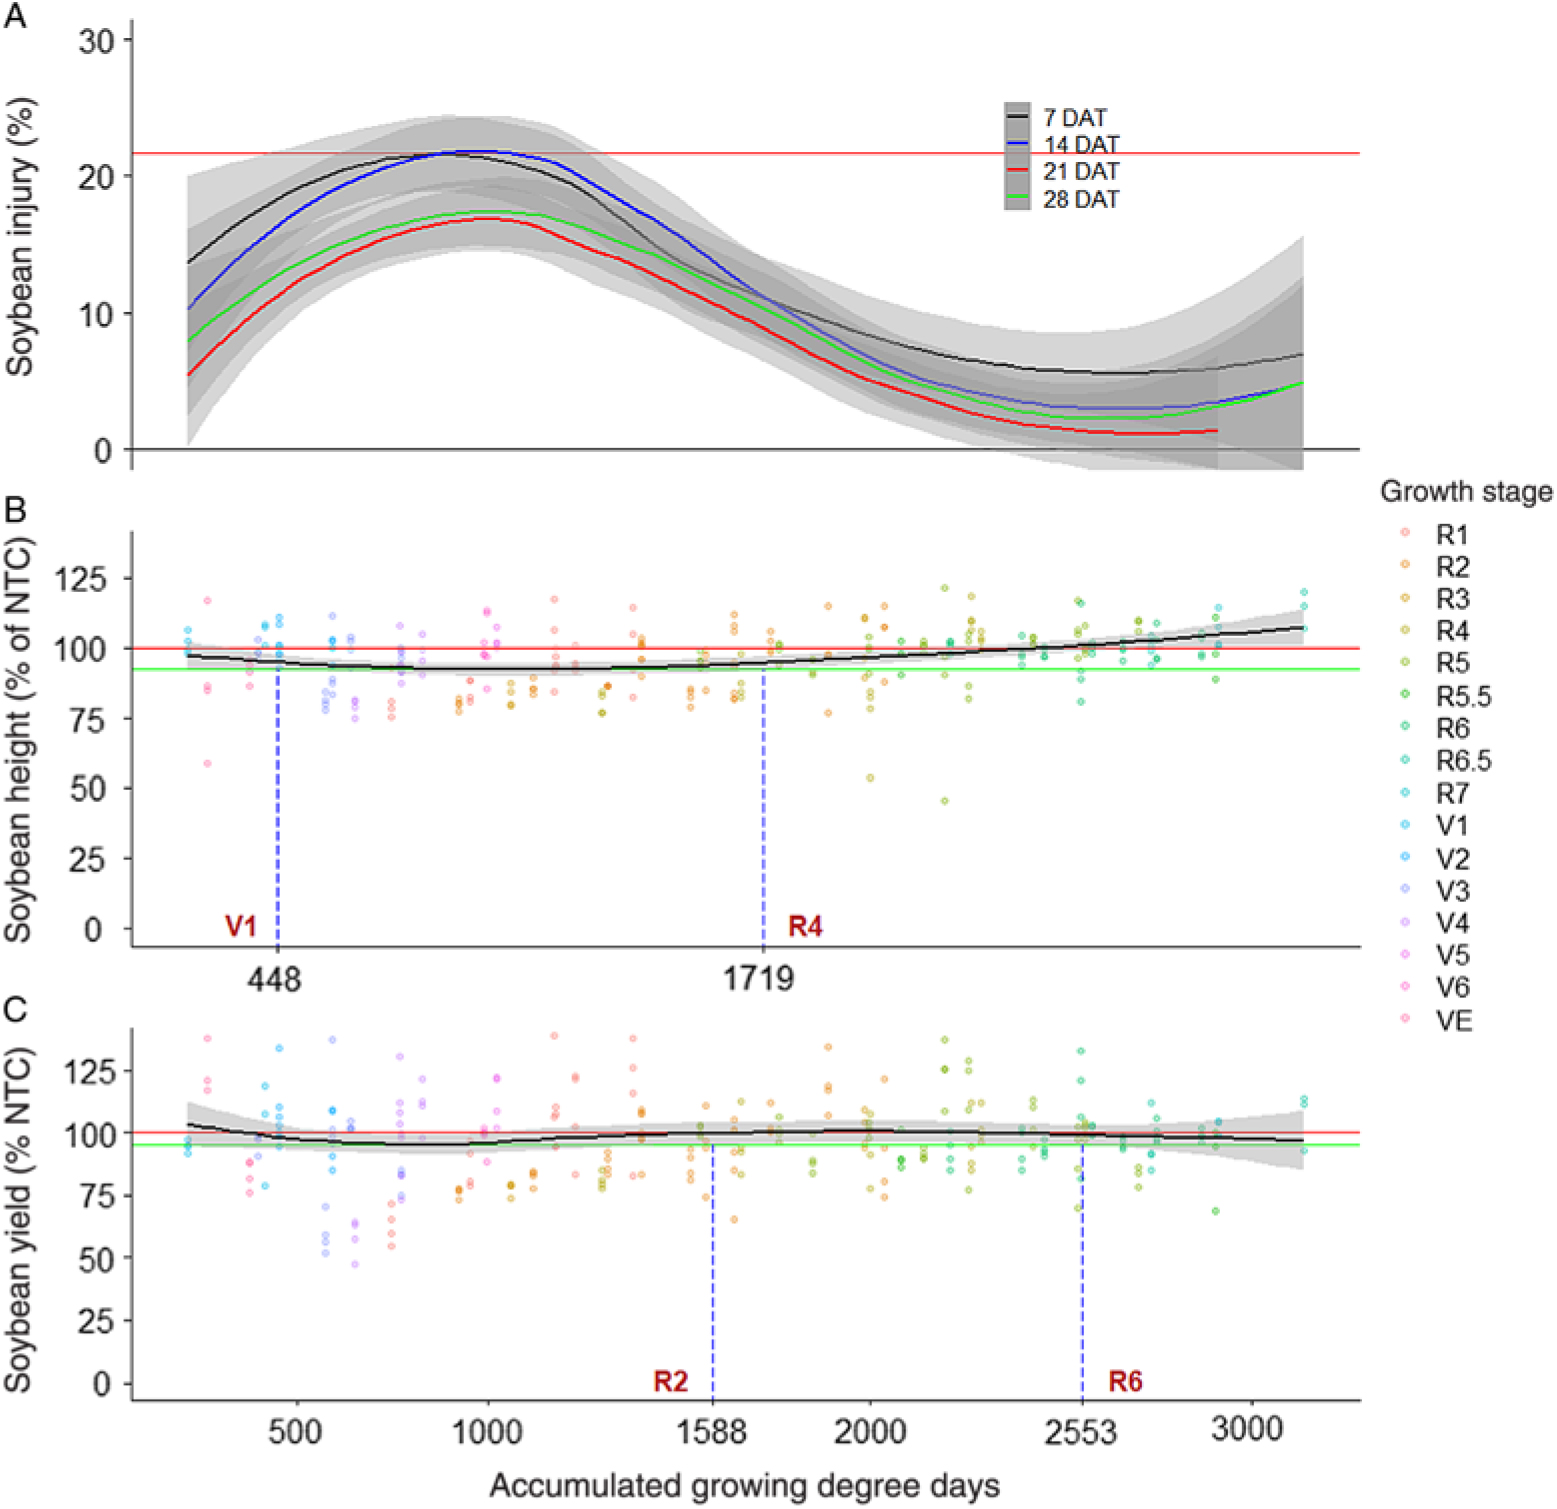
Soybean treated with 2,4-D at VC, V2, V4, V5, V6, R1, R2, R3, or R4 resulted in 13% to 18% injury 21 DAT (Supplementary Table 1). Likewise, regression analysis indicated a period of maximum susceptibility to 2,4-D at between 615 and 1,391 GDD, which was approximately between V3 and R2 growth stages (Figure 1). In addition, in terms of injury 21 DAT, soybean was least susceptible to 2,4-D exposure after 2,478 GDD or approximately the R5 growth stage. By 28 DAT, soybean injury from 2,4-D did not differ from the injury to NTC when treated at V1, R5, or R5.5 (Supplementary Table 1). However, treatment at R6, R6.5, or R7 was not evaluated, because plants had either senesced or were harvested by 28 DAT. Interestingly, Robinson et al. (Reference Robinson, Davis, Simpson and Johnson2013a) used nonlinear regression to predict the effective dose needed to cause 20% soybean injury 28 DAT from 2,4-D. Their model calculated an effective dose of 145 g ae ha−1 for soybean treated at V5. In the present experiment, treatment with 2,4-D at 140 g ae ha−1 at V5 resulted in 20% injury, indicating that these data were quite similar (Supplementary Table 1). In the present experiment, regression of soybean injury 28 DAT indicated a period of maximum susceptibility between 669 and 1,290 GDD (approximately V3 to R2) and that soybean injury was minimal when treated at 2,322 GDD (approximately R5) or later (Figure 1). Despite differences in maximum values, all regressions from soybean injury from 2,4-D followed the same trend of increasing injury from planting until the maximum (17% to 22% injury) and then decreasing in injury until late reproductive growth stages (R5 to R7), when injury was similar to 0% (Figure 1). Considering all evaluation intervals, soybean was most sensitive to 2,4-D between V1 and R2 growth stages in terms of injury.
The magnitude of soybean height or yield reductions from 2,4-D was much lower than earlier evaluated injury (Figure 1). However, the period of maximum susceptibility to 2,4-D was much longer for soybean height response compared with injury, ranging from 448 to 1,719 GDD or from V1 to R4 growth stages, despite a minimum value of 92% of the NTC (Figure 1). Soybean yield affected by 2,4-D was relatively static across exposure times (Figure 1). Because of the low response of soybean to 2,4-D, the 95% CB of the regression line overlapped both minimum yield and 100% of the NTC lines for most exposure timings. As noted in Figure 1, soybean yield response was similar to the minimum value when exposure occurred from planting to R2 and from R6 to harvest. However, if exposure occurred between 624 and 1,001 GDD (approximately V3 to V5), soybean yield was lower than 100% of the NTC. Research conducted in the 1950s and 1960s indicated that in terms of yield, soybean was more sensitive to 2,4-D at reproductive growth stages than at vegetative growth stages (Slife Reference Slife1956; Wax et al. Reference Wax, Knuth and Slife1969). However, our results do not agree. This difference in results may have been due to the change in soybean cultivars over the past 50 years, sublethal rate used, or environmental conditions during experiments (Griffin et al. Reference Griffin, Bauerle, Stephenson, Miller and Boudreaux2013; Kahlon et al. Reference Kahlon, Board and Kang2011).
Robinson et al. (Reference Robinson, Davis, Simpson and Johnson2013a) reported that soybean injury from 2,4-D was highly correlated with yield, and they used regression analysis to predict yield based on injury. However, our data do not support using injury or plant height responses to 2,4-D as a direct predictor for yield. For example, soybean injury from 2,4-D exposure at most vegetative growth stages was consistently higher than the NTC across all evaluations (Supplementary Table 1). However, all vegetative growth-stage exposure timings except V3 resulted in soybean yield similar to the NTC. A possible cause for the lack of yield response observed in the present experiment was that only a single sublethal rate was used, whereas Robinson et al. (Reference Robinson, Davis, Simpson and Johnson2013a) developed regression models based on 10 rates at three growth stages. This speaks to the effect of herbicide rate on plant response. For example, Kelley et al. (Reference Kelley, Wax, Hager and Riechers2005) found no soybean yield loss from 2,4-D treatment at V3 at 56 g ae ha−1; however, a yield loss was observed when the rate was increased to 180 g ae ha−1. Conversely, 2,4-D applied at 56 g ae ha−1 has been shown to reduce soybean plant height and yield when applied at V3, V7, or R2 and V7 or R2, respectively (Kelley et al. Reference Kelley, Wax, Hager and Riechers2005). However, data from Kelley et al. (Reference Kelley, Wax, Hager and Riechers2005) were generated in Illinois, which likely experienced much different environmental conditions compared with our experiment, which was conducted in the midsouthern United States. Consequently, environmental conditions such as lower soil-moisture content could have promoted higher sensitivity to 2,4-D for Kelley et al. (Reference Kelley, Wax, Hager and Riechers2005) (Anderson et al. Reference Anderson, Clay, Wrage and Matthees2004; Auch and Arnold Reference Auch and Arnold1978; Griffin et al. Reference Griffin, Bauerle, Stephenson, Miller and Boudreaux2013; Kelley et al. Reference Kelley, Wax, Hager and Riechers2005; Weidenhamer et al. Reference Weidenhamer, Triplett and Sobotka1989). It is also important to note that 2,4-D exposure at V3 was the only treatment for which yield loss was observed, and many experiments have used V3 as the representative stage for all vegetative growth stages. This could be misleading, because 2,4-D exposure at V3 is not equivalent to other vegetative stages.
The number of observations was highest for the R2 growth stage (n = 68), suggesting that this growth stage was the longest across experimental sites. This is particularly concerning, because soybean exposure to 2,4-D at R2 was within the period of maximum susceptibility for all injury evaluation timings (Figure 1). However, soybean yield was similar to that of the NTC when 2,4-D exposure occurred at R2 (Figure 1; Supplementary Table 1). Consequently, soybean growers may be more likely to observe alarming injury levels from 2,4-D exposure at R2 despite minimal risk for yield loss at the rate tested.
Soybean Response to Dicamba
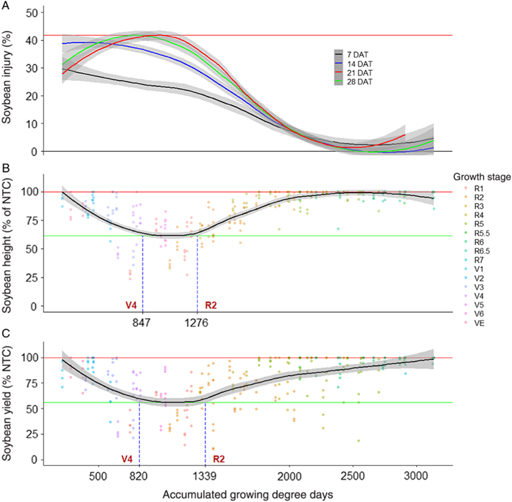
Regression of soybean injury 7 DAT resulted in a different trend than in the 2,4-D experiments, where injury started at the maximum and continually decreased (Figure 2). Consequently, the period of maximum susceptibility for soybean injury 7 DAT after dicamba treatment was only between 0 and 452 GDD, or approximately between emergence and V2. Likewise, soybean was least susceptible to dicamba injury 7 DAT when exposure occurred after 2,694 GDD or the R6 growth stage. Similarly, soybean injury 14 DAT also decreased immediately from the maximum value (Figure 2). Consequently, the period of maximum susceptibility was between 0 and 733 GDD, or from planting to V4. However, soybean was not susceptible to dicamba exposure after 2,394 GDD or the R5 growth stage.
Nonparametric local regression of (A) soybean injury 7, 14, 21, and 28 d after treatment (DAT), (B) soybean terminal height, and (C) soybean grain yield after treatment with dicamba at 8.8 g ae ha−1, as affected by time of exposure expressed in accumulated growing degree days (base temperature, 10 C) from planting across 6 site-years in Mississippi and Arkansas in 2012 and 2013. Grey bands represent 95% confidence. Horizontal red lines signify maximum injury, height, or yield of the fitted line. Horizontal green lines signify minimum height or yield of the fitted line. Vertical, dashed blue lines signify points where the 95% confidence band of the fitted line departs from minimum of the fitted line. NTC, nontreated control.
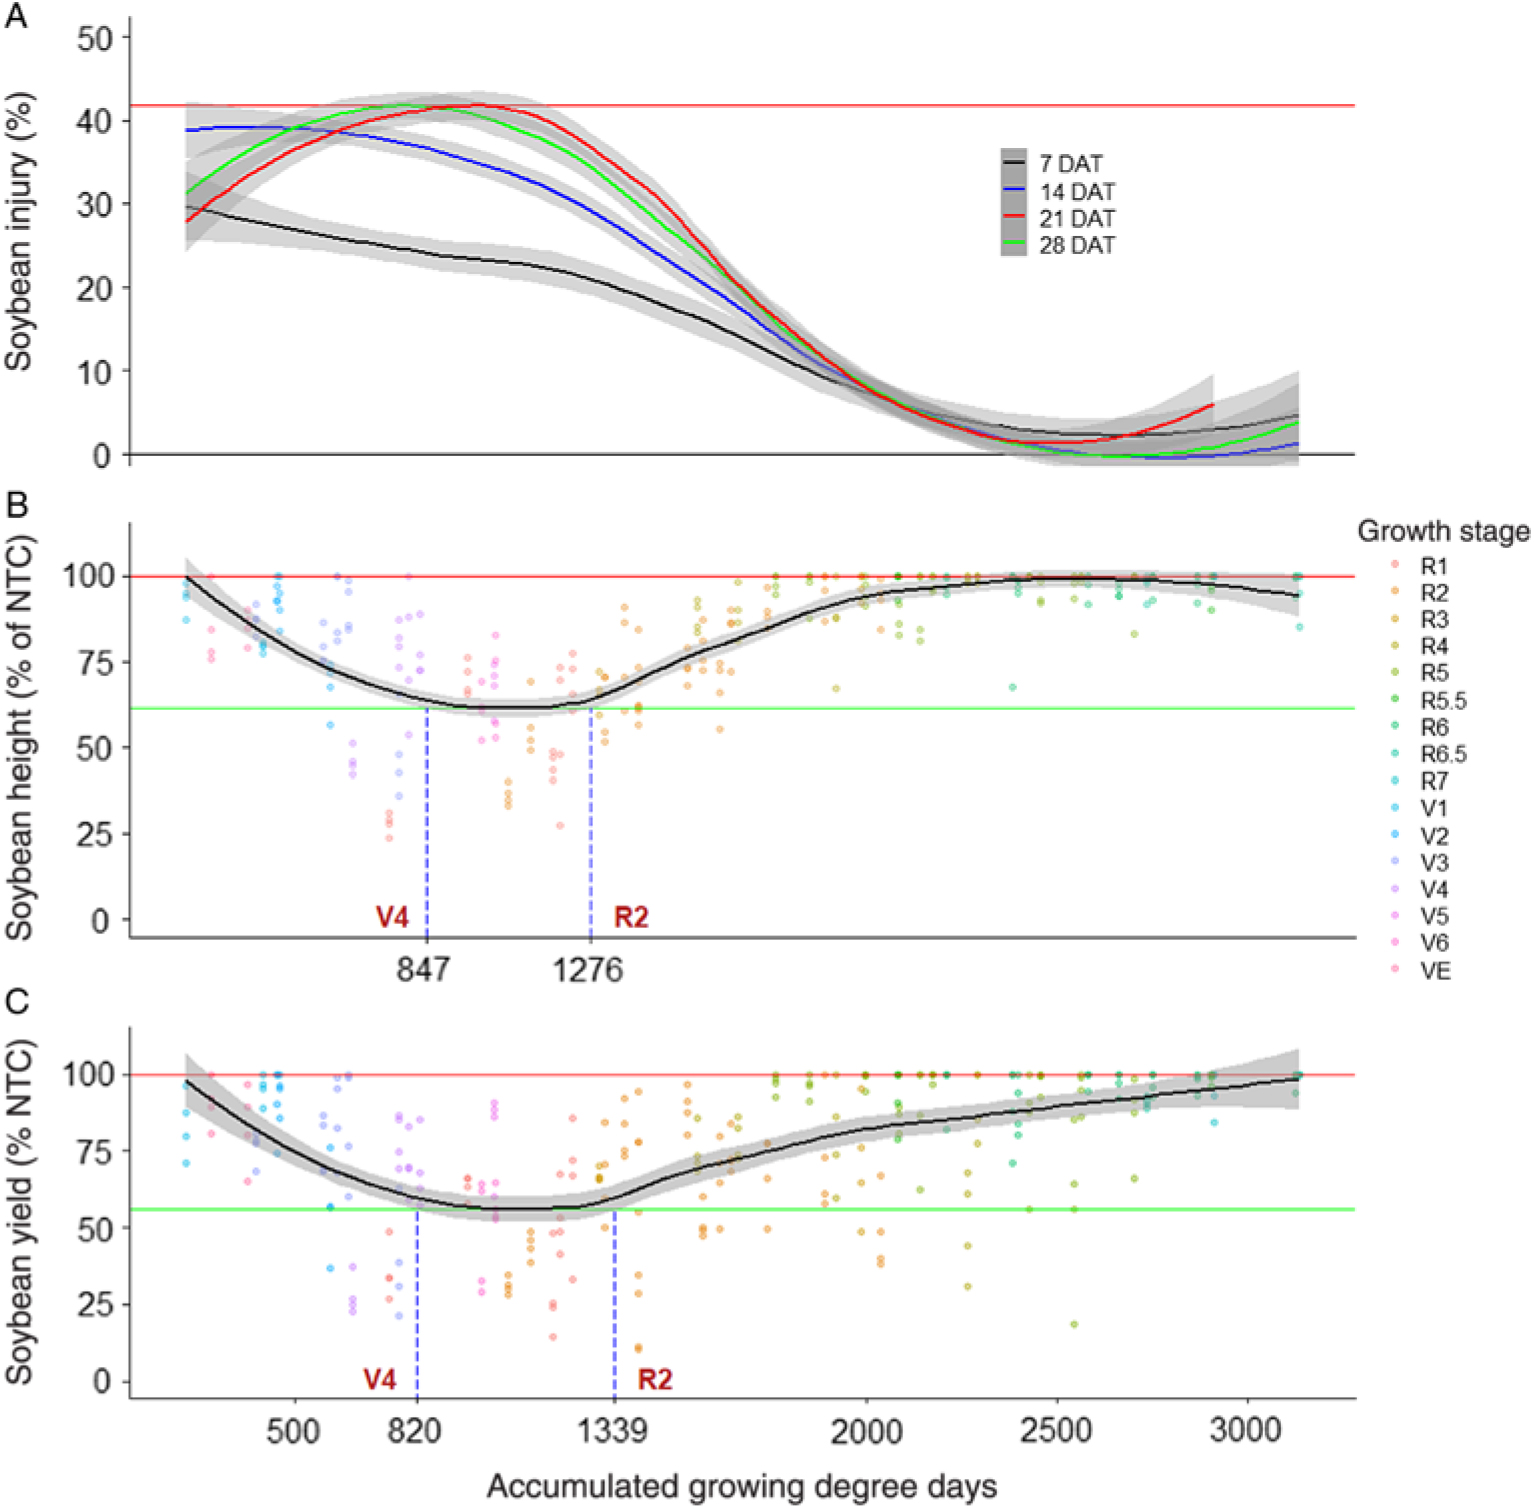
By 21 DAT, the period of maximum susceptibility to dicamba shifted to between 556 and 1,031 GDD, or from V2 to R1, including exposure times that were not within maximum susceptibility range during the 7 and 14 DAT evaluations (Figure 2). Likewise, soybean was least susceptible to dicamba exposure after 2,346 GDD or around the R5 growth stage. Minimal soybean injury 28 DAT was observed from dicamba treatment at R5 or R6; however, the R6.5 and R7 treatments were not evaluated 28 DAT, because of senescence or harvest. On the basis of soybean injury 28 DAT, soybean was most susceptible to dicamba between 703 and 1,162 GDD, or from V3 to R2, and least susceptible between 2,360 and 2,692 GDD, or from R5 to R6.5 (Figure 2). Unlike other evaluation intervals, soybean injury 28 DAT increased from 0% after 2,692 GDD. However, this increase was likely due to missing data at these stages, due to plots being harvested before the evaluation interval.
Soybean plant height was not affected by dicamba when treated at R4, R5, R5.5, R6, R6.5, or R7 (Supplementary Table 2). However, soybean height was most affected when dicamba exposure occurred between 847 and 1,276 GDD, or between V4 and R2 (Figure 2). Exposure during this period was similar to the minimum value of the fitted regression line, which was 61% of the NTC. However, dicamba exposure after 2,244 GDD, or R4, resulted in plant heights similar to those of the NTC. Griffin et al. (Reference Griffin, Bauerle, Stephenson, Miller and Boudreaux2013) reported soybean plant height was more affected by dicamba applied at R1 than at V3/V4, when the dicamba rate was at least 17.5 g ae ha−1.
No yield loss was observed from dicamba treatment at V1, R5, R5.5, R6, R6.5, or R7 (Supplementary Table 2). However, soybean yield was most affected when dicamba exposure occurred between 820 and 1,339 GDD, or from V4 to R2 (Figure 2). Likewise, soybean yield was similar to that of the NTC when exposed to dicamba from emergence to 272 GDD (<VC) and from 2,858 GDD (R6.5) to harvest. Unlike the 2,4-D experiment, yield losses observed from dicamba where highly reflective of injury and plant height observations, as can be confirmed from the regression analysis. For example, the period of maximum susceptibility of soybean to dicamba in terms of plant height was from 847 GDD (V4) to 1,276 GDD (R2) (Figure 2). Likewise, in terms of yield, the period of maximum susceptibility of soybean to dicamba was from 820 GDD (V4) to 1,339 GDD (R2) (Figure 2). Similarly, Griffin et al. (Reference Griffin, Bauerle, Stephenson, Miller and Boudreaux2013) found that soybean injury from dicamba treatment at V3/V4 resulted in proportionally similar yield reductions. Soybean yield loss from dicamba has been reported to be much greater when treated at “early/mid-bloom” than V2 to V4 (Auch and Arnold Reference Auch and Arnold1978; Wax et al. Reference Wax, Knuth and Slife1969). Likewise, from their meta-analysis, Egan et al. (Reference Egan, Barlow and Mortensen2014) concluded that soybean yield was more affected by dicamba exposure at flowering stages than at vegetative or pod development. This commonly observed differential yield response of soybean to dicamba at early reproductive growth stages compared with early vegetative growth stages is likely due to damaged reproductive structures and apical meristem death that cannot be compensated for by branching, because injury occurs after vegetative growth rate has slowed (Carpenter and Board Reference Carpenter and Board1997; Griffin et al. Reference Griffin, Bauerle, Stephenson, Miller and Boudreaux2013; Wax et al Reference Wax, Knuth and Slife1969). Conversely, Weidenhamer et al. (Reference Weidenhamer, Triplett and Sobotka1989) found soybean yield loss was greater when exposed to dicamba at a prebloom vegetative growth stage than at a midbloom reproductive growth stage. Whereas Kelley et al. (Reference Kelley, Wax, Hager and Riechers2005) found no difference in yield after treatment with dicamba at 5.6 g ae ha−1.
Similar to the 2,4-D experiment, the duration of R2 growth stage was longest in the dicamba experiment (n = 68 observations). Because of the duration of this growth stage and the significant yield loss observed from dicamba exposure at R2, caution should be exercised by dicamba applicators during this time. It is also important to note that previous literature has indicated soybean response to dicamba and 2,4-D can be highly inconsistent. Potential causes for variability in soybean response to herbicides identified in the literature include environmental conditions, herbicide rate, carrier volume, and soybean growth strategy (indeterminate or determinate) (Al-Khatib and Peterson Reference Al-Khatib and Peterson1999; Anderson et al. Reference Anderson, Clay, Wrage and Matthees2004; Auch and Arnold Reference Auch and Arnold1978; Banks and Schroeder Reference Banks and Schroeder2002; Ellis et al. Reference Ellis, Griffin and Jones2002; Kelley et al. Reference Kelley, Wax, Hager and Riechers2005; Smith et al. Reference Smith, Ferrell, Webster and Fernandez2017; Wax et al. Reference Wax, Knuth and Slife1969; Weidenhamer et al. Reference Weidenhamer, Triplett and Sobotka1989).
In summary, these data indicate that soybean response to 2,4-D and dicamba cannot be generalized to vegetative or reproductive growth stages, because specific growth stages must be accounted for. In considering the levels of yield loss observed and the rates tested, 2,4-D exposure to susceptible soybean likely poses less risk than dicamba; however, alarming levels of injury still can be observed from 2,4-D exposure, and higher rates may cause a wider range of susceptibility to yield loss. Dicamba applications near susceptible soybean between the stages of V4 and R2 should be avoided because this time span can be considered the time of maximum susceptibility for yield loss. Furthermore, great care in thoroughly cleaning spray equipment contaminated with dicamba should be taken if the same equipment must be used for any type of application to soybean within this stage range.
Supplementary material
To view supplementary material for this article, please visit https://doi.org/10.1017/wet.2019.39
Acknowledgements
The authors would like to acknowledge the Mississippi Soybean Promotion Board for partial funding of this research. No conflicts of interest have been declared.


 Open access