





1 Introduction
One of the main directions of current research and development in fiber optics is the technological transition from conventional singlemode fibers with one singlemode core to multicore fibers (MCFs) with multiple singlemode cores in a common cladding[ Reference Saitoh and Matsuo 1 ]. The implementation of space-division multiplexing in MCFs is emerging as a key solution in telecommunications to overcome the capacity limits of singlemode fibers[ Reference Richardson, Fini and Nelson 2 , Reference Puttnam, Rademacher and Luis 3 ]. At the same time, MCFs are finding increasing use in sensing applications due to their ability to measure three-dimensional fiber deformations such as bending, curvature and arbitrary shape[ Reference Floris, Adam, Calderon and Sales 4 , Reference Xu, Ma, Yu, Cheng and He 5 ]. These capabilities are greatly enhanced with the implementation in MCFs of multi-point inscription of fiber Bragg gratings (FBGs) by femtosecond laser pulses and interferometric interrogation techniques[ Reference Wolf, Dostovalov, Bronnikov, Skvortsov, Wabnitz and Babin 6 – Reference Yao, Zhao and Tang 8 ]. Besides, MCFs are prospective candidates for image acquisition and transmission[ Reference Feng, Chen, Zhu, Xiong, Chen, Lu and Xu 9 ].
MCFs are also treated as a prospective medium for high-power fiber lasers and amplifiers due to multiplication of the effective mode area that allows one to reach much higher power at the same intensity, which is limited by the development of nonlinear effects such as modulation instability, transverse mode instability and stimulated Raman scattering observed in singlemode fiber lasers[ Reference Jauregui, Limpert and Tünnermann 10 ]. The generated beams of MCF lasers can be efficiently combined into one high-quality output beam using coherent beam combining techniques (see, e.g., Ref. [Reference Chang, Chang, Xi, Hou, Su, Ma, Wu, Li, Jiang, Ma and Zhou11] and citations therein), either with the use of external optical elements or by means of internal optical coupling arising from the evanescent-field overlap of closely spaced cores. Although optical coupling resulting in supermode formation may be applied for efficient amplification of short pulses that are resistant to modulation instability and are able to reach total power greatly exceeding the self-focusing threshold of singlemode fibers[ Reference Balakin, Skobelev, Andrianov, Anashkina and Litvak 12 ], major progress in power scaling of pulsed fiber laser systems is expected for MCFs with isolated cores and external coherent beam combining[ Reference Klenke, Jauregui, Steinkopff, Aleshire and Limpert 13 ].
The situation is quite different for continuous-wave (CW) MCF lasers, in which optical coupling is usually important when large-mode-area (LMA) cores are used for power scaling in a compact and robust all-fiber configuration[ Reference Ji, Raghuraman, Huang, Zang, Ho, Zhou, Benudiz, Ami, Ishaaya and Yooet 14 ]. Additional improvements have been achieved with the implementation of FBGs in MCFs. The femtosecond (fs) laser inscription through a phase mask allows one to simultaneously fabricate identical highly reflective (HR) FBGs in all six coupled cores, forming a cavity with the normally cleaved end of an active Yb-doped LMA MCF, which enables 52 W output power at the linewidth of 0.2 nm[ Reference Alon, Halstuch, Sidharthan, Yoo and Ishaaya 15 ]. A mask-free point-by-point (PbP) fs-inscription technology offers FBG writing in individual MCF cores with the same or different Bragg wavelengths at arbitrary positions along the MCF axis that offers new capabilities of MCF-based sensors and lasers[ Reference Wolf, Dostovalov, Bronnikov, Skvortsov, Wabnitz and Babin 6 ]. The PbP technology has been applied for a fs-inscription of HR FBGs in each core of a double-clad four-core Yb-doped fiber laser, revealing the effect of output power spatial localization in one of the cores of the active MCF manifesting itself in their strong coupling[ Reference Wolf, Skvortsov, Lobach, Dostovalov and Babin 16 ]. Another effect of core coupling in CW MCF lasers concerns its spectral features. The PbP fs-inscription of individual HR FBGs with slightly shifted FBG reflection spectra in seven cores of Yb-doped MCF has shown strong dependence of the laser spectrum on the core coupling strength[ Reference Kuznetsov, Wolf, Egorova, Semjonov, Dostovalov, Podivilov and Babin 17 ]. The laser generates seven shifted lines with the central wavelengths corresponding to individual FBGs in uncoupled cores, whereas the individual core lines collapse into one common narrow line at the strong coupling. The effect was qualitatively explained on the basis of an analytical model that can be developed for the simplest case of a two-core system. The model supposes that the laser with coupled cores generates a coherent superposition of two supermodes at a common wavelength corresponding to the maximum of the geometric mean of the individual wavelength-shifted FBG reflection spectra. At the same time, analytical modeling of the generation spectrum is rather difficult in the case of seven cores, so one needs a comprehensive numerical simulation in this case.
Here we develop an adequate model and perform numerical simulations of the generation spectra of a seven-core fiber laser with wavelength-shifted FBGs in the cases of uncoupled and strongly coupled cores with realistic parameters of the MCF laser system, such as spontaneous noise, random variation of the refractive index and an FBG reflection phase in different cores. The obtained simulation results are compared with the experimental spectra of two types of seven-core fiber laser in relation to the individual FBG characteristics, as well as their dependence on output power. The comparison allows one to identify key physical mechanisms leading to the collapse of the total spectrum and to describe quantitatively the generation linewidth and its power dependence in the studied seven-core fiber laser. It has been revealed that the physical, mechanic and quantitative features of linewidth broadening defined by spatial hole burning (SHB) and Kerr effects are sufficiently modified in comparison with single-core lasers. The performed analysis enables an evaluation of the laser characteristics with an increased number of cores and increased coupling strength and allows one to predict an extreme linewidth narrowing in high-power MCF lasers.
2 Experimental scheme and specifics of a seven-core fiber laser
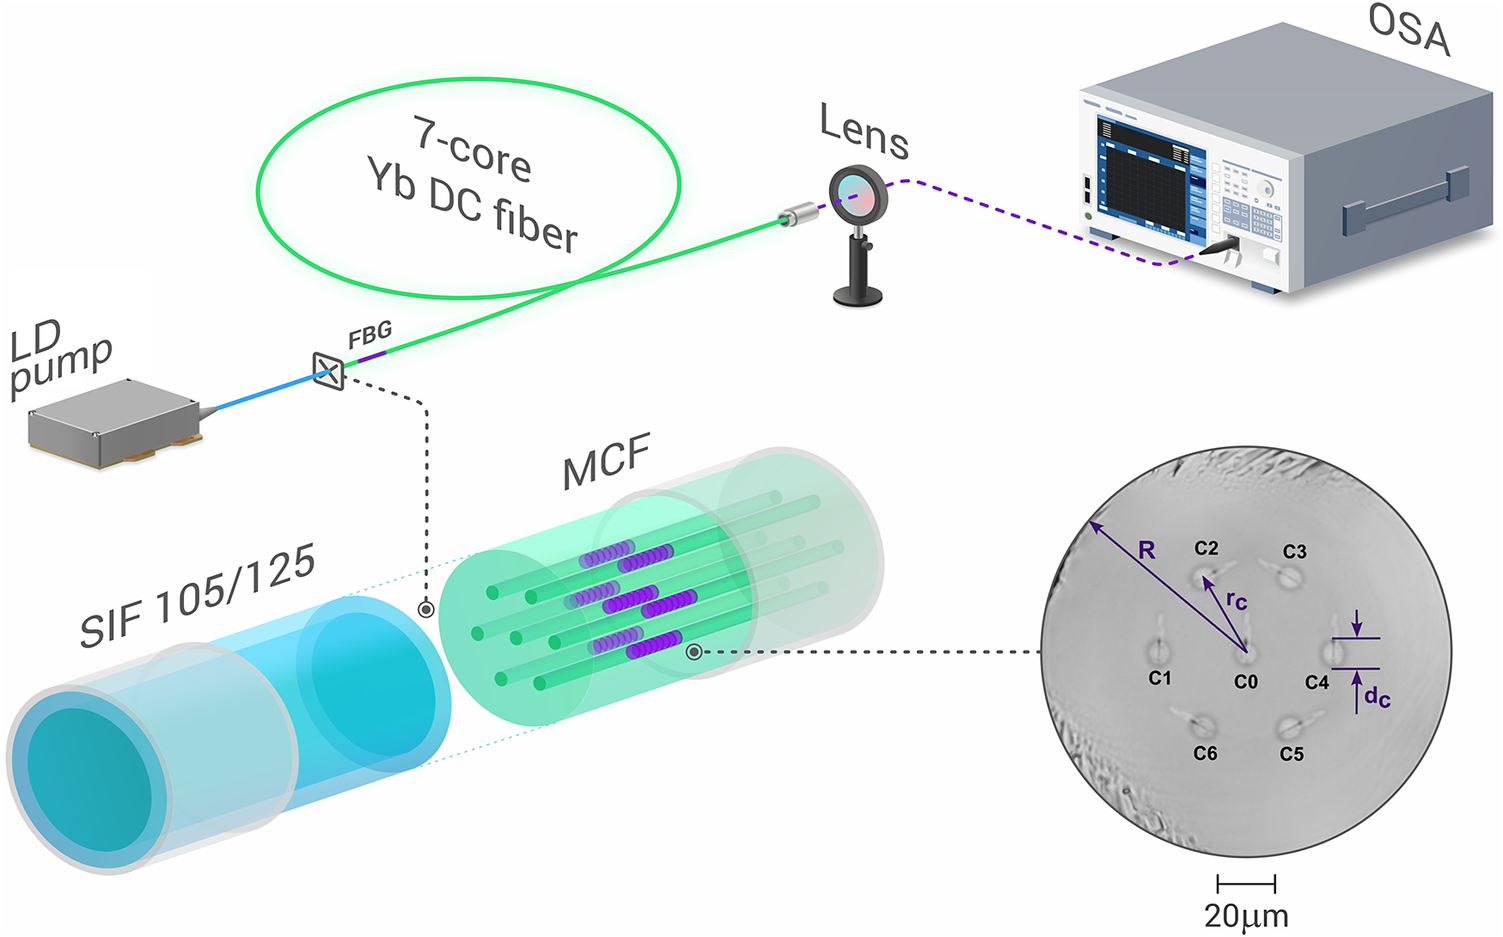
The basic scheme of a seven-core fiber laser with an FBG cavity is shown in Figure 1, together with the measurement setup[
Reference Kuznetsov, Wolf, Egorova, Semjonov, Dostovalov, Podivilov and Babin
17
]. The studied laser is cladding pumped by a high-power laser diode (LD) pigtailed by a multimode fiber (105/125 μm core/cladding diameters, numerical aperture (NA) = 0.22), which is spliced to an active MCF. The MCF has a silica cladding with diameter
$2R=136\pm 1\kern0.22em \mu$
 m, in which seven Yb-doped cores of diameter d are arranged in hexagonal order (C0, central; C1–C6, peripheral) with inter-core distance
${r}_{\mathrm{c}}$
m, in which seven Yb-doped cores of diameter d are arranged in hexagonal order (C0, central; C1–C6, peripheral) with inter-core distance
${r}_{\mathrm{c}}$
 . Two types of the seven-core Yb-doped fiber have been drawn from the same preform:
$d=6.5\kern0.22em \mu$
. Two types of the seven-core Yb-doped fiber have been drawn from the same preform:
$d=6.5\kern0.22em \mu$
 m,
${r}_{\mathrm{c}}=28.3\kern0.22em \mu$
m,
${r}_{\mathrm{c}}=28.3\kern0.22em \mu$
 m (MCF1) and
$d=4\kern0.22em \mu$
m (MCF1) and
$d=4\kern0.22em \mu$
 m,
${r}_{\mathrm{c}}=17.2\kern0.22em \mu$
m,
${r}_{\mathrm{c}}=17.2\kern0.22em \mu$
 m (MCF2) with weak and strong optical coupling between the cores, respectively.
Experimental scheme of a seven-core Yb-doped double-clad (DC) MCF laser with an HR FBG array fs-inscribed in all seven cores (see the microscopic image on the right-hand bottom panel) pumped by a multimode LD through multimode step-index fiber (SIF) coupled to the MCF cladding (their splice point is zoomed in on the left-hand bottom panel). The lens collimates output beam into the measurement setup (optical spectrum analyzer (OSA) or power/
${{M}}^2$
 meters).

Figure 1 Long description
Starting at the left, a box labeled L D pump connects via a blue line to a labeled F B G, then to a green-outlined cylinder marked S I F 105 slash 125. This cylinder is spliced to a green transparent cylinder labeled M C F, which contains seven parallel purple lines representing the Yb-doped cores. The M C F is labeled 7-core Yb D C fiber. The optical path continues rightward through a lens, shown as a circular element on a stand, and terminates at a rectangular device labeled O S A. Two insets are present: the lower left zooms in on the splice point between S I F and M C F, showing the interface; the lower right shows a microscopic cross-section of the M C F with seven labeled cores (C0 at center, C1 to C6 arranged hexagonally), and arrows indicating R, r sub c, and d sub c, with a 20 micrometer scale bar. The schematic illustrates the experimental setup for pumping and measuring the output of the seven-core fiber laser.
The linear laser cavity in the MCF was formed by the normally cleaved output end of the fiber, providing a Fresnel reflection with coefficient
${R}_{\mathrm{out}}\sim 4\%$
 and an array of HR (
$R>90\%$
and an array of HR (
$R>90\%$
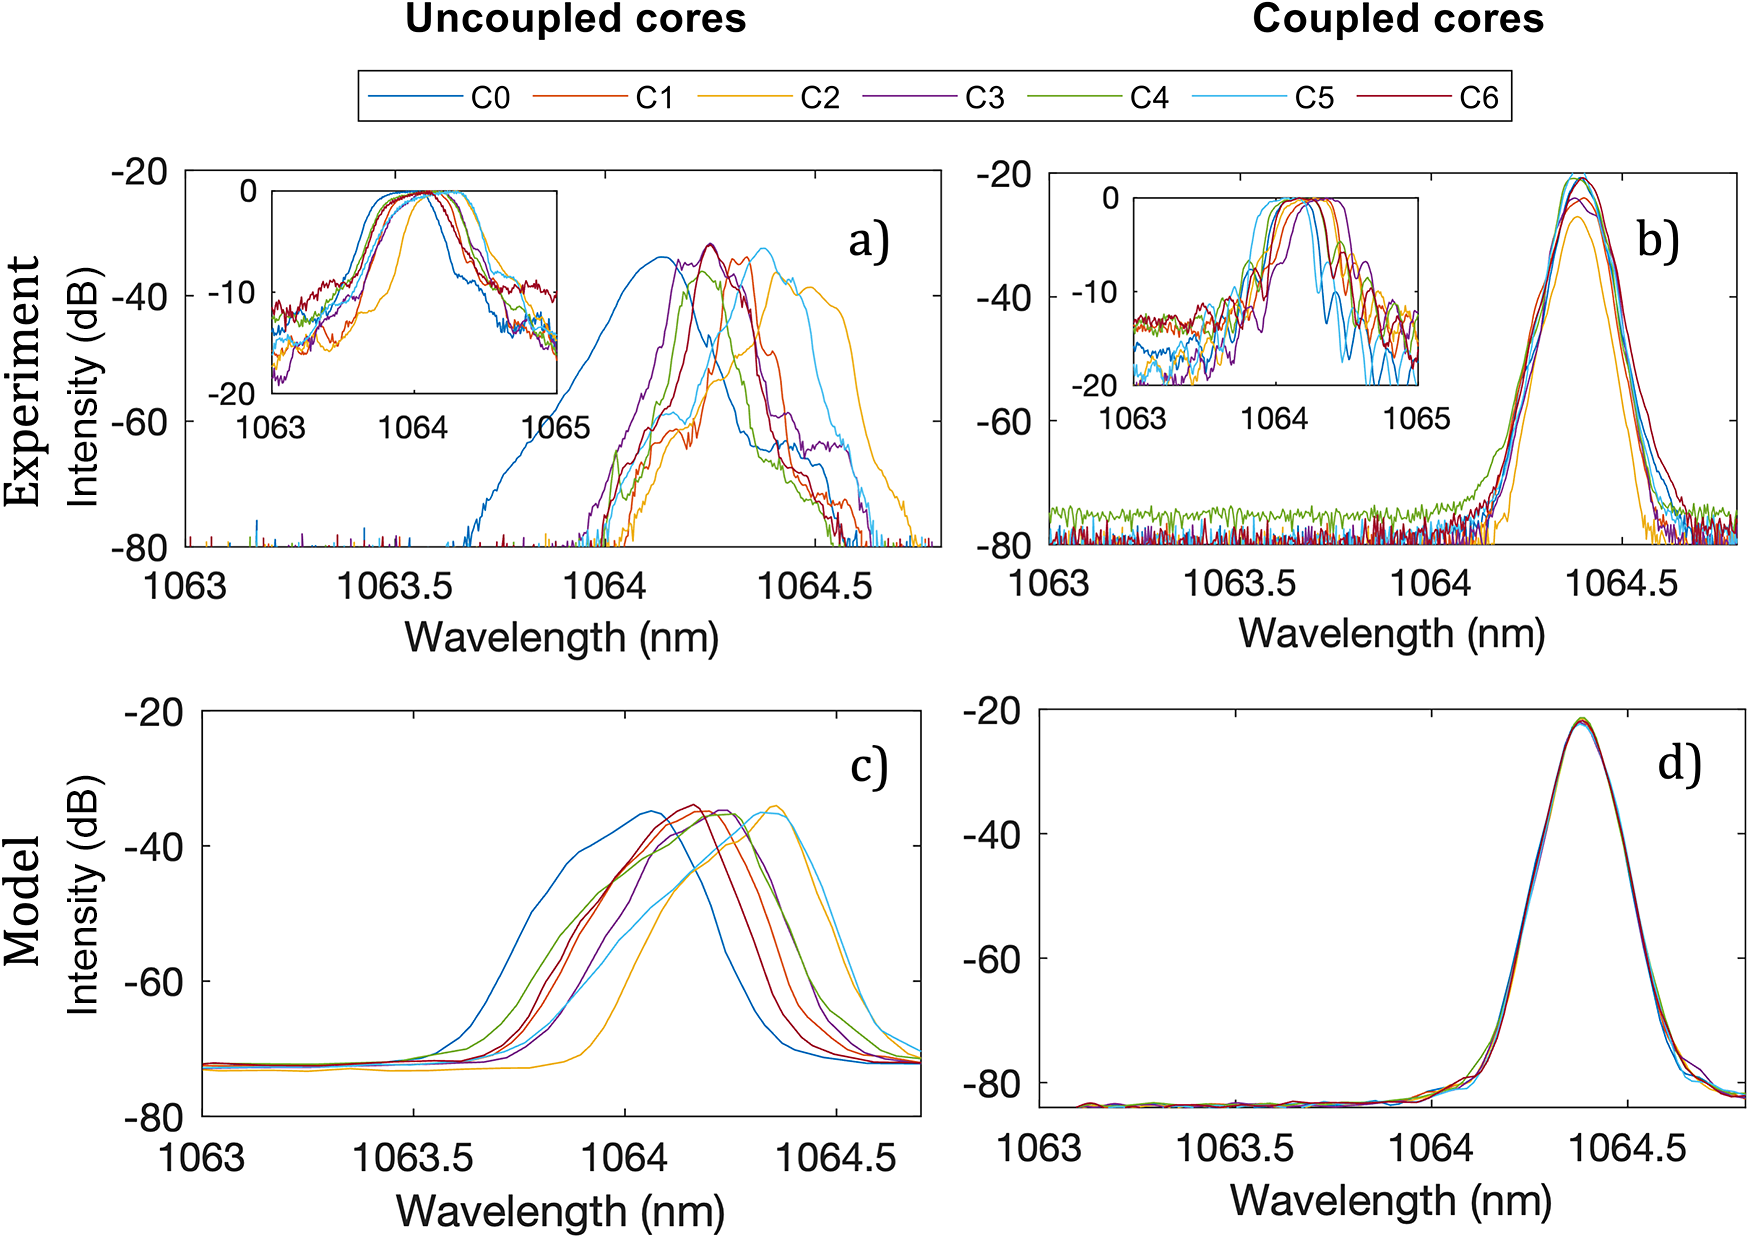
 ) FBGs that have been inscribed individually in each core by the femtosecond PbP technique at the input end. The orientation of the FBG grooves was azimuthal for peripheral cores and radial for the central core (which can be seen in the microscopic MCF image in Figure 1). The FBG reflection spectra measured using a single-core singlemode fiber, which was coupled to each core, exhibit a significant spread at the central wavelength of different FBGs in both cases; see insets in Figures 2(a) and 2(b). At the same time, −3 dB width of the main reflection peak varies in the range of 0.45–0.6 nm for MCF1, while it is around 0.4 nm in the case of MCF2.
The generation spectra in each core C0–C6 at a total generation power of about 10 W for weak coupling measured in the experiment (a) and obtained in the model (c) and for strong coupling measured in the experiment (b) and obtained in the model (d). Insets in (a) and (b) correspond to FBG reflection spectra.

Figure 2 Long description
Top-left panel labeled a shows experimental spectra for uncoupled cores with wavelength from 1063 to 1065 nanometers on the x-axis and d B from minus 80 to minus 20 on the y-axis. Seven colored lines represent C0 to C6, each peaking between 1064 and 1065 nanometers with varying intensities. The inset at the upper left displays F B G reflection spectra for the same cores, with a similar wavelength range and d B from minus 20 to 0. Top-right panel labeled b shows experimental spectra for coupled cores, with all lines peaking sharply near 1064.5 nanometers and closely overlapping. Its inset at the upper left shows F B G reflection spectra with broader peaks. Bottom-left panel labeled c presents modeled spectra for uncoupled cores, with seven colored lines peaking between 1064 and 1065 nanometers, matching the experimental trends but with smoother profiles. Bottom-right panel labeled d shows modeled spectra for coupled cores, where all lines overlap almost perfectly at a single sharp peak near 1064.5 nanometers. The legend above the panels identifies line colors for C0 to C6.
The generated radiation at a wavelength of 1064 nm was analyzed by a measurement setup including an optical spectrum analyzer (OSA), as well as power (P) or beam quality (
${{M}}^2$
 ) meters. The unabsorbed pump power was removed from the measurement path using a system of dichroic mirrors and an interference filter. It has been found that with different active fiber lengths (
$\sim 10$
) meters. The unabsorbed pump power was removed from the measurement path using a system of dichroic mirrors and an interference filter. It has been found that with different active fiber lengths (
$\sim 10$
 and
$\sim 35$
and
$\sim 35$
 m for MCF1 and MCF2, respectively) the laser generates nearly the same total power at 1064 nm – up to 33 W at 50 W pumping with slope efficiency of approximately 70%[
Reference Kuznetsov, Wolf, Egorova, Semjonov, Dostovalov, Podivilov and Babin
17
]. The beam quality parameter is also nearly the same for each core, only slightly varying in different cases (
${{M}}^2=1.4{-}1.7$
m for MCF1 and MCF2, respectively) the laser generates nearly the same total power at 1064 nm – up to 33 W at 50 W pumping with slope efficiency of approximately 70%[
Reference Kuznetsov, Wolf, Egorova, Semjonov, Dostovalov, Podivilov and Babin
17
]. The beam quality parameter is also nearly the same for each core, only slightly varying in different cases (
${{M}}^2=1.4{-}1.7$
 ). At the same time, spectral characteristics for the two fiber types MCF1, 2 (with weak and strong coupling, respectively) are completely different in all power ranges, which requires a comprehensive modeling of the MCF laser generation and detailed quantitative comparison with experiment in these cases.
3 Model
A simplified qualitative analytical model of two coupled cores has been developed[
Reference Kuznetsov, Wolf, Egorova, Semjonov, Dostovalov, Podivilov and Babin
17
]. In the case of weak coupling of the cores, independent laser generation is realized with longitudinal mode frequencies near the frequency of the maximum reflection of the corresponding FBG:
${R}_j\left({\omega}_j\right)=\max \left({\left|{r}_j\left(\omega \right)\right|}^2\right)$
 . In the case of strong coupling of the cores, the frequency
${\omega}^{\ast }$
. In the case of strong coupling of the cores, the frequency
${\omega}^{\ast }$
 of stable generation in both cores is determined by the maximum of the geometric-mean reflection coefficients of the individual gratings,
$\mid {r}_1\left({\omega}^{\ast}\right){r}_2\left({\omega}^{\ast}\right)\mid =\max \left({r}_1\left(\omega \right){r}_2\left(\omega \right)\right)$
of stable generation in both cores is determined by the maximum of the geometric-mean reflection coefficients of the individual gratings,
$\mid {r}_1\left({\omega}^{\ast}\right){r}_2\left({\omega}^{\ast}\right)\mid =\max \left({r}_1\left(\omega \right){r}_2\left(\omega \right)\right)$
 . However, for the seven-core laser, a similar analytical solution cannot be found, so we develop a more comprehensive approach.
The electromagnetic field in the fiber cores is the sum of waves propagating in opposite directions,
$E={\sum}_{j=0}^6({A}_j^{+}(z,t){e}^{- ikz}+{A}_j^{-}(z,t){e}^{i kz})\Psi (\mathbf{r}-{\mathbf{r}}_j){e}^{i\omega t}$
 , with the frequency
$\omega =281$
, with the frequency
$\omega =281$
 THz (
$\lambda$
THz (
$\lambda$
 = 1064 nm) and the propagation constant
$k=\left(2\pi {n}_{\mathrm{eff}}\right)/\lambda =8.6\kern0.22em {\mu \mathrm{m}}^{-1}$
= 1064 nm) and the propagation constant
$k=\left(2\pi {n}_{\mathrm{eff}}\right)/\lambda =8.6\kern0.22em {\mu \mathrm{m}}^{-1}$
 , where
${n}_{\mathrm{eff}}$
, where
${n}_{\mathrm{eff}}$
 is the average effective refractive index in the cores. Here
$\Psi \left(\mathbf{r}-{\mathbf{r}}_j\right)$
is the average effective refractive index in the cores. Here
$\Psi \left(\mathbf{r}-{\mathbf{r}}_j\right)$
 is the normalized spatial distribution of the core
$j$
is the normalized spatial distribution of the core
$j$
 fundamental mode in the fiber cross-section and
${r}_j$
fundamental mode in the fiber cross-section and
${r}_j$
 is the coordinate of the core
$j$
is the coordinate of the core
$j$
 center (
$j=0,\ldots,6$
center (
$j=0,\ldots,6$
 ). The strength of the coupling between the modes of different cores is determined by the overlap integral
$J\sim \int \left({n}_2-{n}_1\right)/{n}_1\Psi \left(\mathbf{r}-{\mathbf{r}}_j\right)\Psi \left(\mathbf{r}-{\mathbf{r}}_k\right)\mathrm{d}^2r\ \left(\forall j\ne k\right)$
). The strength of the coupling between the modes of different cores is determined by the overlap integral
$J\sim \int \left({n}_2-{n}_1\right)/{n}_1\Psi \left(\mathbf{r}-{\mathbf{r}}_j\right)\Psi \left(\mathbf{r}-{\mathbf{r}}_k\right)\mathrm{d}^2r\ \left(\forall j\ne k\right)$
 , where
${n}_1$
, where
${n}_1$
 is the refractive index of the fiber cladding and
${n}_2$
is the refractive index of the fiber cladding and
${n}_2$
 is the refractive index of the fiber core. Its propagation is described by a system of coupled equations:

Here the square of the field amplitude is normalized to the power. The model includes the relative difference in refractive indices
$\delta {n}_j$
 in the cores, owing to fiber fabrication and its bending at spooling. It is randomly varied such that
${\sum}_{j=0}^6\delta {n}_j=0$
in the cores, owing to fiber fabrication and its bending at spooling. It is randomly varied such that
${\sum}_{j=0}^6\delta {n}_j=0$
 and does not exceed a certain specified value
$\mid \delta {n}_j\mid <\delta {n}_{\mathrm{max}}$
and does not exceed a certain specified value
$\mid \delta {n}_j\mid <\delta {n}_{\mathrm{max}}$
 . The nonlinear coefficient of self-phase modulation (SPM) in each core is
$\gamma =5\times {10}^{-3}\kern0.1em {\left(\mathrm{W}\cdot \mathrm{m}\right)}^{-1}$
. The nonlinear coefficient of self-phase modulation (SPM) in each core is
$\gamma =5\times {10}^{-3}\kern0.1em {\left(\mathrm{W}\cdot \mathrm{m}\right)}^{-1}$
 , and the model neglects dispersion due to the narrow spectral line of the laser. Here,
${A}_{\mathrm{sp}}$
, and the model neglects dispersion due to the narrow spectral line of the laser. Here,
${A}_{\mathrm{sp}}$
 is the spontaneous noise at the level of
${10}^{-4}\ {\mathrm{W}}^{1/2}/h$
is the spontaneous noise at the level of
${10}^{-4}\ {\mathrm{W}}^{1/2}/h$
 , where
$h$
, where
$h$
 is the step along the
$z$
is the step along the
$z$
 coordinate, which corresponds to the noise level observed in the experiment. The addition of a time derivative in the linear coupling term is necessary to account for the different group velocities of the supermodes.
The model considers two cases of laser generation in fibers: with weak and strong coupling between the cores. The coupling strength is determined by the overlap integral
$J$
 , which is mainly determined by the distance
${r}_{\mathrm{c}}$
, which is mainly determined by the distance
${r}_{\mathrm{c}}$
 between the cores located at the vertices of a regular hexagon (Figure 1, bottom panel). Weak coupling was observed in the fiber with core spacing
${r}_{\mathrm{c}}=28.3\kern0.22em \mu$
between the cores located at the vertices of a regular hexagon (Figure 1, bottom panel). Weak coupling was observed in the fiber with core spacing
${r}_{\mathrm{c}}=28.3\kern0.22em \mu$
 m, and the corresponding overlap integral is
$J<{10}^{-6}$
m, and the corresponding overlap integral is
$J<{10}^{-6}$
 . For the strong coupling case, the inter-core distance is
${r}_{\mathrm{c}}=17.2\kern0.22em \mu$
. For the strong coupling case, the inter-core distance is
${r}_{\mathrm{c}}=17.2\kern0.22em \mu$
 m and the overlap integral is estimated to be
$J={10}^{-4}$
m and the overlap integral is estimated to be
$J={10}^{-4}$
 .
.
Here the gain depends on the average signal power
$\left\langle {I}_j(z)\right\rangle ={\int}_{t-\tau}^t\mathrm{d}{t}^{\prime }{\left|{A}_j^{\pm}\Big(z,{t}^{\prime}\Big)\right|}^2/\tau$
 and is calculated in a stationary state using the simplest model of saturation high above the threshold:

where
${P}_{\mathrm{eff}}={P}_{\mathrm{in}}{I}_{\mathrm{s}}/{P}_{\mathrm{s}}$
 is the effective saturation power combining input pump power
${P}_{\mathrm{in}}$
is the effective saturation power combining input pump power
${P}_{\mathrm{in}}$
 and the ratio
${I}_{\mathrm{s}}/{P}_{\mathrm{s}}$
and the ratio
${I}_{\mathrm{s}}/{P}_{\mathrm{s}}$
 of the signal and pump saturation parameters, which depends on the fiber geometry and ion density of the active medium. In the case of weak coupling
${I}_{\mathrm{s}}/{P}_{\mathrm{s}}=0.004$
of the signal and pump saturation parameters, which depends on the fiber geometry and ion density of the active medium. In the case of weak coupling
${I}_{\mathrm{s}}/{P}_{\mathrm{s}}=0.004$
 is less than in the case of strong coupling
${I}_{\mathrm{s}}/{P}_{\mathrm{s}}=0.014$
is less than in the case of strong coupling
${I}_{\mathrm{s}}/{P}_{\mathrm{s}}=0.014$
 due to the difference in the effective areas of the cores, while the gain is
${g}_0=0.35\kern0.22em {\mathrm{m}}^{-1}$
due to the difference in the effective areas of the cores, while the gain is
${g}_0=0.35\kern0.22em {\mathrm{m}}^{-1}$
 .
.
The boundary condition at the fiber exit
$\left(z=0\right)$
 is Fresnel reflection:
${A}_j^{+}\left(0,t\right)={A}_j^{-}\left(0,t\right)/5$
is Fresnel reflection:
${A}_j^{+}\left(0,t\right)={A}_j^{-}\left(0,t\right)/5$
 . On the other side
$\left(z=L\right)$
. On the other side
$\left(z=L\right)$
 the boundary condition is the reflection from the Bragg grating, which is inscribed separately in each of the cores. The condition for reflection of a wave packet in the frequency domain for each core is
${A}_j^{-}\left(L,\omega \right)={A}_j^{+}\left(L,\omega \right){R}_j\left(\omega \right)\exp \left(i{\phi}_j\right)$
the boundary condition is the reflection from the Bragg grating, which is inscribed separately in each of the cores. The condition for reflection of a wave packet in the frequency domain for each core is
${A}_j^{-}\left(L,\omega \right)={A}_j^{+}\left(L,\omega \right){R}_j\left(\omega \right)\exp \left(i{\phi}_j\right)$
 , where
${\phi}_j$
, where
${\phi}_j$
 is a random phase due to variance in the grating positions in different cores near average distance
$z=L$
is a random phase due to variance in the grating positions in different cores near average distance
$z=L$
 , and
${R}_j\left(\omega \right)$
, and
${R}_j\left(\omega \right)$
 is the reflection spectrum of the Bragg grating in core
$j$
is the reflection spectrum of the Bragg grating in core
$j$
 , which was interpolated from the experimental data (insertion in Figures 2(a) and 2(b)).
Since waves propagating in different directions are coupled only at the edges of the resonator, the system is solved by the method of propagating a pulse with a duration of 4.8 ns (1 m), which is periodically reflected from the boundaries of the fiber, taking into account the boundary conditions. The numerical scheme for solving the system of Equation (1) is based on the split-step method, where the linear and nonlinear parts of the equation are calculated independently; the linear part is calculated using the matrix exponent. The time step is
$\tau =0.8$
 ps, while the spatial step is
$h=10$
ps, while the spatial step is
$h=10$
 mm for weak coupling case. For the case of strong coupling, a more complex numerical scheme with step splitting was used. To accurately calculate the step of linear interaction of the core modes in the case of strong coupling, the large step
$h=7$
mm for weak coupling case. For the case of strong coupling, a more complex numerical scheme with step splitting was used. To accurately calculate the step of linear interaction of the core modes in the case of strong coupling, the large step
$h=7$
 mm was broken down into small steps of
${h}_2=700\kern0.22em \mu$
mm was broken down into small steps of
${h}_2=700\kern0.22em \mu$
 m due to the large value of the overlap integral. To calculate the steps with nonlinearity, we averaged the intensity along z with a step
${h}_2=700\kern0.22em \mu$
m due to the large value of the overlap integral. To calculate the steps with nonlinearity, we averaged the intensity along z with a step
${h}_2=700\kern0.22em \mu$
 m over 7 mm, and used the resulting average value for the following calculations with a step of
$h=7$
m over 7 mm, and used the resulting average value for the following calculations with a step of
$h=7$
 mm. The average intensity value was updated every 70 cm. To calculate the time derivative in a step with the linear coupling of cores, Fourier transform in time was used.
4 Comparison of modeling and experimental data
From a simple analytical model of two coupled cores it follows that an important parameter determining the possibility of collapse of the laser generation spectrum is the ratio of the difference in refractive indices to the coupling strength
$\delta {n}_{\mathrm{max}}/J$
 [
Reference Kuznetsov, Wolf, Egorova, Semjonov, Dostovalov, Podivilov and Babin
17
]. In the case
$\delta {n}_{\mathrm{max}}/J\gg 1$
[
Reference Kuznetsov, Wolf, Egorova, Semjonov, Dostovalov, Podivilov and Babin
17
]. In the case
$\delta {n}_{\mathrm{max}}/J\gg 1$
 , independent laser generation in each core is realized, while in the opposite case
$\delta {n}_{\mathrm{max}}/J\ll 1$
, independent laser generation in each core is realized, while in the opposite case
$\delta {n}_{\mathrm{max}}/J\ll 1$
 a collapse of independent spectra into one common spectrum defined by the geometric mean of reflection spectra of the Bragg gratings becomes possible. Generalizing the analytical prediction to the case of seven cores, the maximum refractive index difference in the cores
$\delta {n}_{\mathrm{max}}={10}^{-5}$
a collapse of independent spectra into one common spectrum defined by the geometric mean of reflection spectra of the Bragg gratings becomes possible. Generalizing the analytical prediction to the case of seven cores, the maximum refractive index difference in the cores
$\delta {n}_{\mathrm{max}}={10}^{-5}$
 lying between the values of coupling strength
$J$
lying between the values of coupling strength
$J$
 for the two studied cases is used in simulations.
We start the representation of simulation results and their comparison with experiment from the case of uncoupled cores
$J=0$
 ; see Figures 2(a) and 2(c). The parameter related to the pump power used in simulation
${P}_{\mathrm{eff}}=0.36$
; see Figures 2(a) and 2(c). The parameter related to the pump power used in simulation
${P}_{\mathrm{eff}}=0.36$
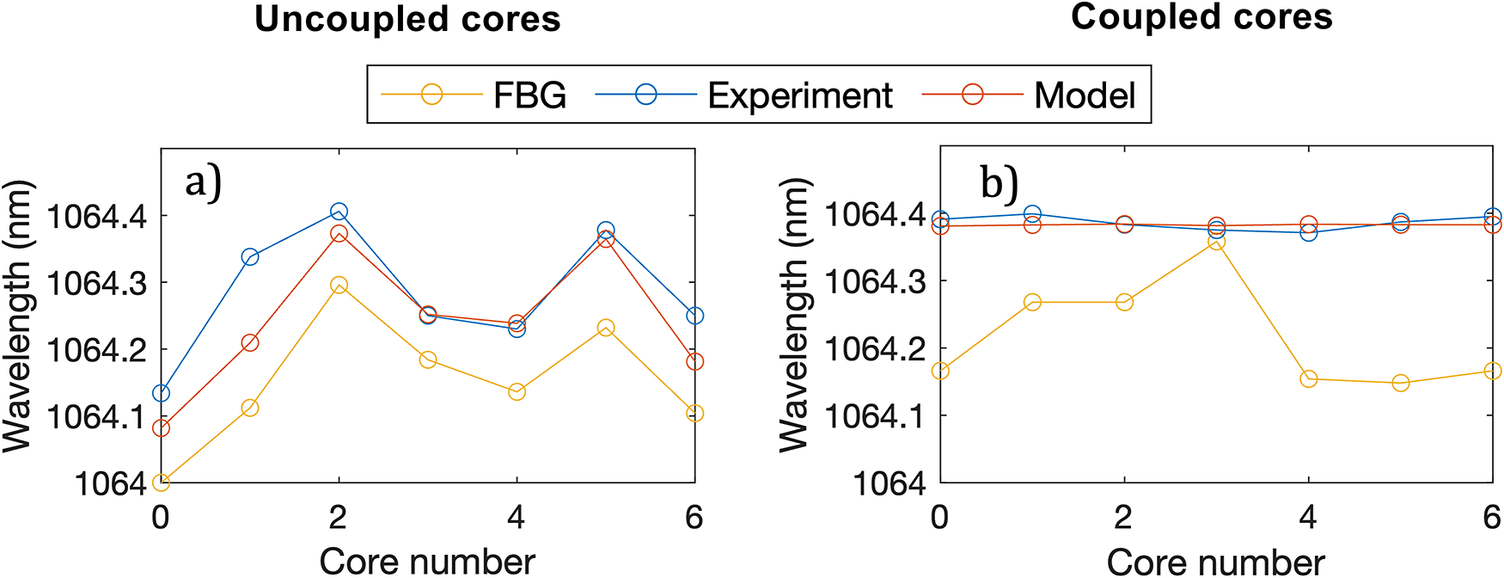
 W corresponds to the generated total output power of about 10 W. For uncoupled cores, Equation (1) becomes a system of independent equations and the laser generation in each core is set independently (Figure 2(c)). This result is in good agreement with the experimentally measured generation spectra in fiber cores in the case of weak coupling (Figure 2(a)). The calculated central wavelength of each individual line (Figure 3(a)) completely matches the central wavelength of the corresponding FBG reflection spectrum extracted from the inset in Figure 2(a), whereas the experimentally measured values repeat the FBG wavelengths with a shift of about 0.2 nm taken into account in modeling of the laser spectra. The red shift is associated with the heating of the FBG in the laser cavity against the ‘cold’ FBG spectrum. As FBG thermal sensitivity in silica glass is approximately
$8\kern0.22em \mathrm{pm}/{}^{\circ}$
W corresponds to the generated total output power of about 10 W. For uncoupled cores, Equation (1) becomes a system of independent equations and the laser generation in each core is set independently (Figure 2(c)). This result is in good agreement with the experimentally measured generation spectra in fiber cores in the case of weak coupling (Figure 2(a)). The calculated central wavelength of each individual line (Figure 3(a)) completely matches the central wavelength of the corresponding FBG reflection spectrum extracted from the inset in Figure 2(a), whereas the experimentally measured values repeat the FBG wavelengths with a shift of about 0.2 nm taken into account in modeling of the laser spectra. The red shift is associated with the heating of the FBG in the laser cavity against the ‘cold’ FBG spectrum. As FBG thermal sensitivity in silica glass is approximately
$8\kern0.22em \mathrm{pm}/{}^{\circ}$
 C, fs-inscribed FBG heating is estimated as approximately
$25{}^{\circ}$
C, fs-inscribed FBG heating is estimated as approximately
$25{}^{\circ}$
 C, which is typical for such power levels accounting for the core size[
Reference Kraemer, Matzdorf, Liem, Bock, Middents, Goebel, Heck, Richter, Schreiber, Tünnermann and Nolte
18
]. The shift was directly observed in the experimental test of the MCF laser line stability.
C, which is typical for such power levels accounting for the core size[
Reference Kraemer, Matzdorf, Liem, Bock, Middents, Goebel, Heck, Richter, Schreiber, Tünnermann and Nolte
18
]. The shift was directly observed in the experimental test of the MCF laser line stability.
Comparison of the central wavelength of generation spectra in the experiment and in the simulation shown together with the central wavelength of ‘cold’ FBG reflection spectra for weak (a) and strong (b) coupling.

Figure 3 Long description
The left panel labeled a shows wavelength in nanometers on the y-axis from 1064 to 1064.4 and core number on the x-axis from 0 to 6. Three lines are plotted: F B G in yellow, experiment in blue, and model in red. The F B G line starts at 1064, rises to a peak at core 2, then decreases and fluctuates. The experiment and model lines follow a similar trend but are offset higher, peaking at core 2 and converging at core 4. The right panel labeled b has the same axes. The F B G line varies, but the experiment and model lines remain nearly flat at about 1064.4 nanometers across all core numbers. The legend above both panels identifies the three data series.
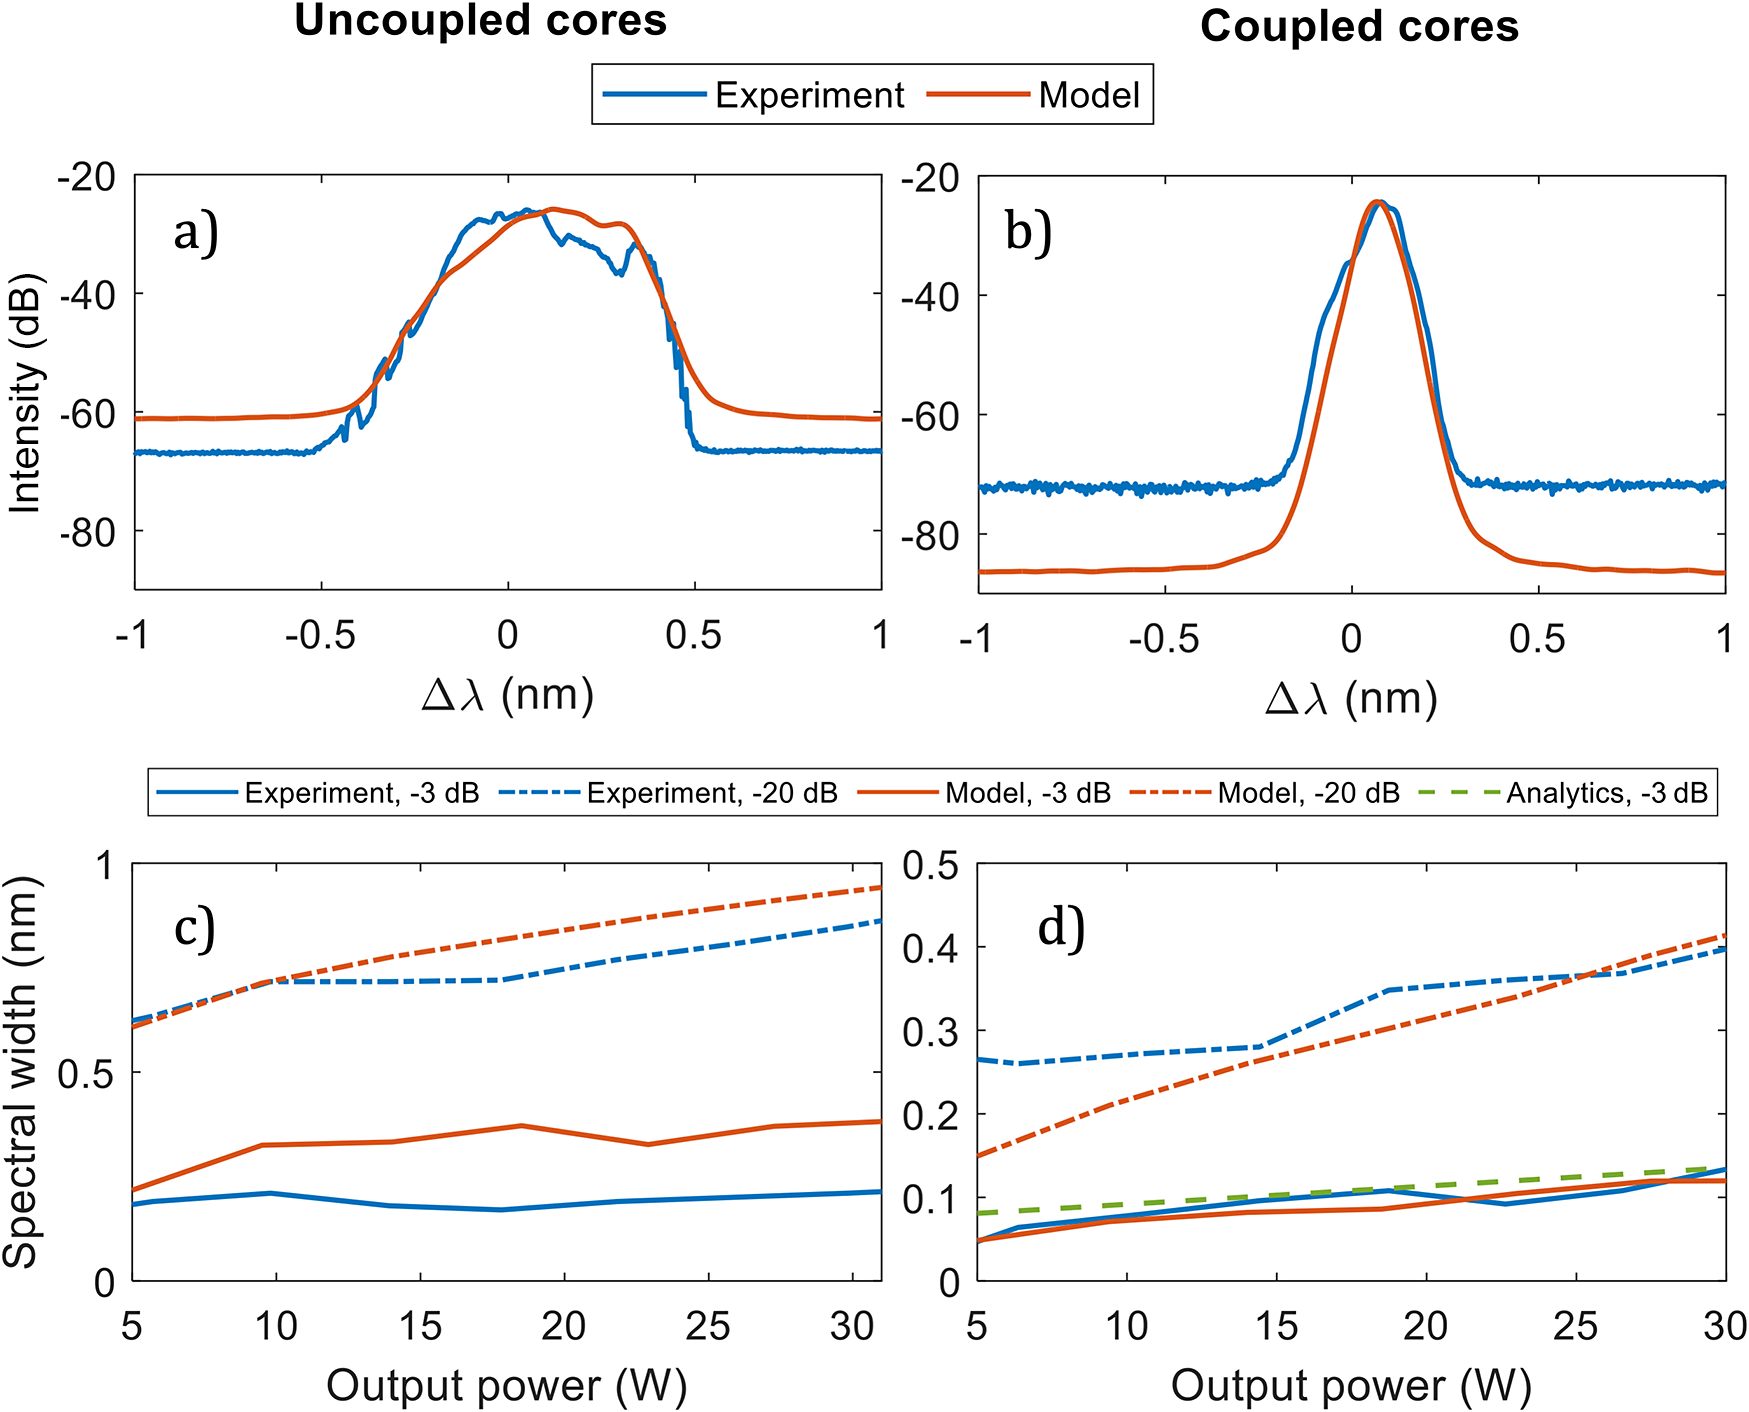
In order to bring the shape of the generation spectra obtained in the simulation closer to the experimental ones, additional processing of the results was carried out. First of all, the calculated spectrum was convolved with the hardware functions of the spectrum analyzer, which is a Gaussian function of 0.02 nm width. Secondly, the spectra were averaged over the round trips, since the characteristic time of measuring the spectra in the experiment is of the order of milliseconds, which includes about 10,000 round trips. To determine the required number of passes on average, we monitored in simulations the change of the generation spectrum width. In the case where the number of round trips on average reached approximately 500, the total width of the distribution of spectral power in the cores was unchanged. It amounts to 0.32 and 0.71 nm at the levels of –3 and –20 dB, respectively, and the calculated spectral shape is consistent with the measured total spectrum at an output power of 10 W (Figure 4(a)).
Total generation spectrum from all cores for total output power of 10 W for (a) weak coupling and (b) strong coupling. Comparison of the width (at the levels of –3 and –20 dB) of the total spectrum of laser generation obtained in the experiment and in the simulation for (c) weak coupling and (d) strong coupling.

Figure 4 Long description
Top-left panel shows a line graph with y-axis labeled d B and x-axis labeled delta lambda in nanometers, comparing experimental and model spectra for uncoupled cores at 10 watts. The experimental curve is blue and the model is orange, both peaking near zero and spanning roughly minus 0.7 to plus 0.7 nanometers. Top-right panel shows a similar graph for coupled cores, with both curves sharply peaking at zero and narrower spectral width. Bottom-left panel plots spectral width in nanometers versus output power in watts for uncoupled cores. Four curves are shown: blue solid for experiment at minus 3 d B, blue dashed for experiment at minus 20 d B, orange solid for model at minus 3 d B, orange dashed for model at minus 20 d B. Both experimental and model spectral widths increase with output power, with minus 20 d B curves higher than minus 3 d B. Bottom-right panel shows the same plot for coupled cores, with an additional green dashed line for analytics at minus 3 d B. All curves show lower spectral widths than in the uncoupled case, with the analytics line nearly flat and lowest.
In the case of weak coupling, both in the simulation and in the experiment, lasing occurs independently in each core, and the width of the total spectrum is mainly determined by the distance between the reflection peaks of the Bragg gratings. That is why it is already large at the generation threshold and is only slightly growing with increasing power (Figure 4(c)). Visible deviation of power broadening curves for the –3 dB width arises from a stronger modulation of the spectrum near its maximum in the experiment, while it is smooth in the simulation (see Figure 4(a)).
The situation changes dramatically in the case of strong coupling between the cores. For strongly coupled cores, a collapse of the generation spectrum is observed, that is, laser generation occurs at one wavelength in all cores corresponding to the maximum of the product of the reflection spectra of the individual Bragg gratings; see Figures 2(b), 2(d) and 3(b), which demonstrate quite good agreement between theory and experiment accounting for the thermal shift of the FBGs at an output power of 10 W. The calculated width of the total spectrum in this case (Figure 4(b)) nearly coincides with that for the individual one and amounts to 0.07 and 0.21 nm at the levels of –3 and –20 dB, respectively, demonstrating good correspondence with the total spectrum in the experiment. The power dependence of both –3 and –20 dB widths (Figure 4(d)) also shows good agreement between the theory and experiment. It should be noted that the collapsed spectrum for coupled cores is much narrower and smoother than the total spectrum for uncoupled cores, and is accompanied by a sufficient increase of the signal-to-noise ratio.
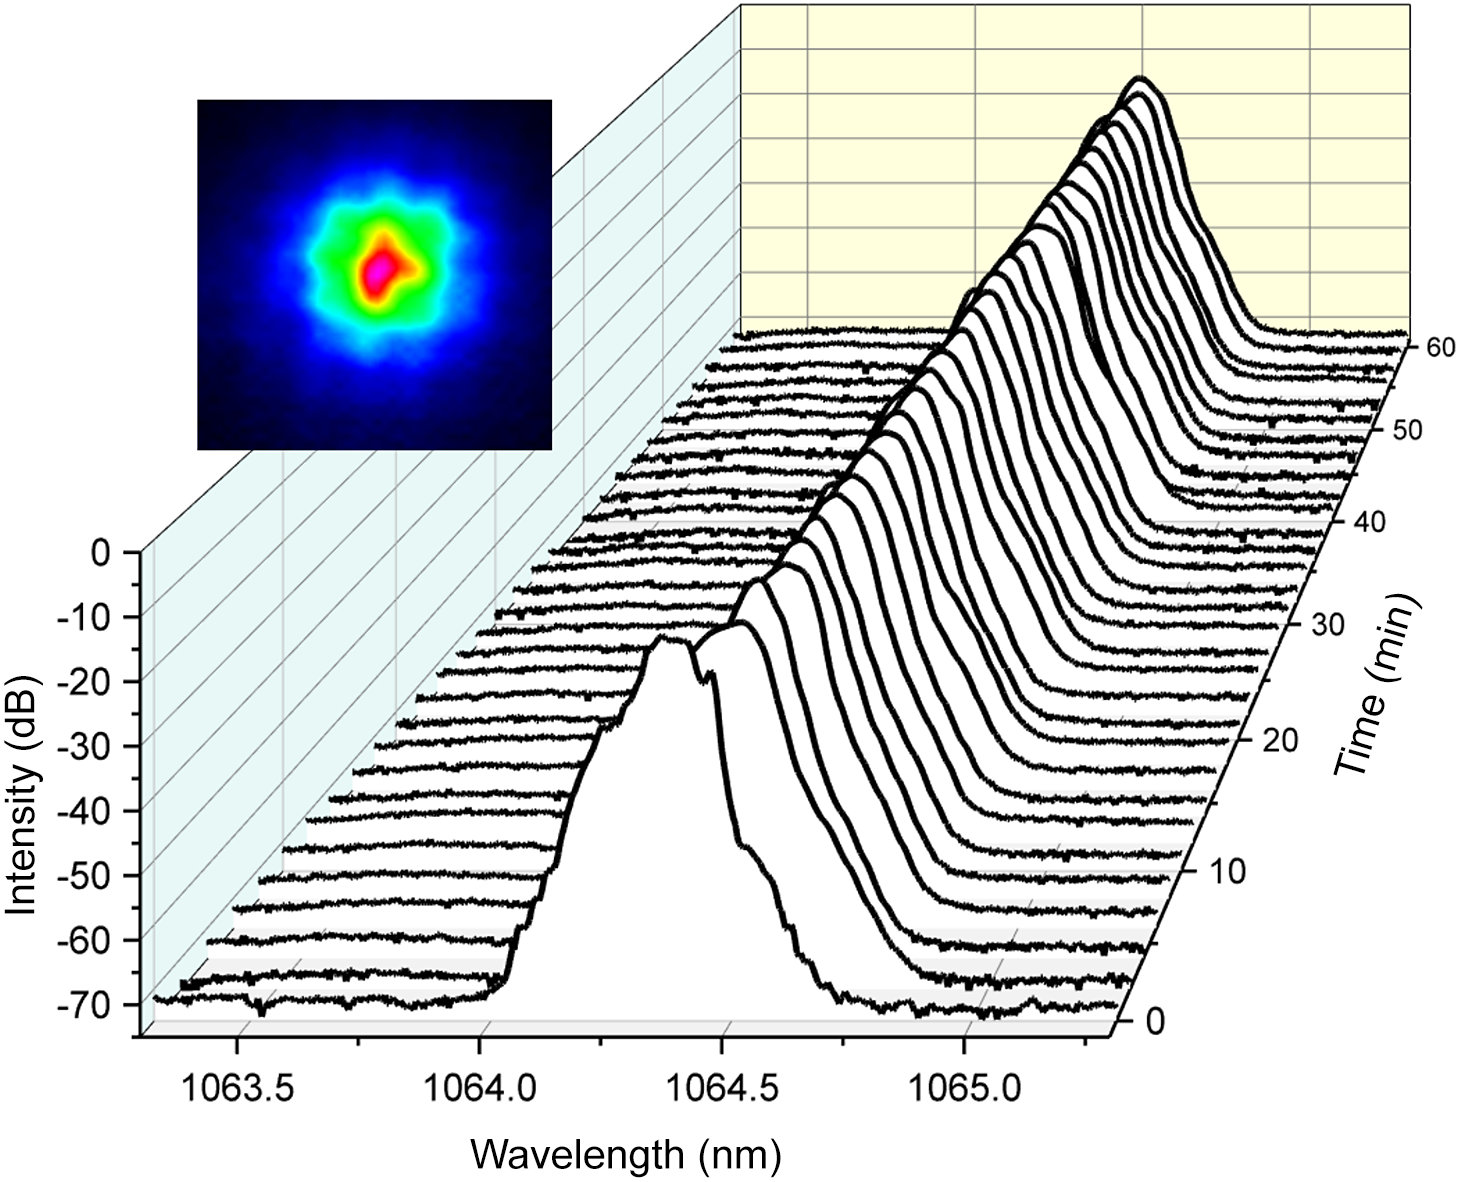
The measured long-term stability of the total spectrum is also much better for the collapsed narrow line in the case of coupled cores (Figure 5). Only in the first minute after switching on the laser, the generated spectrum is not stable at the formation of the spectral shape during the process of the individual FBGs warming up after the switching, which also results in 0.2 nm red shift. The total beam (see the inset in Figure 5) measured in the far-field is also stable, having a smooth bell-like shape in contrast to a more speckled beam shape in the case of uncoupled cores.
Stability test (1 hour) of the MCF laser total generation spectrum (corresponding to Figure 4(b)) together with the total beam shape in the far-field shown in the inset.

Figure 5 Long description
The main panel is a three-dimensional line graph with the x-axis labeled Wavelength, nanometers, ranging from 1063.5 to 1065.5, the y-axis labeled I, d B, ranging from minus 70 to 0, and the z-axis labeled Time, minutes, ranging from 0 to 60. Multiple spectral traces are stacked along the time axis, each showing a broad peak centered near 1065 nanometers. The peak intensity remains stable with minor fluctuations in shape and amplitude across the hour. At the top left, an inset displays a far-field beam profile: at the center is a red region, surrounded by concentric yellow, green, and blue rings, indicating a symmetric intensity distribution.
5 Results and discussion
So, the developed numerical model adequately describes the spectral collapse effect observed in the seven-core fiber laser with the cavity based on an array of wavelength-shifted FBGs. The generation spectrum in uncoupled cores represents a simple sum of the individual spectra centered at different FBG reflection wavelengths in different cores, whereas in the case of strong coupling the spectra in all cores become the same, centered at the maximum geometric-mean reflection of the individual wavelength-shifted FBG spectra. As the broadening of the total spectrum arising from the wavelength shift is absent here, the spectrum becomes sufficiently narrower (by factor of
$\sim 4$
 at the –3 dB level) and only slightly broadens with increasing power. As in this regime a coherent superposition of supermodes at a common wavelength is generated, it is important to clarify contribution of different physical mechanisms in the linewidth formation. It should be definitely different from the case of a single-core laser, where the main role is shown to belong to SPM due to the Kerr effect with a small addition from an SHB effect[
Reference Kablukov, Zlobina, Podivilov and Babin
19
].
at the –3 dB level) and only slightly broadens with increasing power. As in this regime a coherent superposition of supermodes at a common wavelength is generated, it is important to clarify contribution of different physical mechanisms in the linewidth formation. It should be definitely different from the case of a single-core laser, where the main role is shown to belong to SPM due to the Kerr effect with a small addition from an SHB effect[
Reference Kablukov, Zlobina, Podivilov and Babin
19
].
Our numerical simulations of linewidth broadening in the case of a strongly coupled seven-core laser have shown that the SHB in the gain coefficient along the fiber becomes much more important here. Moreover, if we neglect by the summand comprising the time derivative in the third term on the right-hand side of Equation (1) describing mode coupling, the SHB-induced spectral broadening becomes huge since all supermodes propagate with the same group velocity in this case. If we include it, the SHB effect is greatly reduced as different group velocities of the supermodes lead to washing out the spatial holes. Besides, it has been revealed that the increase of coupling strength leads to linewidth narrowing (by
$\sim 2$
 times at the increase of coupling strength by one order). To better understand this effect, let us treat it starting from the simple analytical model of the SHB effect for a single-core laser[
Reference Kablukov, Zlobina, Podivilov and Babin
19
].
times at the increase of coupling strength by one order). To better understand this effect, let us treat it starting from the simple analytical model of the SHB effect for a single-core laser[
Reference Kablukov, Zlobina, Podivilov and Babin
19
].
The propagation constants of supermodes in a seven-core fiber differ by a value of the order of
$kJ$
 . The coherent superposition of any pair of supermodes leads to intensity beats in the cores with a characteristic period
${L}_{\mathrm{p}}\simeq 2\pi / kJ$
. The coherent superposition of any pair of supermodes leads to intensity beats in the cores with a characteristic period
${L}_{\mathrm{p}}\simeq 2\pi / kJ$
 in addition to the conventional beating of longitudinal modes in each core. Such large-scale beats lead to the burning of holes in the gain coefficients
${g}_j$
in addition to the conventional beating of longitudinal modes in each core. Such large-scale beats lead to the burning of holes in the gain coefficients
${g}_j$
 in the cores of magnitude
$\delta g$
in the cores of magnitude
$\delta g$
 and a decrease in the gain per pass for excited modes. This leads to an additional broadening of the emission spectrum since supermodes with a detuned frequency are excited, for which the intensity maxima in the cores fall on the maxima of the gain coefficients.
For a seven-core fiber, the hole burning depth
$\delta g$
 can be significantly smaller than the average gain. The peripheral cores include the entire set of supermodes, so superposition of multiple beat patterns results in a small modulation depth. However, the amplitude of the central core is included only in two azimuthally symmetric supermodes
${B}_{\pm }$
can be significantly smaller than the average gain. The peripheral cores include the entire set of supermodes, so superposition of multiple beat patterns results in a small modulation depth. However, the amplitude of the central core is included only in two azimuthally symmetric supermodes
${B}_{\pm }$
 , the difference in wave vectors of which is
$2\sqrt{7} kJ$
, the difference in wave vectors of which is
$2\sqrt{7} kJ$
 [
Reference Kuznetsov, Wolf, Egorova, Semjonov, Dostovalov, Podivilov and Babin
17
]. Therefore, the intensity modulation depth in the central core is 100%, and therefore we can set
$\delta {g}_0={g}_0$
[
Reference Kuznetsov, Wolf, Egorova, Semjonov, Dostovalov, Podivilov and Babin
17
]. Therefore, the intensity modulation depth in the central core is 100%, and therefore we can set
$\delta {g}_0={g}_0$
 for the central core. The broadening of the spectrum
$\Delta$
for the central core. The broadening of the spectrum
$\Delta$
 leads to a decrease in the coherence length
${L}_{\mathrm{c}}$
leads to a decrease in the coherence length
${L}_{\mathrm{c}}$
 between the supermodes
${B}_{\pm }$
between the supermodes
${B}_{\pm }$
 to the value
${L}_{\mathrm{c}}=1/\left(\delta k2\sqrt{7}J\right)=c/\left({n}_{\mathrm{eff}}\Delta 2\sqrt{7}J\right)$
to the value
${L}_{\mathrm{c}}=1/\left(\delta k2\sqrt{7}J\right)=c/\left({n}_{\mathrm{eff}}\Delta 2\sqrt{7}J\right)$
 .
.
As a result, the excess gain per round trip for the detuned modes is equal to the following:

where we took into account that the average gain per round trip is equal to the losses
$2 gL=\ln \left(1/{R}_{\mathrm{out}}\right)$
 with the reflection coefficient
${R}_{\mathrm{out}}=0.04$
with the reflection coefficient
${R}_{\mathrm{out}}=0.04$
 . Equating the excess gain to the excess loss due to spectral losses on Bragg gratings
${\Delta}^2/{\Delta}_{\mathrm{FBG}}^2$
. Equating the excess gain to the excess loss due to spectral losses on Bragg gratings
${\Delta}^2/{\Delta}_{\mathrm{FBG}}^2$
 , where the geometric-mean width of the gratings is
${\Delta}_{\mathrm{FBG}}=0.22$
, where the geometric-mean width of the gratings is
${\Delta}_{\mathrm{FBG}}=0.22$
 nm, we obtain the equilibrium spectral width due to the burning of large-scale gain holes that were burnt due to the beats between the cores:

where
${\Delta}_{\mathrm{m}}=2\pi c/\left({n}_{\mathrm{eff}}2L\right)$
 is the intermode frequency.
The resulting formula differs from the known formula for SHB in a single-core laser by the large parameter
${J}^{-1/3}$
 , and for characteristic values of coupling it turns out to be an order of magnitude larger than in single-core case[
Reference Kablukov, Zlobina, Podivilov and Babin
19
], but sufficiently reduces with increasing coupling strength. An additional linewidth narrowing occurs due to the lower value of the geometric-mean width
${\Delta}_{\mathrm{FBG}}$
, and for characteristic values of coupling it turns out to be an order of magnitude larger than in single-core case[
Reference Kablukov, Zlobina, Podivilov and Babin
19
], but sufficiently reduces with increasing coupling strength. An additional linewidth narrowing occurs due to the lower value of the geometric-mean width
${\Delta}_{\mathrm{FBG}}$
 of the FBG array in the seven-core fiber in comparison with the individual FBG reflection width. For the experimental parameters we obtain that the generation spectrum width due to SHB is approximately 0.07 nm. This corresponds quite well with the observed average level in the experimental data, whereas a slight linewidth broadening with increasing power is well defined by the SPM effect at the generation of the common spectrum within the geometric-mean FBG spectrum of width
${\Delta}_{\mathrm{FBG}}=0.22$
of the FBG array in the seven-core fiber in comparison with the individual FBG reflection width. For the experimental parameters we obtain that the generation spectrum width due to SHB is approximately 0.07 nm. This corresponds quite well with the observed average level in the experimental data, whereas a slight linewidth broadening with increasing power is well defined by the SPM effect at the generation of the common spectrum within the geometric-mean FBG spectrum of width
${\Delta}_{\mathrm{FBG}}=0.22$
 nm, with the laser linewidth described by the following formula:

at the hyperbolic-secant shape of the spectrum. Here, the Kerr constant
$\gamma =5\times {10}^{-3}\kern0.1em {\left(\mathrm{W}\cdot \mathrm{m}\right)}^{-1}$
 is the same as in Ref. [Reference Kablukov, Zlobina, Podivilov and Babin19] corresponding to a single core, whereas the total output power
${P}_{\mathrm{out}}$
is the same as in Ref. [Reference Kablukov, Zlobina, Podivilov and Babin19] corresponding to a single core, whereas the total output power
${P}_{\mathrm{out}}$
 is normalized by the number of cores
$N$
is normalized by the number of cores
$N$
 . If we combine the SPM-induced power broadening with the constant SHB width in Equation (4), such an analytical approximation fits well with both the experimental and the simulation data (see Figure 4(d)).
6 Conclusion
We have developed a comprehensive model describing a spectral collapse effect in a strongly coupled seven-core fiber laser with a wavelength-shifted FBG. Treating the supermode formation and hybridization in this system, the model predicts not only the common generation wavelength and spectral shape defined by the geometric-mean spectra of the wavelength-shifted FBGs but also clarifies the physical mechanisms and quantitative contributions in the laser linewidth of the SPM and SHB effects. Moreover, they are sufficiently modified in comparison with single-core lasers. In the case of a single-core laser, the role of the SHB effect was relatively small, but in the case of an MCF laser it becomes the main effect due to the contribution of large-scale beats between the cores. However, this contribution decreases with increasing coupling strength
$J$
 between the cores of the MCF. In addition, the SPM width is reduced with the increasing number of cores at the same output power. The developed model quantitatively describes the experimental value of laser linewidth and its power dependence in the studied seven-core fiber laser.
Moreover, using the model one can also predict the possibility of extreme linewidth narrowing if we take an MCF with a much stronger coupling strength
$J$
 (which will reduce the SHB effect according to Equation (4)) and an increased number of cores N (which will reduce the SPM effect at the same total output power according to Equation (5)). This dependence will be studied experimentally in the future.
The developed approach is fundamentally new for high-power narrowband CW MCF lasers, and has also great practical advantages such as the pure passive linewidth narrowing technique and high tolerance to FBG wavelength spreads at their fabrication. In addition, the demonstrated MCF laser with the collapsed total spectrum exhibits good stability of the laser line as well as of the total beam shape in the far-field. Such a narrow-linewidth MCF oscillator with combined output power may be also amplified to the kilowatt level in an all-fiber scheme, similar to that in Ref. [Reference Wang, Song, Chen, Ren, Ma, Liu, Yao and Zhou20]. It is also interesting to develop a new type of random Yb-doped fiber laser either in the CW or pulsed regime[ Reference Liu, Hao, Yang and Tang 21 ] using, instead of single-core fiber, a multicore active fiber with half-open cavity comprising an FBG array and artificial random Rayleigh reflectors fs-inscribed in the MCF similar to that implemented in a single-core single-mode fiber laser[ Reference Skvortsov, Wolf, Dostovalov, Egorova, Semjonov and Babin 22 ].
Acknowledgements
The work of A.G.K., E.V.P. and S.A.B. is supported by the Russian Science Foundation (grant 21-72-30024-Π) and the work of A.Yu.K. by the Ministry of Science and Higher Education of the Russian Federation (FSUS-2025-0010). The authors thank O. N. Egorova, S. L. Semjonov, A. A. Wolf and A. V. Dostovalov for MCF and FBG fabrication and characterization.


 Open access

