

1. Introduction
Glaciers in all regions of the world have been losing mass in recent decades (Zemp and others, Reference Zemp2019; Hugonnet and others, Reference Hugonnet2021), but the mass-balance record is short for glaciers in New Zealand. Length changes are available for the glaciers Te Moeka o Tūawe (Fox in the following) and Ka Roimata O Hine Hukatere (Franz Josef in the following) for a much longer period, starting in 1867 and 1894, respectively (Purdie and others, Reference Purdie2014). The records show limited retreat of the terminus until the 1940s, a strong retreat until 1983 (with intermittent advances in the 1950s for Franz Josef and 1960s for both glaciers), an advance phase until 2008 (interrupted from 2000 to 2004), and a strong retreat until 2020 (WGMS, 2021). According to Mackintosh and others (Reference Mackintosh2017) the latest advance phase was more widespread, with at least 58 glaciers in the Southern Alps advancing during this period. Despite this advance phase, the subsequent strong retreat of Fox and Franz Josef glaciers resulted by 2020 in their shortest length in the historic record. However, changes in area have not been recorded apart from a study investigating the central part of the Southern Alps (Gjermundsen and others, Reference Gjermundsen2011) and it is largely unknown how glacier area in New Zealand has changed over the past few decades.
In part, this lack of data is due to several difficulties compromising scene selection in a region with a maritime climate and steep terrain (e.g. seasonal snow, shadow, clouds). Early autumn snow which falls at high elevations often results in fresh snow cover before the late-lying snow from the previous winter has disappeared. As a compromise, satellite images from around mid-March have often been used for glacier mapping, but a ‘free of shadow’ view is only possible until about mid-February when seasonal snow is still widespread. Shadow from the steep terrain enhances the problem, as imagery from late autumn with a minimum seasonal snow cover (in April) comes at the expense of a strongly reduced visibility (and mapping accuracy) of glaciers in shadow. These are favourable conditions for glaciers, but they make glacier mapping difficult because there is no single time at which imagery can be captured. In addition to this, frequent cloud cover, resulting from the high mountain terrain (up to 3724 m) rising directly out of the ocean further diminishes the amount of useful satellite images. In consequence, glacier outlines have to be composed from scenes of different dates resulting in a high mapping workload. Considering also the challenges in mapping the numerous (141 according to Baumann and others, Reference Baumann2021) debris-covered glaciers (which are often located in shadow), it becomes clear that studies trying to map New Zealand's glaciers at large-scale are rare (e.g. Gjermundsen and others, Reference Gjermundsen2011).
The new 2016 glacier inventory of New Zealand by Baumann and others (Reference Baumann2021) used a wide range of images from Landsat-8 and Sentinel-2 over the full February to April time span to get all glaciers properly mapped. The results from widely used automated glacier mapping techniques (e.g. Paul and others, Reference Paul2015) had to be merged from different scenes and intense manual corrections were required with frequent back-checking of all information sources for each individual glacier. Given this high workload and rare opportunities, glacier outlines in the widely used global dataset of the Global Land Ice Measurements from Space (GLIMS) glacier database (GLIMS and NSIDC, 2005) are still from the 1978/88 inventory compiled by Chinn (Reference Chinn2001), extended with outlines from 2009 in the central part of the Southern Alps. When using this dataset for applications with modern satellite data (e.g. for automated debris-covered mapping), a strong overestimation of debris-covered glacier extents results for this region (Scherler and others, Reference Scherler, Wulf and Gorelick2018) and has to be corrected (Herreid and Pellicciotti, Reference Herreid and Pellicciotti2020). In addition, estimates of ice thickness (e.g. Farinotti and others, Reference Farinotti2019) and surface elevation change (e.g. Hugonnet and others, Reference Hugonnet2021) provide erroneous results in regions that are already located on bare rock or include pro-glacial lakes.
The new 2016 glacier inventory by Baumann and others (Reference Baumann2021) has resolved many of these issues, but for the rapidly responding glaciers in this maritime mountain region, nearly 40 years between two inventories are too long to resolve glacier fluctuations. For example, during this period Franz Josef Glacier advanced 920 m (between 1978 and 1999), but by 2016 had retreated 670 m behind its 1978 position (Purdie and others, Reference Purdie2014). Moreover, the direct comparison with the 1978/88 outlines is challenging as the methodology and interpretation rules differ, in parts to a considerable extent (cf. Eaves and Brook, Reference Eaves and Brook2020). For example, the digital 1978/88 inventory (a) included glaciers where likely no glacier has recently been (wrongly interpreted seasonal snow), (b) missed to include glaciers where they still exist today, (c) partly generalized extents roughly and (d) applied a different rule-set for the interpretation, e.g. regarding avalanche cones, perennial snowfields, debris-covered glaciers, etc. (cf. Baumann and others, Reference Baumann2021). Additionally, some incorrect mappings were made by transferring the analogue data (Chinn, Reference Chinn2001) into the digital database (Bolch and Chinn, Reference Bolch and Chinn2013).
According to Chinn (Reference Chinn2001), the original ‘1978’ inventory was derived from oblique aerial photographs taken in 1978 (South Island) and 1988 (North Island). However, the timestamp is 1978 for all of New Zealand in both GLIMS and the Randolph Glacier Inventory (RGI) (Bolch and Chinn, Reference Bolch and Chinn2013). Moreover, the RGI outlines have partly been updated, creating a mix of three undocumented time steps in one database (see Baumann and others, Reference Baumann2021 on quality discussion of inventories). Hence, apart from overall numbers of glaciers and areas, we do still not know how a larger sample of glaciers in New Zealand has changed over the past one or two decades.
A further motivation for this study was the call for data of the International Association of Cryospheric Science's (IACS) Working Group on the RGI to contribute to a new RGI version (RGI7) with the main goals to improve the quality of the existing RGI and to bring all glacier outlines closer to the year 2000. The latter is of particular interest to derive glacier elevation and henceforth mass changes from the geodetic method with the Shuttle Radar Topography Mission (SRTM) DEM as a base (e.g. Seehaus and others, Reference Seehaus2019; Sommer and others, Reference Sommer2020) or DEMs from the Advanced Spaceborne Thermal Emission and Reflection Radiometer (ASTER) or Satellite pour l'Observation de la Terre (SPOT) stereo data for subsequent calculation of elevation trends over different time periods (e.g. Brun and others, Reference Brun, Berthier, Wagnon, Kääb and Treichler2017; Dussaillant and others, Reference Dussaillant2019; Hugonnet and others, Reference Hugonnet2021). In response to this call for data, the main question was whether it is possible to create a glacier inventory for New Zealand from around the year 2000 with the available satellite data? Considering the small size of most glaciers in New Zealand (92% are <0.5 km2 in 2016) and the required accuracy to detect changes, only scenes without seasonal snow and the 15 m resolution from the Landsat-7 panchromatic band would provide good results.
In this study we present the results of this effort and focus on a description of the datasets used to create the year 2000 outlines, the decisions taken and methods applied, the results achieved and the challenges faced. In essence, we used the outlines from 2016 as a base and extended them to their – in general – larger year 2000 extents based on visual interpretation and manual delineation of Landsat-7 pan bands. In this process, and during independent manual checking of the outlines by the authors, we discovered some small interpretation differences for both the 2000 outlines and the 2016 inventory. We adjusted both datasets and recalculated statistics for 2016 (cf. Baumann and others, Reference Baumann2021) to obtain a correct glacier-by-glacier comparison.
2. Study region
Glaciers in New Zealand (see Fig. 1) extend from Mount Ruapehu in the central North Island (39° S) to the southern part of the South Island (Coronation Peak, 45° S). Slightly depending on the climatic classification scheme, the North Island has a subtropical and the South Island a mid-latitude climate. In any case, New Zealand has a maritime climate, with a mean annual temperature of 7.7–8.8°C in the central South Island (at 745 and 730 m a.s.l.; 1981–2010 climate at Aoraki/Mount Cook and Arthur's Pass weather stations). Precipitation is highly variable and very high in glacierized areas, especially on the western flank of the Southern Alps, reaching 14.4 m a−1 in the Cropp Valley (Henderson and Thompson, Reference Henderson and Thompson1999). Precipitation reduces rapidly southeast of the main drainage divide, and the ‘driest’ glaciers experience ~1.5 m a−1 of precipitation. Because of these high precipitation rates and close proximity to the ocean, frequent cloud cover provides additional protection from direct solar radiation.
Location of the study region New Zealand (inset, yellow box) and close up of the region with glaciers (light blue), scene footprints (white), acquisition dates (white boxes), location of figures (yellow) and some place names (light green). Dates in parentheses indicate scenes that have been used for local corrections. The white plus sign near the centre marks the geographic coordinates 172° E, 43° S. Background image: ESRI World Imagery, inset: MODIS Blue Marble.

The glaciers range in elevation from 420 to 3724 m a.s.l. with a mean elevation of 1953 m a.s.l. (Baumann and others, Reference Baumann2021), ~1000 m lower than that in the European Alps (Baumann and Winkler, Reference Baumann and Winkler2010). The Southern Alps have very steep slopes, which also present challenges for glacier mapping. For example, shadows in deep valleys and below mountain peaks make outlines hard to define (in particular when debris covered), and avalanche cones (from seasonal snow and dry calving) can be difficult to distinguish from regenerated glaciers or they might hide parts of a glacier's perimeter.
3. Datasets
3.1 Satellite images
Analyses of the Landsat-7 scenes from earthexplorer.usgs.gov revealed that two very good scenes (path–row 75-90/91) from 13.04.2000 are available for the South Island, but for the region to the west (76-91) the images have clouds and late seasonal snow. The outlines for these regions have thus been composed from several scenes (see Table 1) and come with a higher uncertainty. From the Landsat ETM+ scenes we only used the 15 m panchromatic band for the manual delineation and standard quick-looks from false colour composites provided by USGS for general ice and cloud identification.
Overview of the satellite images used

DoY, day of year.
Image no. 1 is located on the North Island; all others have been used for the South Island.
The glacier area on the North Island is restricted to the Mount Ruhapeu volcano that is covered by a single Landsat scene (path–row 73-87, no. 1 in Table 1). There are no clouds over the glacier area, but there is some seasonal snow over the northern slopes and some shadow on south-facing slopes. Scene no. 2 (74-89) was used for two small glacier remnants in the northern part of the South Island (Fig. 1). The northern part of the Southern Alps is covered by scene 75-90 and glaciers in direct sunlight were largely mapped from the scene acquired on 13.04.2000 (no. 3). This scene has likely one of the best snow conditions possible for this region, but suffered from extended regions in shadow due to the late acquisition date (Figs 2a, 3a). Such regions were corrected using scene no. 4 acquired on 14.02.2002 (Fig. 3b), which has much less shadow but some seasonal snow hiding glacier perimeters. Hence, for several of the related ice patches and small glaciers, extents might have been slightly overestimated in 2000.
Comparison of glacier mapping conditions in the north of Mount Aspiring National Park around the peaks Mount Castor and Mount Pollux (168.7464° E, 43.535° S). (a) The Landsat-7 scene from 13.4.2000 has been used for most of the mapping as it is free of seasonal snow below glaciers. However, it suffers from deep shadows and some seasonal snow at highest elevations. These regions were corrected using (b) the scene from 20.1.2002 which has no ice in shadow and snow-free mountain crests (but some seasonal snow at lower elevations). (c) The Sentinel-2 image from 12.4.2016 also suffers from seasonal snow, but ice in shadow is visible much better due to the better radiometric resolution. (d) Very high-resolution image (from the ESRI Basemap) that has likely been acquired in early April 2019 with very good mapping conditions (e.g. no seasonal snow at highest elevations). Image sources: panels (a) and (b): earthexplorer.usgs.gov, (c) Copernicus Sentinel data 2016, (d) ESRI World Imagery.

Deep shadows, clouds and seasonal snow are the major glacier mapping issues. (a) Glaciers in shadow where difficult to identify in the scene from April 2000 (no. 3 in Table 1) and have thus been mapped from (b) acquired on 14.2.2002. The region in panels (a) and (b) is located at the north-eastern end of the Arrowsmith Range with Jagged Peak at 43.332° S and 171.012° E (see Fig. 1). (c) For glaciers under cloud cover in the scene from 20.4.2000 (path–row 76-91) additional scenes had to be used. One example is shown in (d), a scene that was acquired on 20.1.2002 without clouds but seasonal snow remaining. The region in panels (c) and (d) is located in the west of the Barrier Range with Hedin Peak at 169.35° E and 44.507° S. Image source: earthexplorer.usgs.gov.

For the southern part of the Southern Alps we used scene 75-91 from 13.04.2000 (no. 5) to the extent possible, but had to use a partly snow-covered scene from 20.01.2002 (no. 6) for the western part (76-91), as the scene from 20.04.2000 (no. 7) was largely cloud covered (Fig. 3c). Scene no. 6 is cloud free and has a comparably small amount of seasonal snow despite its early acquisition date (Figs 2b, 3d). As the location of seasonal snow varied, we also used scenes nos. 8 and 9 (25.03.2002 and 22.03.2001) for interpretation of glacier extents in small parts of this region. It has to be noted, that ‒ despite the general shrinkage of glaciers until 2016 ‒ some small ice patches were smaller in 2000 than in 2016, mostly due to the less good snow conditions in 2016 (Fig. 2c) compared to scenes nos. 3 and 5.
Sentinel-2 scenes from 12.02. and 12.04.2016 (see Baumann and others, Reference Baumann2021) were used to improve interpretation of the panchromatic Landsat scenes and to check what has been mapped in 2016. The April scene was largely cloud free and the February scene suffered locally from convective clouds but was much better for interpretation of debris-covered regions that are already in shadow in the April scene. We also checked the snow-covered regions in 2016 against further Sentinel-2 scenes acquired on 17.04.2019. These scenes have deep shadows and first fresh snow at highest elevations for regions facing south. However, the glacier mass-balance year 2018/19 was very negative at Brewster and Rolleston Glaciers (WGMS, 2021) and resulted in the disappearance of nearly all perennial and seasonal snow, across the Southern Alps, leaving just the glacier ice behind (Fig. 2d).
3.2 Glacier outlines
The 2016 inventory (clean and debris-covered glaciers) was used as a base to create the year 2000 dataset. Additional glacier outlines (clean ice only) were created (see Section 4.1) from scenes nos. 3 and 4 (75-90) to aid in the interpretation. In particular, ice in shadow and dark bare ice on rock could be identified and reveal a minimum area covered by glaciers. Additional to the satellite scenes, also the RGI6 outlines (RGI consortium, 2017) were used to aid in the interpretation of year 2000 glacier extents. In many cases the former extents were much larger (wrong interpretation of seasonal snow aside) and allowed considering remnant snow/ice patches in the year 2000 scenes along with their possible maximum extent (i.e. the year 2000 extents should in general not be larger than in the RGI). This guidance was especially of importance for mostly small ice and snow patches that have already disappeared in the 2016 inventory.
3.3 Digital elevation model
The national elevation dataset for New Zealand was used to derive drainage divides between glaciers and topographic parameters for each glacier entity. The DEM has a 15 m resolution and was downloaded from koordinates.com (Columbus and others, Reference Columbus, Sirguey and Tenzer2011) in NZTM projection with NZGD2000 datum. The DEM was derived from topographic vector data and re-projected to UTM Zone 59S with WGS 1984 datum to match the projection of the Landsat and Sentinel-2 images. The spatial match is partly 1 or 2 pixels off in some regions as both satellites have each been orthorectified with different DEMs, both likely also having a resolution coarser than 15 m.
3.4 Very high-resolution images
The very high-resolution images available in Google Earth and the so-called ‘World imagery' layer of the ESRI Basemap (which can be included in a GIS as a web map service) have mainly been used to check debris-covered glacier parts and snow/ice avalanche cones in valley floors, as the visual interpretation of these landscape features from the Landsat and Sentinel-2 images was in several cases unclear. Although some of these features were indeed glacier parts or ice patches and remapped for 2000, others looked more like dead ice (dynamically separated from the glacier) or snow patches and were excluded in the mapping. It has to be noted, however, that despite the use of information from several sources, the interpretation is subjective and likely inconsistent.
4. Methods
4.1 Glacier outlines
As a first step, glacier outlines (clean ice and snow only) for the year 2000 were derived from scenes nos. 3 and 4 using the band ratio method (e.g. Paul and others, Reference Paul, Kääb, Maisch, Kellenberger and Haeberli2002). For scene no. 3 we divided the raw digital numbers of the panchromatic band by the shortwave infrared (SWIR) band that was resampled beforehand from 30 to 15 m using bilinear interpolation (Paul and others, Reference Paul, Winsvold, Kääb, Nagler and Schwaizer2016). Despite its extended spectral range (into the NIR) compared to the Landsat-8 pan band, this method worked also with the Landsat-7 pan band. The threshold applied to the band ratio image is 2.0. For scene nos. 1 and 4, the standard band ratio red/SWIR was used with a threshold of 1.8 and 2.2, respectively. Both binary glacier maps were filtered with a 3 × 3 majority filter to reduce noise (mostly in shadow) and to remove very small snow patches (i.e. just a few pixels in size). On the North Island, wrongly mapped areas that resulted from lighter coloured, welded volcanic pyroclastic rocks (Eaves and Brook, Reference Eaves and Brook2020) around the southern summit region were removed.
The year 2000 glacier outlines have then been created by expanding the year 2016 extents to their generally larger year 2000 extent by manual digitizing with the contrast enhanced Landsat ETM+ scenes (15 m pan band) described in Section 3.1 in the background. To distinguish glaciers from rock and clouds, false colour composites (ETM+ bands 5, 4, and 3 as RGB) were used for the southern region in the Southern Alps and the classified glacier maps in the northern part. Unfortunately, only Collection 1 Landsat scenes from USGS were available at the time of image processing and these often do not geometrically match the Sentinel-2 scenes used for the 2016 outlines (Kääb and others, Reference Kääb2016). For many smaller glaciers, the resulting hybrid outlines (visually averaged from the Landsat-7 and Sentinel-2 locations) might thus not match both sensors. In general, snow and ice patches were included when the 1978/88 extents indicated larger glaciers at this location, or when they still existed in 2016. For glaciers that did not visibly change from 2016 to 2000 (e.g. because of cloud or snow cover), the 2016 outlines were adopted in the 2000 inventory. Overall, our interpretation of glacier extents in 2000 is conservative and potentially underestimating total glacier area.
4.2 Ice divides
The 2016 inventory by Baumann and others (Reference Baumann2021) copied drainage divides from the GLIMS inventory to perform glacier-specific analysis. However, the topographic information available at that time was sometimes unreliable and resulted in unrealistic divides. Closer inspection revealed that such divides were frequent and needed to be checked and corrected. We have thus derived a flow-direction grid and drainage divides from the 15 m national DEM, removed wrong divides and manually re-digitized them following the boundaries of the flow direction grid (Fig. 4). For glaciers stretching along mountain flanks or some ice caps, the number of possible divisions between independent flow units can be high. We here decided to only apply the most obvious ones, partly following the bare rock visible in the 2019 images. Moreover, the former divides were used as a guide, i.e. we tried to keep the number of resulting entities about similar.
Correction of previous drainage divides (black) with new ones shown in green in (a) with a natural colour image (acquired by Sentinel-2 on 17.4.2019) in the background and in white in (b) with a colour-coded flow direction grid (representing the eight cardinal directions) in the background. The region is found to the north of the Solution Range (see Fig. 1) with Mount Hooker at 43.83° S and 169.67° E. Image source for panel (a): Copernicus Sentinel data 2019.

4.3 Topographic and meta-information
A set of standard topographic parameters (e.g. minimum, mean, median and maximum elevation, mean slope and aspect) has been derived from the DEM for each glacier using zone statistics (Paul and others, Reference Paul2009). The related values are listed for each glacier in the attribute table. To compare glacier-specific changes in size, minimum elevation or other parameters, we have also applied the new set of drainage divides to the 2016 dataset by Baumann and others (Reference Baumann2021). For this purpose, glaciers excluded in 2000 but mapped in 2016 have been removed from the sample to have comparable samples. Additionally, we added standard information such as first- and second-order GTN-G regions (according to GTN-G, 2017), name of the analyst, sensor information (path–row, date) and glacier area as calculated for UTM zone 59S with WGS84 datum (zone 60S for scene 73-87).
4.4 Area and other changes
Changes in glacier area are calculated from the respective values of both datasets (years 2000 and 2016). In the case of glacier disintegration, all 2016 parts within the respective year 2000 outline were summed up (area) or averaged (others). Hypsometry was calculated in 100 m bins from the DEM for both datasets and converted to absolute and relative changes for each interval.
4.5 Uncertainty
To determine the interpretation uncertainty, the manually digitized year 2000 outlines were independently checked by two of the co-authors (Anderson, Baumann) and ~60 deviations (partly on the level of individual pixels) were marked and discussed. Many of them were related to the interpretation of debris cover and very small snow/ice patches or nearly invisible regions in shadow. This independent quality control led to ~30 corrections in both datasets. To also determine the digitizing uncertainty of the analyst, 55 very small (<0.5 km2) glaciers were digitized independently a second time. The focus was on a region with glaciers that had to be digitized completely to be compliant with the multiple digitizing experiments that have been performed in earlier studies to determine uncertainty (e.g. Paul and others, Reference Paul2013; Baumann and others, Reference Baumann2021). However, for some larger glaciers only parts of the outline were re-digitized, probably resulting in a lower bound value for the derived uncertainty. We want to add that the maybe wrongly interpreted seasonal snowfields introduce much higher uncertainties in the derived glacier areas than the repeat digitizing. In particular for smaller glaciers (<0.1 km2) the related area uncertainties can be up to 50% or even larger (see examples in Leigh and others, Reference Leigh, Stokes, Carr, Evans, Andreassen and Evans2019).
5. Results
5.1 The ‘new’ year 2000 glacier inventory
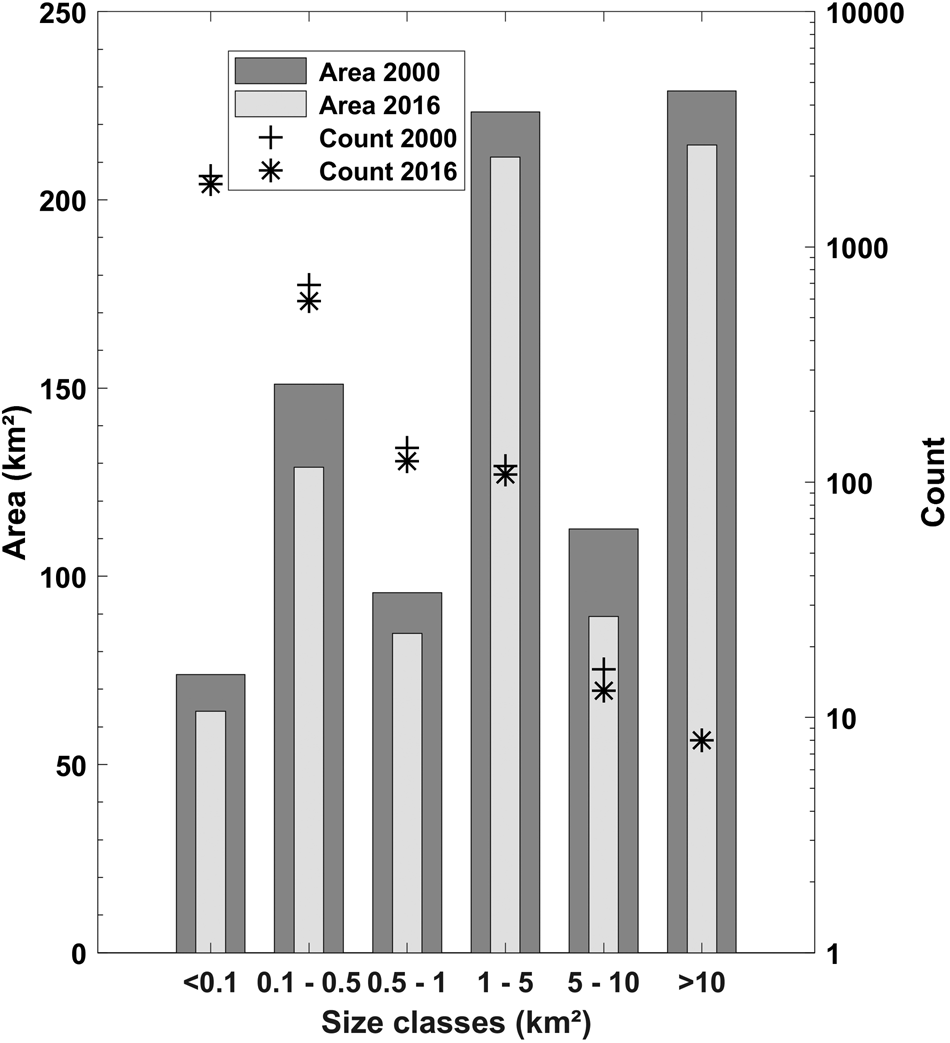
In Fig. 5 and Table 2 we present statistical data (glacier count and area covered per size class) of the new inventory and the slightly adjusted 2016 inventory. For the year 2000 we mapped 2967 glaciers larger than 0.01 km2 covering an area of 885.5 km2. Of these, 90.5% are smaller than 0.5 km2 (covering 25.4% of the area) and 0.8% are larger than 5 km2 (covering 38.6% of the area). In contrast to other regions, there is no linear increase of the glacier area towards larger size classes, as the 0.5–1 and 5–10 km2 classes appear to have a comparably low area and count (Table 2). We assume this is a consequence of the topography that results in glaciers of a certain size being located at higher elevations where the terrain is flatter.
Glacier area and count (note the different logarithmic scale for ‘Area’ and ‘Count’) in 2000 and 2016 per size class.
Statistical information about the glaciers for 2000 and 2016 and their distribution per size class

For both years glaciers have been counted independently.
Note: Glaciers in 2016 can be <0.01 km2.
The steep topography combined with the extreme climatic conditions (strong melt due to high temperatures at low elevations is balanced by abundant precipitation and/or thick debris cover) is likely responsible for the small number of larger glaciers, i.e. just 24 are larger than 5 km2 (compared to 69 in the European Alps according to Paul and others, Reference Paul2020). We acknowledge that many of the smaller entities might not be glaciers, but ice patches with very limited flow. We have nevertheless included them as they can still be considered as a water resource. Compared to 2016, the number of glaciers has decreased by 253 in the smallest two size classes whereas the 0.5–10 km2 class only lost 29 glaciers.
The mean glacier elevation in 2000 is 1900 m a.s.l., i.e. ~1000 m lower than in the European Alps (Baumann and Winkler, Reference Baumann and Winkler2010). This is surprising as the region is located at a lower latitude (43° S), similar to the Pyrenees in Europe. In the Pyrenees, mountains are about as high (up to 3400 m a.s.l.) as in New Zealand, but they contain only a few very small glaciers (González-Trueba and others, Reference González-Trueba, Moreno, Martínez de Pisón and Serrano2008).
5.2 Glacier area changes
The calculation of area changes per size class requires keeping the initial size class (from the year 2000) fixed. If a glacier fragmented into smaller parts by 2016, all parts belonging to the former glacier were summed up to obtain the corresponding area change in its original size class. The calculated area changes per size class as summarized in Table 3 do thus not include the glacier count for 2016. The area changes from 2000 to 2016 are visualized in Figs. 6 and 7. Overall, glaciers decreased in size by 92 km2 or by −10.4% (−0.65% a−1) to 793.2 km2 in 2016 (Table 3). Thereby, the area loss rates increase towards smaller glaciers (−1.6% a−1 for glaciers <0.1 km2), but they are about similar for glaciers >1 km2. Glaciers smaller than 0.5 km2 contribute nearly 43% to the total area loss despite making only 25% of the total area, whereas glaciers larger than 5 km2 contribute 14% to the loss but cover 38% of the total area. More specifically, glaciers in the size class 5–10 km2 shrank a bit more than in the 1–5 km2 size class. We assume this is due to the fact that the former might have advanced a bit more than the smaller glaciers, resulting in a slightly higher shrinkage rate after 2000. However, the difference is small and other factors might also be responsible. In total, 264 glaciers disappeared from 2000 to 2016 (covering 7.84 km2; all ⩽0.5 km2 and 98% <0.01 km2) and 32 shrank to a size smaller than 0.01 km2 (covering 0.29 km2 in 2016).
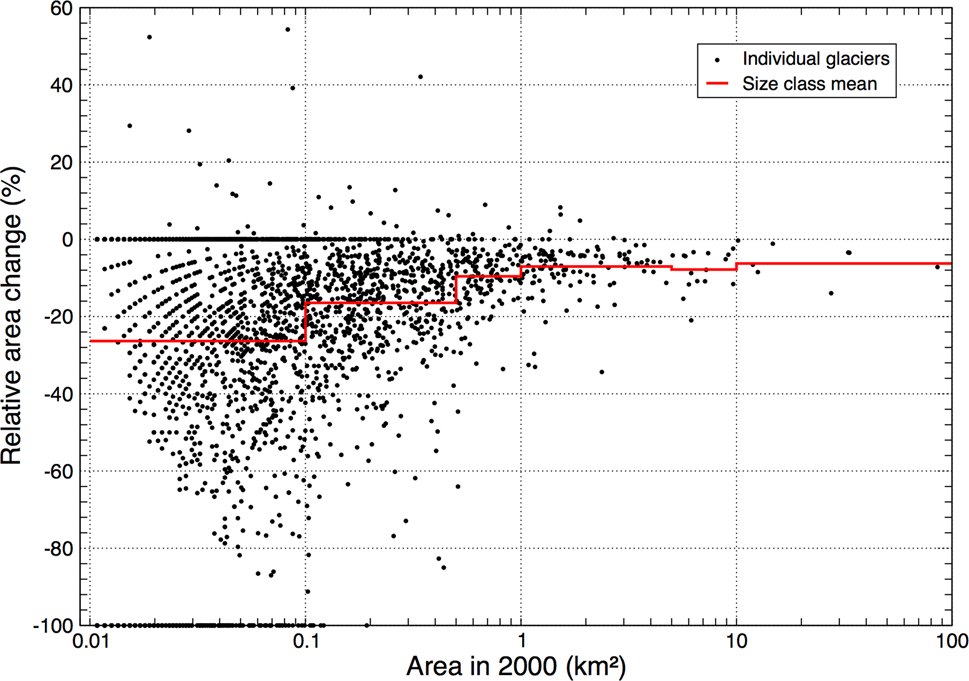
Relative area changes from 2000 to 2016 vs. glacier area in 2000 for individual glaciers and mean values per size class. Six outliers with area changes >60% are not shown.
(a) Glacier hypsometries in 2000 and 2016, and (b) absolute and relative area changes with elevation.

Statistical information about the glaciers for 2000 and 2016 and their changes per size class
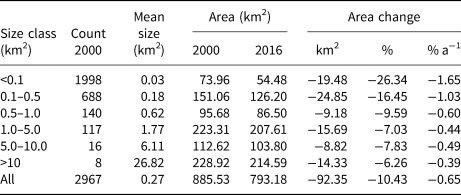
The size class here refers to the year 2000 extents, i.e. glaciers in the year 2000 are the basis for size class membership. The area values given for 2016 can also contain different glaciers than given by the size class. Mean size is the year 2000 area divided by glacier count.
The high variability in area changes for individual glacier is shown in Figure 6. Glaciers which completely disappeared (−100%) are mostly <0.1 km2 whereas glaciers that did not change at all (0%) are up to 10 km2 in size. For the glaciers >1 km2 this might be due to isolating debris cover, for those being smaller and located exactly on the 0% line, outlines have not been changed due to adverse mapping conditions. A few mostly small glaciers have obviously also grown, probably due to a larger amount of seasonal snow mapped in 2016. For small glaciers, this changes their size easily by 50% or more. Area change rates are about similar for glaciers >1 km2 and increase towards smaller glaciers. Also the scatter of values strongly increases, indicating that changes of such small glaciers are difficult to interpret in climatic terms.
The hypsometry plot in Figure 7a shows the maximum area coverage at 1900 m a.s.l. and limited glacier cover above 2500 m for both years. The partly extensively debris-covered tongues of several larger valley glaciers are reaching far down and create some extra area at elevations below 1500 m. In absolute terms, most of the area loss occurred at 1900 m, i.e. where most of the area is located (Fig. 7b). However, in relative terms the loss is strongest at the lowest elevations, below 800 m. The peak of relative area loss at 700 m is likely due to the retreat of larger debris-covered and lake-terminating glaciers to the southeast of the main divide (Carrivick and others, Reference Carrivick2022).
The outline overlay in Figure 8 also includes outlines from the 1978 inventory as available in the GLIMS database. The image shows the region around Franz Josef Glacier which has (together with the neighbouring Fox Glacier) detailed measurements of terminus fluctuations over the past few decades (Purdie and others, Reference Purdie2014). The records show for both glaciers a strong terminus retreat (by ~3 km) from 1940 to 1980, an advance until 2000 (~700 m for Fox and 1.3 km for Franz Josef), a retreat until 2005 with a re-advance until 2010 and a strong retreat afterwards (1 km for Fox, 1.5 km for Franz Josef). So for the three dates with outlines from 1978, 2000 and 2016 glacier extent should be at a minimum in 1978 and 2016 and at a maximum in 2000, 2016 being smaller than 1978. Although this agrees with the extents for Franz Josef, the 1978 and 2000 extents are nearly identical for Fox (not shown).
Glacier area changes for the region around Franz Josef Glacier from 1978 (yellow), to 2000 (pink) and 2016 (green). The Sentinel-2 satellite image shown in the background was acquired on 17.04.2019. Although Franz Josef Glacier advanced from the 1980s to 2000 and retreated afterwards behind its 1978 extent, the neighbouring Fritz and Almer glaciers show only minor change and Baumann Glacier basically wasted away. Due to debris cover, the tongue of Victoria Glacier might have been interpreted differently in 1978. Image source: Copernicus Sentinel data 2019.

Assuming that smaller glaciers have not been updated, Almer and Fritz glaciers show only minor changes in extent whereas Baumann Glacier revealed massive shrinkage until 2016 that continued, as an even smaller ice/snow patch is visible in the 2019 Sentinel-2 image shown in the background of Figure 8. Indeed, field observations showed that the glacier had entirely disappeared by March 2020. A ‘yellow only’ outline shows ‘glaciers’ that melted away before 2000 and missing red outlines indicate glaciers without a notable change until 2016. This wide range of change behaviour in such a small region indicate that local factors (e.g. hypsometry, shadow) exert a considerable control on glacier changes and a common response to climatic trends is difficult to extract.
5.3 Uncertainties
Figure 9 shows an example of the corrections that were performed after an independent check of the created outlines by two co-authors of this study. The yellow lines in the bluish circles mark the regions of change. These are most often related to some individual pixels only, so that the digitizing and interpretation uncertainties can be assumed to be very small (<1% of the area). The area of the 55 glaciers digitized twice was 3.1% smaller in the second round (outline overlay in Fig. 10a). The standard deviation of the relative area difference is 12.8% on average and increased towards smaller glaciers from 6.7% for 17 glaciers from 0.1 to 0.5 km2, to 10.4% for 9 glaciers from 0.05 to 0.1 km2 and 15.7% for the 31 glaciers <0.05 km2. The related scatterplot in Figure 10b is also revealing this trend. These numbers refer to glaciers with good (regarding snow conditions) to difficult (due to shadow) mapping conditions. When snow conditions are less good and clouds interfere the uncertainties are much higher.
Applied corrections (yellow, marked by circles) of the year 2000 outlines (red) for the region around the tongue of Franz Josef Glacier after independent review. Image: Landsat-7 panchromatic band acquired on 13.4.2000. Image source: earthexplorer.usgs.gov.

(a) Overlay of glacier outlines from the initial (cyan) and second (yellow) digitizing in a small sub-region of Landsat-7 scene 75-90 from 13.4.2000 (false colour image in the background). (b) Glacier area vs. relative area differences between the first and second digitizing. Image source for panel (a): earthexplorer.usgs.gov.

We have not included polygons that look like snowfields rather than glaciers, but digitized ‘glacier’ extents even if 100% of their area is snow covered. In most of these cases extents were somewhat larger in the 1978 dataset and some ice and/or snow remained at the same place in 2016. We acknowledge that the base is a subjective visual interpretation that is never fully consistent. The same is true for the delineation of debris-covered glacier tongues that might – due to a gradual transition – include ice-cored lateral moraines or dead ice. However, as for perennial snow patches that are now included or excluded, there is likely no 100% right or wrong interpretation.
6. Discussion
We have created a year-2000 glacier inventory from a more recent one referring to glacier extents in 2016. A main idea behind this approach was to have consistency between the two datasets so that change assessment can be performed for a larger sample of glaciers. Considering the observed glacier fluctuations in New Zealand, a further aim of creating an ‘old’ inventory was to have a glacier state in-between the existing inventories from 1978/88 and 2016. Finally, for many global scale applications (e.g. Scherler etal., Reference Scherler, Wulf and Gorelick2018; Farinotti and others, Reference Farinotti2019; Herreid and Pellicciotti, Reference Herreid and Pellicciotti2020; Hugonnet and others, Reference Hugonnet2021) it is important to have glacier extents that are in temporal agreement with the topographic information that is globally available for the year 2000 (DEMs from SRTM and ASTER). Despite facing some challenges related to differences in geolocation (between Sentinel-2 and Landsat-7), adjustment of drainage divides and homogenization of glacier interpretation among different analysts, our ‘back-dated’ new inventory fulfils these requirements. It is not strictly a year-2000 dataset as we also used satellite scenes from 2001 and 2002 to aid in the interpretation, but the related number of glaciers is small and we think for most glaciers a one or two-year extent change is barely visible, in particular when considering the interpretation uncertainties due to adverse snow, cloud or shadow conditions in many regions.
An interesting question is certainly whether or not the year 2000 inventory could have been created without the 2016 inventory? Although mapping conditions were very good in the mid-April 2000 scenes, accurate delineation of ice and snow in shadow would have been very difficult and related outlines would appear very rough or strongly generalized and come with a much higher uncertainty (see Figs 2a, 3a). This is even more the case for the scenes with clouds and seasonal snow (Fig. 3). Without the guidance of the 2016 outlines (and partly also those from 1978) nearly arbitrary outlines could have been digitized in many cases and often they were not changed to be on the safe side (points with zero change in Fig. 6). So, the answer to the above question is ‘no’.
Similarly, Carrivick and others (Reference Carrivick2022) stated that the overestimation of glacier area from 2019 in their Carrivick and others (Reference Carrivick, James, Grimes, Sutherland and Lorrey2020) study was due to wrongly mapped mid/late season snow that only was revealed with the 2016 dataset by Baumann and others (Reference Baumann2021). This reinterpretation reduced their 2019 area from 1021 km2 (28% larger than 2016) to 652.4 km2 (18% smaller than 2016), i.e. their former 2019 area estimate was ~56% larger than their second assessment. This also resulted in a related underestimation of area shrinkage since the Little Ice Age. Although we assume their new 2019 area is underestimated (it gives a −6% annual shrinkage rate since 2016), a 50% area difference is the order of magnitude to be expected when seasonal snow is wrongly mapped as glacier ice. Possible interpretation differences aside, this comparison also shows that creating an accurate glacier inventory in a challenging region such as New Zealand requires considerable work and expertise that can currently not be achieved from ‘fast’ automated glacier mapping approaches and/or machine learning.
Overall, our approach to map past (larger) glacier extents by extending outlines from an accurate more recent inventory (with smaller glaciers) can be recommended when mapping conditions are as difficult for the available images as here (e.g. deep shadow, seasonal snow, clouds, debris cover, tiny glaciers). Although the workload is high when cross-checking a large number of images for each glacier, applying and correcting results from a fresh automated mapping would have been more cumbersome in this case and the partly poor spatial match would have been much more difficult to adjust (in particular in accumulation regions). When good satellite images are around, we recommend using them for the initial glacier mapping and correct missing parts (e.g. debris cover) afterwards. Ultimately, the analyst has to decide which is the best and fastest way to create a new inventory for a region.
By applying our approach, we can thus present for the first time a reliable overall assessment of glacier area changes for nearly 3000 glaciers in New Zealand over the 2000–2016 period. The calculated area change rate of −0.65% a−1 over a 16 year period is about half as negative as for the European Alps (Paul and others, Reference Paul2020), but higher than for other maritime regions such as in parts of northern Norway (Stokes and others, Reference Stokes, Andreassen, Champion and Corner2018) or Patagonia (Paul and Mölg, Reference Paul and Mölg2014). Due to abundant seasonal snow in this maritime region we could not adjust the extents of all glaciers and used their 2016 extents instead. Hence, the calculated area loss is likely a lower bound value. Moreover, a different interpretation of the often down-wasting debris-covered glacier tongues (e.g. as dead ice in 2016) could change the calculated areas for 2016, as large glacier areas (several square kilometres) are often concerned. Comparing the (size-dependent) area changes with the uncertainties of the digitizing, one can conclude that the former are twice as high as the standard deviation of the multiple digitizing and that they can thus be considered significant. However, for the very small glaciers surrounded by seasonal snow (mostly located in scene 76-91), this is likely not the case and the related outlines and results need to be interpreted with care. On the contrary, the comparison with satellite images from 2019 revealed that glacier shrinkage in New Zealand is on-going and might have reached new record highs (Vargo and others, Reference Vargo2020).
As the majority of glaciers in New Zealand have a very small area, precise mapping with 30 m Landsat™ imagery is hard to achieve at the required quality. Existing larger scale studies are based on very high-resolution aerial imagery (Chinn, Reference Chinn2001), 15 m ASTER (Gjermundsen and others, Reference Gjermundsen2011) or 10 m Sentinel-2 data (Carrivick and others, Reference Carrivick, James, Grimes, Sutherland and Lorrey2020; Baumann and others, Reference Baumann2021). We have used the 15 m panchromatic band of Landsat-7 for delineating glacier extents despite the challenges in interpreting grey-scale images. In effect, switching back and forth between the available images (including true and false colour composites) and back-checking with very high-resolution images was required to achieve the best results. In particular for the southern region on the South Island (path–row 76-91) outlines can certainly be further improved as clouds and seasonal snow impacted on the interpretation.
However, which parts of a glacier should be considered (e.g. ice in lateral moraines?) and which not (lateral avalanche cones?) is more a question of the rule-set applied to create the dataset and partly also related to the spatial resolution of the sensor rather than a wrong interpretation. Different analysts might thus digitize different glacier outlines and all of them can be ‘correct’ according to their rules applied. The year-2000 extensions were created by one author, so that there should be some consistency in the interpretation. However, as for all manual delineations of glacier extents, one can expect an average area uncertainty of ~5% for the glaciers in this region, higher towards glaciers <1 km2 (see Fig. 10b) and lower towards larger glaciers (e.g. Paul and others, Reference Paul2013; Pfeffer and others, Reference Pfeffer2014).
7. Conclusions
We presented a 'new' glacier inventory for New Zealand that has been manually digitized from Landsat ETM+ images (15 m pan band) mostly acquired in the year 2000. We used a recent inventory derived by Baumann and others (Reference Baumann2021) from 10 m resolution Sentinel-2 images acquired in 2016 as a starting point and extended the outlines to the generally larger extents in 2000 with the ETM+ images in the background. Considering the partly difficult glacier mapping conditions of the available satellite images for 2000 (e.g. due to seasonal snow, clouds, shadow), we conclude this approach was the only possible way creating high-quality results. It allowed us for the first time to perform a spatially consistent change assessment for all glaciers in New Zealand (~3000), revealing an overall annual change rate of −0.65% a−1. This is about half of what has been reported from the European Alps over a similar period, but is higher than in other maritime regions. The strongest area loss is found at the elevation where most of the ice is located (~1900 m), but strong shrinkage of debris-covered tongues at low elevations also contributed. The size class distribution is a bit different than in other regions of the world, but also here a small number of larger glaciers (4.5% >1 km2) make up a large part of the area (65%). They also contribute strongly (42%) to the overall area loss and have high annual change rates (−0.4 to −0.5% a−1).
In the south-western part of New Zealand (covered by Landsat scene 76-91) satellite scenes from ~2000 are impacted by late seasonal snow, early new snow, clouds or deep shadow, resulting in some guess-work where glacier boundaries might be located. The quality of the outlines in this region is thus lower than elsewhere. The glacier-by-glacier extension also revealed small issues with the 2016 dataset, e.g. missing glaciers and a required reinterpretation of snow patches, avalanche cones and debris-covered glaciers. We have harmonized our interpretation to some extent, but admit that different views are still possible. Some glaciers have also changed extent due to a change of ice divide locations, which we have considered for the change assessment by reprocessing the 2016 dataset with the new divides. The workload for creating this new inventory was high but likely worthwhile; so we hope it will serve the community for all of their intended applications.
Acknowledgements
The work of F.P. and P.R. was funded by the ESA project Glaciers_cci (4000127593/19/I-NB) and the Copernicus Climate Change Service (C3S) that is implemented by the European Centre for Medium-Range Weather Forecasts (ECMWF) on behalf of the European Commission. S.B. and B.A. want to thank Trevor Chinn, who passed away in 2018, for his excellent discussions on glacier inventories. We thank Shaun Eaves for his help with the outline interpretation for the North Island and the two reviewers for their constructive comments.
Author contributions
F.P. designed the study, wrote a first version of the paper, digitized the year 2000 outlines for the South Island, corrected the drainage divides and prepared some of the figures. S.B. performed the outline digitization for the North Island, calculated area totals and changes and created several of the figures. B.A. performed the quality check for all outlines. P.R. performed DEM and GIS-related calculations. All authors contributed to data analysis, writing and editing of the paper.
Conflict of interest
The authors declare no conflict of interest.
Data
The year 2000 glacier inventory for New Zealand presented here is available from the GLIMS glacier database.


 Open access