

Lipid emulsions are used in parenteral nutrition (PN) as a source of energy and of essential fatty acids. Lipids also act as the main component of cell membranes, precursors of eicosanoids, metabolic regulators and immune response modulatorsReference Waizberg, Torrinhas and Jacintho1, Reference Wanten2. Their use in PN has been associated with a higher complication rate compared with PN without a lipid emulsionReference Heyland, MacDonald, Keefe and Drover3, Reference Heyland, Dhaliwal, Drover, Gramlich and Dodek4. However, intravenous lipid emulsions are not contraindicated in current PN recommendations and now are considered standard practiceReference Waizberg, Torrinhas and Jacintho1, 5, Reference Mirtallo, Canada, Johnson, Kumpf, Petersen, Sacks, Seres and Guenter6. The first marketed emulsions were soyabean oil-based emulsions and they are still widely used. These emulsions have a high content of linoleic acid, the main fatty acid of the n-6 PUFA family. This family is believed to interfere with immune function through several mechanisms, such by being precursors of pro-inflammatory eicosanoids, inhibitors of lymphocyte and macrophage functions, and impairing reticuloendothelial functionsReference Waizberg, Torrinhas and Jacintho1, Reference Wanten2, Reference Waitzberg7. Recently, a soyabean oil-based emulsion given as a single dose of 500 ml has been shown to decrease human lymphocyte proliferation and promote lymphocyte and neutrophil deathReference Cury-Boaventura, Gorjao, de Lima, Piva, Peres, Soriano and Curi8. Alterations in the phospholipid fatty acid profile and eicosanoid synthesis have also been seen with lower intakes of soyabean oil-based emulsion in stressed patientsReference Waitzberg, Bellinati-Pires, Salgado, Hypolito, Colleto, Yagi, Yamamuro, Gama-Rodrigues and Pinotti9–Reference Meyer, Fegbeutel, Hattar, Sibelius, Krämer, Heuer, Temmesfeld-Wollbrück, Gokorsch, Grimminger and Seeger11. Therefore, it has been suggested that these emulsions may increase the patient's susceptibility to septic complications, although this point still remains controversial and further evidence is neededReference Wanten2. In recent years, several lipid emulsions have been developed with the aim to decrease the n-6 PUFA content from the classical soyabean oil-based emulsions in order to less negatively influence immune function. These emulsions include different amounts of medium-chain TAG, olive oil, and/or fish oilReference Waizberg, Torrinhas and Jacintho1, Reference Wanten2, Reference Waitzberg7, Reference Grimble12. Specifically, olive oil-based emulsions have been shown to be safe as part of PNReference Waizberg, Torrinhas and Jacintho1. These emulsions contain a high proportion of oleic acid, a MUFA, that is generally considered to have a neutral effect on immune functionReference Waizberg, Torrinhas and Jacintho1, Reference Wanten2. Most studies comparing soyabean oil-based emulsions with these newer emulsions have been performed using in vitro or ex vivo models. However, few studies have compared the effects of these emulsions on clinical outcomes. The need for clinical studies of olive oil-based emulsions has been highlightedReference Wanten2.
Considering that an olive oil-based emulsion with a high content of oleic acid could interfere less with immune function than a soyabean oil-based emulsion with a high content in linoleic acid, we compared the effects of these two emulsions on infection rate, appearance of new infection episodes, leucocyte count and leucocyte count evolution in critically ill patients receiving PN. Second, we compared the effect of these two emulsions on some acute-phase proteins and other health outcomes.
Subjects and methods
Study design and patients
This was an observational, retrospective, single-centre, two-cohort study performed at Hospital del Mar, a 450-bed university hospital, in Barcelona, Spain. Patients included were adults ( ≥ 18 years old), admitted to a general intensive care unit (ICU) who required PN for a minimum of 5 d during their ICU stay. Patients excluded were those on active treatment with immunosuppressive or antineoplastic drugs, or with several PN courses during their ICU stay. A pre-existing infection or being treated with antibiotics at the beginning of PN was not considered an exclusion criterion. The hospital ethical committee approved the study.
Patients were selected according to our ICU activity.
Period of study
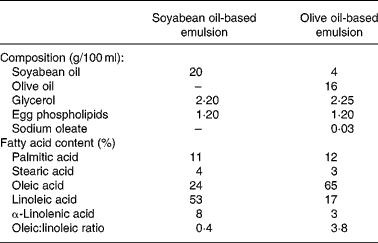
Consecutive patients starting PN support from 20 May to 30 August 2002 were included in the first cohort (SOYA cohort) and consecutive patients starting PN support from 1 September to 31 December 2002 were included in the second cohort (OLIVE cohort). Patients in the SOYA cohort received a soyabean oil-based emulsion (Intralipid 20 %; Fresenius Kabi España, Barcelona, Spain) and patients in the OLIVE cohort received an olive oil-based emulsion (ClinOleic 20 %; Baxter, Valencia, Spain) as part of their PN. Composition of both emulsions is shown in Table 1.
Composition of lipid emulsions used in the study
Parenteral nutrition
PN was administered as ‘all-in-one’ admixtures prepared daily following usual hospital practices. All admixtures were delivered through central catheters in a 24 h infusion. All patients received the same amino acid solution (Aminoplasmal L; Braun Medical, Rubi, Spain), and the same amounts of vitamins (Cernevit; Baxter, Valencia, Spain) and trace elements (Addamel; Fresenius Kabi España, Barcelona, Spain).
The PN support was aimed to administer both a total energy load at least equal to that calculated by the Harris–Benedict equation for BMR and to a maximum of 1.5 times this value and at least 1 g protein/kg per d (0·16 g N/kg per d). Lipid emulsions were administered from the first day of PN to provide an amount of 1 g fat/kg per d when serum TAG levels were < 2 g/l, 0·75 g/kg per d when serum TAG levels were between 2 and 3 g/l or 0·5 g/kg per d when serum TAG levels were between >3 and 4 g/l. Lipid emulsion was withdrawn from PN when serum TAG levels reached >4 g/l. During the anabolic phase, a maximum dose of 1·5 g fat/kg per d could be administered if serum TAG levels remained < 2 g/l. Glucose was the only carbohydrate used. Doses were 3–5 g/kg per d to provide between 60 and 70 % of the PN non-protein energy supply. The amount of glucose was reduced and/or insulin dosage was increased in case of hyperglycaemia (>11 g/l). Electrolytes (Na, K, Mg, Ca, phosphate and Cl) were administered according to patients' needs.
Additionally, some patients received external energy sources concomitant to PN. These sources included: glucose as part of glucose solutions used to dilute and administer intravenous drugs; lipids as a vehicle in propofol emulsion, an intravenous sedative drug formulated in a 10 % (w/v) soyabean oil-based emulsion (Recofol 2 %; Schering España, Madrid, Spain); enteral nutrition in patients transitioning from PN to total enteral nutrition. Energy from these external sources was obtained from pharmacy records and taken into account when calculating the total amount of energy received by each patient.
Biochemical and biological markers
Patients were monitored on a regular basis for blood biochemical parameters including glycaemia, urea, creatinine, total bilirubin, alkaline phosphatase, alanine aminotransferase, γ-glutamyl transpeptidase, total proteins, albumin, fibrinogen, total cholesterol, serum TAG and Hb. Erythrocyte and platelet counts were also monitored regularly. Blood Na, K, Ca, Mg and phosphate were also monitored, but were not considered for the study.
Infection and microbiological cultures
Septic episodes were recorded and biological samples collected for microbiological culture. Septic episodes were considered when two or more of the following manifestations were present: body temperature >38°C or < 36°C, heart rate >90 beats/min, tachypnea with >20 breaths/min or hypoventilation with PaCO2 < 32 mmHg, and abnormal leucocyte count (>11 × 109 cells/l or < 4 × 10⁹ cells/l).
Microbiological cultures were considered positive when one or more micro-organisms were isolated from biological samples obtained from a suspected focus of infection in patients who presented signs and symptoms of infection, and underwent antibiotic therapy to treat it. Microbiological cultures were considered negative when no micro-organisms were isolated from samples or when one or more micro-organisms were isolated from samples obtained from patients who did not present signs and symptoms of infection and were not treated with antibiotic agents. Bacteria studied were all aerobic and anaerobic gram-positive and gram-negative micro-organisms isolated in positive cultures. Fungi and yeast were also included when isolated. Samples for microbiological cultures were obtained from: the bloodstream; the respiratory tract by bronchoalveolar lavage or protected specimen brush; the urinary tract; wounds; catheters, skin and soft tissue; and other sources.
A patient with positive cultures was considered when he or she had at least one positive culture during his or her PN course. The number of positive cultures per patient was also recorded. Due to different lengths of PN courses, incidence rate was calculated as the number of positive microbiological cultures/patient per PN d. Infectious or septic episodes were treated according to pre-existing hospital-approved infection-treatment protocols for ICU patients.
Leucocyte monitoring
Peripheral blood leucocyte counts were monitored daily. Peak leucocyte counts have been associated highly with infectionReference Bossink, Groeneveld, Hack and Thijs13 and were used as an indicator of response to infection. Peak leucocyte count was studied in the period from day 5 after beginning PN support until the end of it. The first 5 d of PN were considered the period in which fatty acids from the PN oil emulsions were incorporated into leucocyte membranes. Three analyses were performed for this variable: a PN before-and-after comparison, a count-evolution comparison between cohorts, and peak comparisons between cohorts.
Acute-phase proteins and inflammation markers
As markers of response to inflammation, three plasma protein concentrations were recorded: albumin, fibrinogen and C-reactive protein.
Other health outcomes
Length of ICU and hospital stay and crude mortality rate were recorded.
Sub-analysis of patients with and without pre-existing infection
In an additional sub-analysis, patients with and without pre-existing infection at the beginning of the PN course were analysed separately to assess the effect of this pre-existing condition in the results obtained.
Statistical analysis
Values for all blood parameters were considered valid when obtained during the PN course. Data are presented as mean values and standard deviations. Continuous variables were tested for normality using the one-sample Kolmogorov–Smirnov test. Parametric quantitative variables were studied using the independent-sample Student's t test with the Levene's test for equality of variance or the paired-sample Student's t test, when appropriate. Non-parametric quantitative variables were studied using the Mann–Whitney U test. Measurements of the same variable were compared using repeated-measures ANOVA. Categorical variables were compared using the χ2 test and Fisher's exact test. Survival analysis was performed using Kaplan–Meier survival curves compared through the log-rank test. All tests were performed two-sided and statistical significance was considered when P < 0·05. Statistical tests were carried out using SPSS for Windows, version 12.0 (SPSS Inc., Chicago, IL, USA).
Results
Patients
A total of forty-two patients received PN during their ICU stay; sixteen entered the SOYA cohort and twenty-three entered the OLIVE cohort during the study period. Three patients were excluded from the study: two received PN with the olive oil-based emulsion for less than 5 d and one received several PN courses with the soyabean oil-based emulsion.
Most patients were male (n 28; 72 %), non-obese (BMI 24·3 (sem 0·52) kg/m2), and with moderately severe illness (Mortality Prediction Model II score of − 1·6415 (sem 0·1700)). Mean age was approximately 60 years. The main reason for admittance was surgical intervention (n 24; 62 %). The mean calculated BMR was 5978 (sem 148) kJ/d. Patients were admitted to the ICU about 5 d before the beginning of the PN course. A high proportion of patients (n 30; 77 %) had required mechanical ventilation. Characteristics at the beginning of the PN course were not statistically different between groups and are shown in detail in Table 2. Main blood chemical analysis at the beginning of PN showed that patients had severe hypoalbuminaemia (albumin 23·5 (sem 0·8) g/l), normal serum TAG levels (1·42 (sem 0·13) mmol/l) and an acceptable renal function (calculated glomerular filtration rate 68·4 (sem 5·9) ml/min per 1·73 m2). Parameters such as creatinine, urea, alkaline phosphatase, total bilirubin, γ-glutamyl transpeptidase, total cholesterol, Hb, erythrocyte counts and platelet counts were similar in both cohorts (data not shown). At the beginning of PN, patients had a mild leucocytosis (12·16 (sem 1·13) × 109 cells/l) and neutrophilia (10·75 (sem 1·07) × 109 cells/l). Initial leucocyte counts are detailed in Table 2.
(Mean values with their standard errors)
SOYA, soyabean oil-based emulsion; OLIVE, olive oil-based emulsion; ICU, intensive care unit.
* Harris–Benedict formula.
† Values of C-reactive protein were only available for five (31 %) patients in the SOYA cohort and eight (35 %) in the OLIVE cohort.
Parenteral nutrition
All patients received similar energy and protein supplies, 1·22 (sem 0·05) g protein/kg per d, 3·64 (sem 0·14) g glucose/kg per d, and 0·88 (sem 0·03) g lipid/kg per d, equivalent to a total energy intake of 118 (sem 4) kJ/kg per d, which corresponded to a total energy received:BMR ratio of 1·34 (sem 0·03). Most patients (n 27; 69 %) received other external energy sources concomitant to PN (glucose solutions, propofol emulsion, enteral nutrition). These sources only represented 13 (sem 3) kJ/kg per d or 11 % of the total energy received during the PN course. Patients in the OLIVE cohort received about 2·5-fold less linoleic acid and 2·5-fold more oleic acid than patients in the SOYA cohort. Nutritional intake in both cohorts is shown in Table 3.
(Mean values with their standard errors)
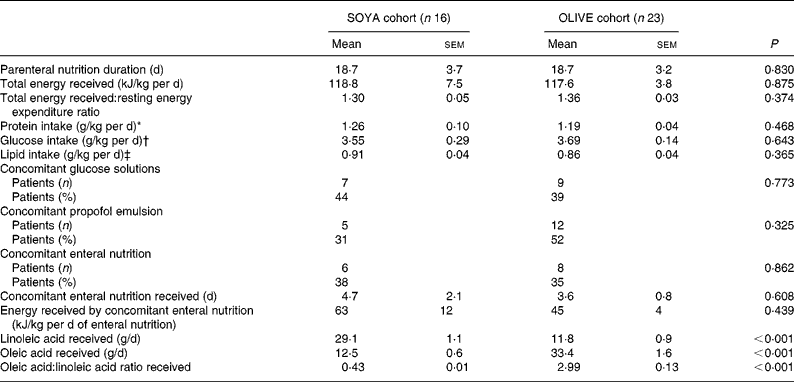
SOYA, soyabean oil-based emulsion; OLIVE, olive oil-based emulsion.
* Considering protein from parenteral nutrition and additional protein intake in patients who received enteral nutrition.
† Considering glucose from total parenteral nutrition and additional glucose intake in patients who received enteral nutrition and/or intravenous glucose solutions.
‡ Considering lipids from total parenteral nutrition and additional lipid intake in patients who received enteral nutrition and/or propofol emulsion.
Infection and microbiological cultures
At the beginning of the PN course, nine (56 %) patients in the SOYA cohort and thirteen (57 %) in the OLIVE cohort presented infectious processes (P = 1). Characteristics of these infections are shown in Table 4.
(Subjects and percentages)
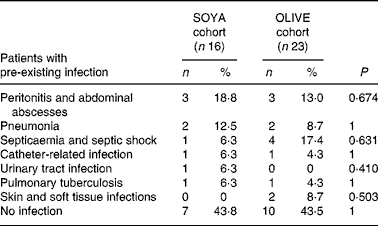
SOYA, soyabean oil-based emulsion; OLIVE, olive oil-based emulsion.
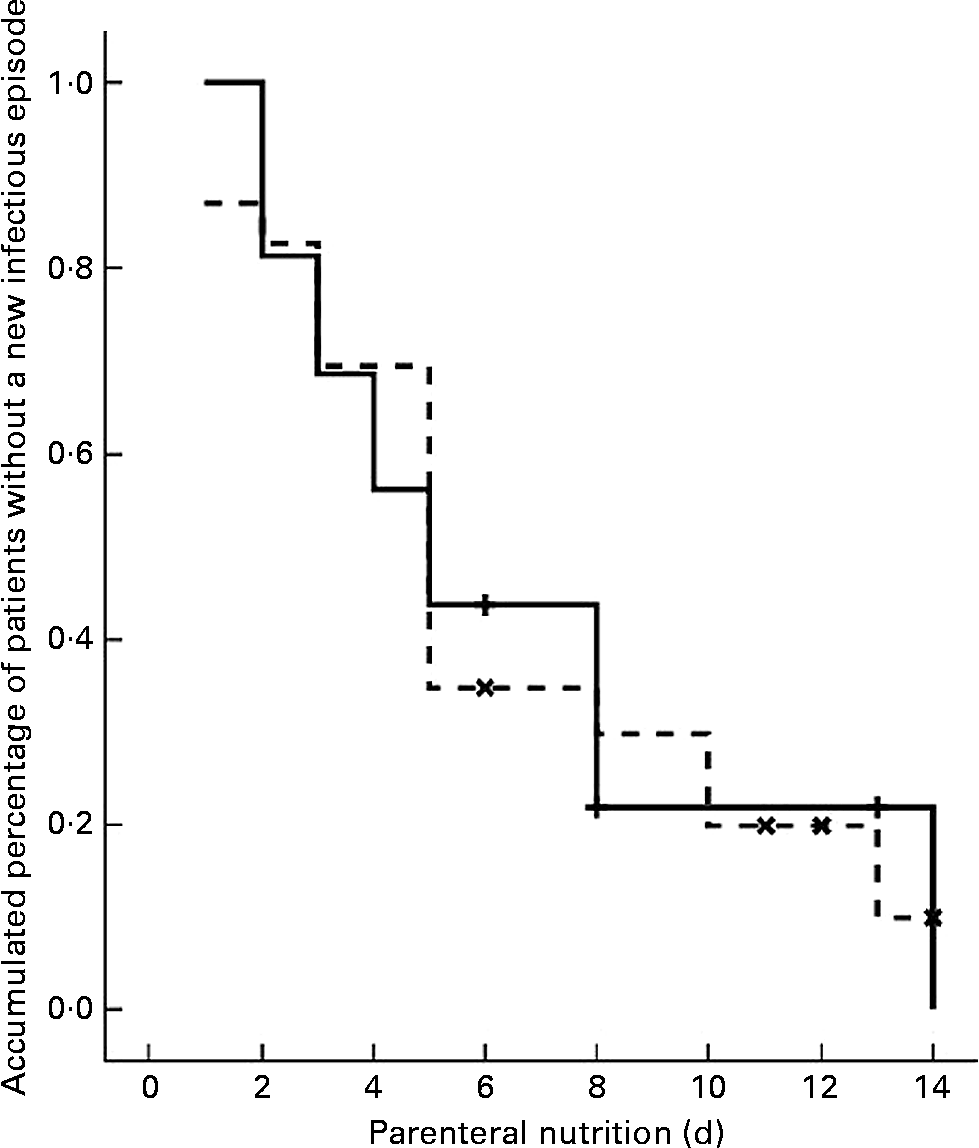
Eighteen patients had at least one septic episode during the PN course; eight (50 %) in the SOYA cohort and ten (43·5 %) in the OLIVE cohort (P = 0·688). Samples for microbiological cultures were obtained in thirty-seven patients (95 %). From these thirty-seven patients, thirty-two (86 %) had at least one positive culture; thirteen (81 %) in the SOYA group and nineteen (83 %) in the OLIVE group (P = 1). These positive cultures were considered as indicators of new infectious episodes. A first new episode appeared during the first 14 d of PN in all cases. A Kaplan–Meier curve with these data is depicted in Fig. 1. No differences between cohorts were detected (P = 0·936).
Kaplan–Meier curve for a first new infectious episode during parenteral nutrition in soyabean oil-based emulsion (SOYA; ![]() ) and olive oil-based emulsion (OLIVE;
) and olive oil-based emulsion (OLIVE; ![]() ) cohorts. The plots show the patients (%) who remained free from new infectious episodes for each cohort during the first 14 d of parenteral nutrition. The difference between the cohorts was not significant (P = 0.936; log-rank test). (
) cohorts. The plots show the patients (%) who remained free from new infectious episodes for each cohort during the first 14 d of parenteral nutrition. The difference between the cohorts was not significant (P = 0.936; log-rank test). (![]() ), SOYA cohort censored; (
), SOYA cohort censored; (![]() ), OLIVE cohort censored.
), OLIVE cohort censored.
Patients classified by the origin of the cultured sample and the microbiological result (positive or negative) were not different between cohorts. Most cultures were from the bloodstream, catheter, skin and soft tissue, and respiratory tract samples. They were performed in fourteen (93 %), fourteen (93 %) and twelve (80 %) patients in the SOYA cohort and nineteen (86 %), sixteen (73 %) and seventeen (77 %) patients in the OLIVE cohort, respectively (P = 1·000; P = 0·262; P = 1·000). From them, positive cultures were present in seven (50 %), ten (71 %) and eight (67 %) patients in the SOYA cohort and eleven (58 %), eleven (69 %) and fourteen (82 %) patients in the OLIVE cohort, respectively (P = 0·653; P = 0·403; P = 1·000). The rest of the patients classified by the origin of the cultured sample and the microbiological result were also not statistically different between cohorts.
The SOYA cohort had 6·6 (sem 1·9) and the OLIVE cohort 6·2 (sem 1·4) positive cultures/patient (P = 0·857). When analysed by incidence rate, the groups did not differ. The SOYA group had 0·29 (sem 0·05) positive cultures/patient per PN d and the OLIVE group had 0·30 (sem 0·05) positive cultures/patient per PN d (P = 0·922).
The isolated micro-organisms were distributed as follows: SOYA group, gram-negatives nine (37·5 %), gram-positives ten (41·7 %), anaerobes two (7·4 %) and yeasts three (12·5 %) v. OLIVE group, gram-negatives thirteen (34·2 %), gram-positives thirteen (34·2 %), anaerobes three (7·9 %) and yeasts nine (23·7 %) (P = 0·748).
Leucocyte monitoring
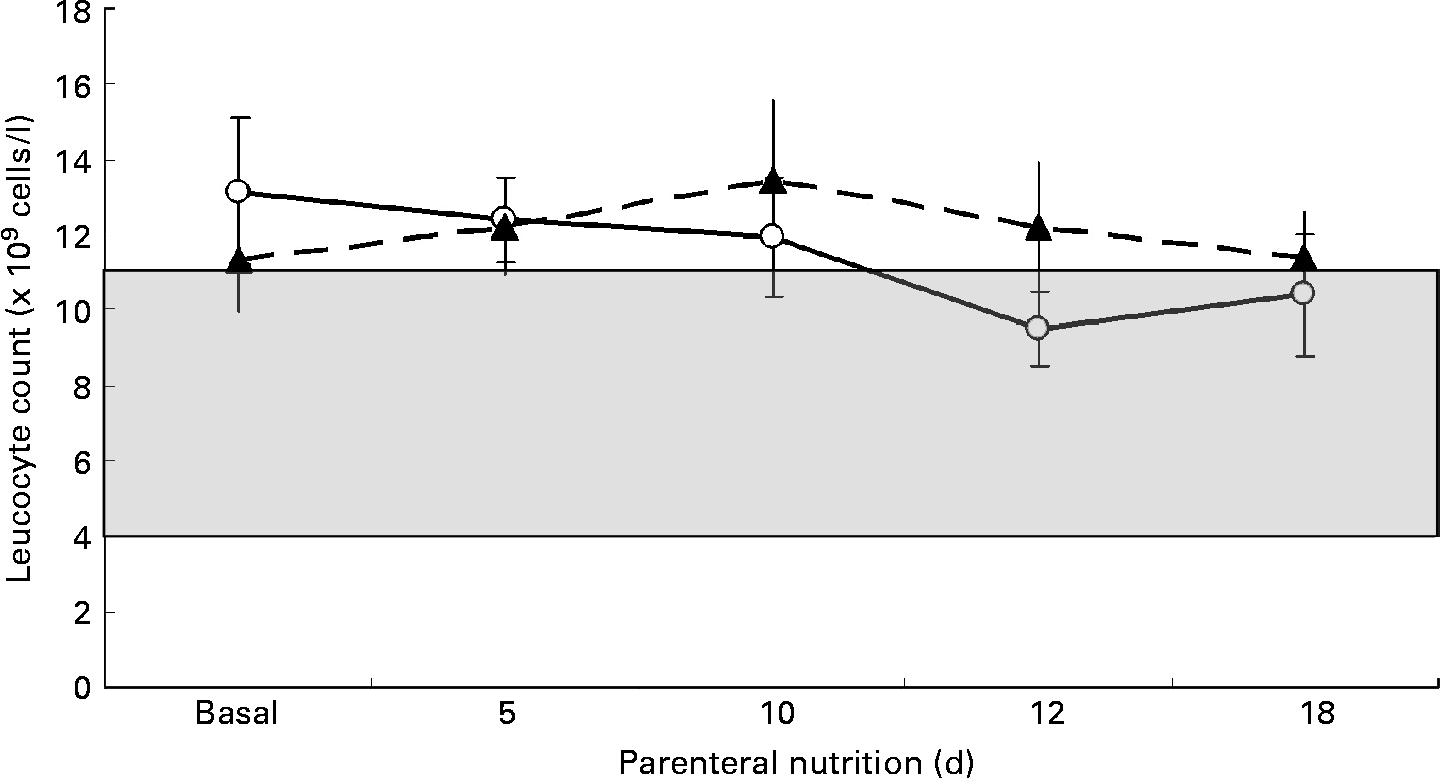
Patients were compared for leucocyte count before v. after the PN course. Mean initial and final leucocyte counts in the SOYA cohort were 13·14 (sem 1·96) × 109 cells/l and 9·98 (sem 1·09) × 109 cells/l, respectively (P = 0·222). Mean initial and final leucocyte counts in the OLIVE cohort were 11·32 (sem 1·38) × 109 cells/l and 15·83 (sem 2·51) × 109 cells/l, respectively (P = 0·077). The leucocyte count evolution between cohorts resulted in no differences on days 5, 10, 12 and 18 of the PN course. These results are presented in Fig. 2. Leucocyte count decreased by 3·25 (sem 2·48) × 109 cells/l in the SOYA cohort and increased by 4·51 (sem 2·43) × 109 cells/l in the OLIVE cohort (P = 0·036) from baseline to the end of the PN course. No differences were detected in the intermediate days (data not shown). When performing a repeated-measures ANOVA analysis on the leucocyte counts through time, leucocyte counts did not change considering as the within-subjects factor the day of the measure (P = 0·124) or additionally considering as the between-subjects factor the type of emulsion administered (P = 0·121).
Comparison of leucocyte counts between the soyabean oil-based emulsion (SOYA; –○–) cohort and the olive oil-based emulsion (OLIVE; –▲–) cohort during parenteral nutrition on days 0, 5, 10, 12 and 18. Data are expressed as leucocyte concentration ( × 109 cells/l). Values are means, with their standard errors represented by vertical bars. The difference between cohorts was not significant at any point. (![]() ), Leucocyte concentration in the normal range (4–11 × 109 cells/l).
), Leucocyte concentration in the normal range (4–11 × 109 cells/l).
The OLIVE cohort had a trend to a higher peak of leucocyte count when compared with the SOYA cohort, as shown in Table 5. This peak in the OLIVE cohort was 23 % higher than in the SOYA cohort, but not at the expense of a certain leucocyte type.
(Mean values with their standard errors)
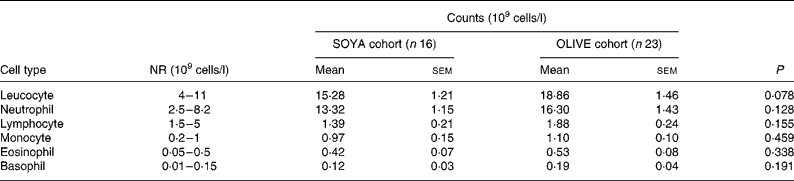
SOYA, soyabean oil-based emulsion; OLIVE, olive oil-based emulsion; NR, normal range.
Acute-phase proteins and inflammation markers
Initial albumin was not different between cohorts. Patients remained hypoalbuminaemic at the end of PN, but no differences were observed between cohorts (SOYA cohort 24·2 (sem 1·6) g/l and OLIVE cohort 24·8 (sem 1·3) g/l; P = 0·758). Initial fibrinogen was comparable in both cohorts, but it showed a trend to higher levels in the OLIVE cohort at the end of PN (SOYA cohort 4·72 (sem 0·29) g/l and OLIVE cohort 5·62 (sem 0·36) g/l; P = 0·078). Values of C-reactive protein were only available for five (31 %) patients in the SOYA cohort and eight (35 %) in the OLIVE cohort. Initial values were not different in both cohorts. Values at the end of PN were 8·4 (sem 0·8) mg/l in the SOYA cohort and 11·0 (sem 1·7) mg/l in the OLIVE cohort (P = 0·167) (Table 2).
No differences were detected in these three proteins when analysed from basal values to the end of PN within each cohort (data not shown).
Other health outcomes
Length of ICU and hospital stay and mortality rate were not statistically different between the groups. Patients remained in the ICU for 31·3 (sem 6·4) d and at the hospital for 46·5 (sem 6·3) d in the SOYA cohort and 25·2 (sem 3·4) and 45·4 (sem 4·9) d, respectively, in the OLIVE cohort (P = 0·371, P = 0·885, respectively). Seven (44 %) patients died in the SOYA cohort and eleven (47·8 %) in the OLIVE cohort (P = 0·802).
Sub-analysis of patients with and without pre-existing infection
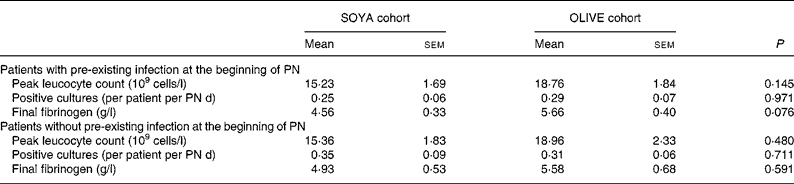
At the beginning of PN, twenty-two (56 %) patients had a pre-existing infection, nine (41 %) of which received the soyabean oil-based emulsion and thirteen (59 %), the olive oil-based emulsion. Basal characteristics and energy intake from these patients did not differ from the general group (data not shown). Main results from the sub-analysis are presented in Table 6. Of interest, only final fibrinogen presented a trend to higher values in the OLIVE cohort. Seventeen (44 %) patients had no pre-existing infection; seven (41 %) in the SOYA cohort and ten (59 %) in the OLIVE cohort. As before, basal characteristics and energy intake were similar to those of the general group (data not shown). As shown in Table 6, groups presented no differences.
(Mean values with their standard errors)
SOYA, soyabean oil-based emulsion; OLIVE, olive oil-based emulsion; PN, parenteral nutrition.
Discussion
The administration of an olive oil-based emulsion as part of PN has been demonstrated to be clinically safe and well toleratedReference Waizberg, Torrinhas and Jacintho1. This type of emulsion has been proposed to have less impact on the immune and inflammatory responseReference Waizberg, Torrinhas and Jacintho1 and theoretically confers advantages in patients under PN for whom immune suppression may be deleterious, such as ICU patientsReference Reimund, Scheer, Muller, Pinna, Duclos and Baumann14, Reference Buenestado, Cortijo, Sanz, Naim-Abu-Nabah, Martinez-Losa, Mata, Issekutz, Marti-Bonmati and Morcillo15. However, olive oil-based emulsions as part of PN had not been tested for their effects on infection in a clinical setting up to now. The present study is the first to compare the effects on infection of this emulsion with a soyabean oil-based emulsion in critically ill patients. Soyabean oil-based emulsions have been considered the standard for use in PN, despite being considered immune disturbingReference Waizberg, Torrinhas and Jacintho1.
In in vivo rodent models, olive oil-based emulsions have been shown greater lymphocyte activationReference Moussa, Le Boucher, Garcia, Tkaczuk, Ragab, Dutot, Ohayon, Ghisolfi and Thouvenot16, greater bacterial clearance, preserved mononuclear leucocytes functionsReference Garnacho-Montero, Ortiz-Leyba, Garnacho-Montero, Garcia-Garmendia, Pérez-Paredes, Moyano-Del Estad, Barrero-Almodóvar and Jiménez- Jiménez17, preserved leucocyte recruitment and emigrationReference Buenestado, Cortijo, Sanz, Naim-Abu-Nabah, Martinez-Losa, Mata, Issekutz, Marti-Bonmati and Morcillo15 and better tissue regenerationReference Ok, Yilmaz, Karaküçük, Akgün and Sahin18 when compared with soyabean oil-based emulsions. In in vitro human immune cell models, olive oil-based emulsions have also been shown not to alter lymphocyte proliferation or IL-2 releaseReference Granato, Blum, Rössle, Le Boucher, Malnoë and Dutot19, Reference Versleijen, Roelofs, Preijers, Roos and Wanten20, to preserve neutrophil activationReference Wanten, Rops, van Emst-de Vries, Naber and Willems21, Reference Wanten, Kusters, van Emst-de Vries, Tool, Roos, Naber and Willems22 and functionsReference Buenestado, Cortijo, Sanz, Naim-Abu-Nabah, Martinez-Losa, Mata, Issekutz, Marti-Bonmati and Morcillo15, and to induce low TNF-α and IL-1β inhibition in mononuclear leucocytesReference Reimund, Scheer, Muller, Pinna, Duclos and Baumann14 when compared with soyabean oil-based emulsions. Considering the results of these studies, a reduction in infection rate could theoretically be expected in patients who received olive oil-based emulsions compared with patients who received soyabean oil-based emulsions, since immune function would be better preserved. However, the present study could not detect any differences in infection rate or appearance of new infections in the studied cohorts. The advantages seen in vitro and in animal studies for olive oil-based emulsions were not transferred to better outcomes in the clinical setting. Many factors, other than the oil emulsion received, would affect patients' progress after injury, especially in critically ill patients.
Our leucocyte-count data showed that the OLIVE cohort had increased cell counts at the end of the PN course and had a trend to a higher peak when compared with the SOYA cohort. Unlike the present results for infections, the present results for leucocyte counts could be in agreement with previous in vitro studies. Soyabean oil-based emulsions promote lymphocyte and neutrophil death by apoptosisReference Cury-Boaventura, Gorjao, de Lima, Piva, Peres, Soriano and Curi8, Reference Buenestado, Cortijo, Sanz, Naim-Abu-Nabah, Martinez-Losa, Mata, Issekutz, Marti-Bonmati and Morcillo15 and decrease leucocyte rolling flux, adhesion, and emigrationReference Buenestado, Cortijo, Sanz, Naim-Abu-Nabah, Martinez-Losa, Mata, Issekutz, Marti-Bonmati and Morcillo15. These findings would explain the lower leucocyte counts in the SOYA cohort at the end of the PN course. Data are needed to know if soyabean oil-based emulsions have effects on leucocyte release from bone marrow in response to infection. This release is influenced by interleukins and TNFReference Abramson and Melton23, which, in turn, could be influenced by fatty acids.
The effects of olive oil-based emulsions have not been extensively studied. The present results on the acute-phase proteins serum albumin, fibrinogen and C-reactive protein are in agreement with previous published data. García-de-Lorenzo et al. Reference García-de-Lorenzo, Denia, Atlan, Martinez-Ratero, Le Brun, Evard and Bereziat24, in a prospective, double-blind, randomised study, compared the tolerability and metabolic effects of PN containing an olive oil-based emulsion v. a long-chain- and medium-chain TAG emulsion in severely burned patients. They found no difference between groups in the serum levels of these acute-phase proteins at the end of the study. However, fibrinogen levels increased during the study in the patients who received the olive oil-based emulsion. In our OLIVE cohort, fibrinogen showed a trend to increased levels at the end of PN. We do not know the relevance of this finding. Fibrinogen is induced by IL-6 and inhibited by TNF-αReference Gabay and Kushner25. Olive oil-based emulsions did not change IL-6 production but diminished TNF-α in burned patientsReference García-de-Lorenzo, Denia, Atlan, Martinez-Ratero, Le Brun, Evard and Bereziat24, but they did not alter TNF-α in in vitro studiesReference Reimund, Scheer, Muller, Pinna, Duclos and Baumann14, Reference Buenestado, Cortijo, Sanz, Naim-Abu-Nabah, Martinez-Losa, Mata, Issekutz, Marti-Bonmati and Morcillo15.
Several other studies have focused on the heath outcomes or safety of olive oil-based emulsions in adults. Better outcomes have been obtained in a study in ICU patients. Huschak et al. Reference Huschak, zur Nieden, Hoell, Riemann, Mast and Stuttmann26 compared high-fat (54·5 % of total energy intake) containing PN with olive oil-based emulsion v. high-glucose (51 % of total energy intake) containing PN with soyabean oil-based emulsion. Mean blood glucose levels were 1·3 mmol/l lower, and the duration of mechanical ventilation and length of ICU stay were 7 d shorter in the high-lipid-containing PN group. Infectious complications were not directly studied, but the mean daily sepsis score was lower in the high-lipid-containing PN group. Conclusions from this study are difficult to draw, since the authors compared two groups that did not receive the same energy load, glucose:lipid ratio, and fatty-acid emulsion composition. The results could be influenced by lower blood glucose after a lower glucose load rather than a lipid emulsion effect. Other studies in patients under home PNReference Thomas-Gibson, Jawhari, Atlan, Le Brun, Farthing and Forbes27–Reference Vahedi, Atlan, Joly, Le Brun, Evard, Perennec, Roux-Haguenau, Bereziat and Messing29, under intradialytic PNReference Cano, Saingra and Dupuy30, or in paediatric patientsReference Goulet, de Potter and Antébi31, Reference Göbel, Koletzko, Böhles, Engelsberger, Forget, Le Brun, Peters and Zimmermann32 with olive oil-based emulsions resulted in positive changes in lipid-related biochemical parameters, but not in clinical outcomes.
The present study had several limitations. First, it was designed as a retrospective study. Second, our patients were critically ill and not severely malnourished, and we do not know if the same results would have been observed in non-critically ill or severely malnourished patients. Third, we did not measure an extensive battery of inflammatory or immune markers. The present study was focused mainly on clinically relevant outcomes and markers rather than surrogate or experimental markers. Fourth, although abnormal leucocyte count is a widely used infection indicator in usual clinical practice, leucocyte count is also a variable parameter. Leucocytosis usually reflects the response of bone marrow to infectious and inflammatory processesReference Goulet, de Potter and Antébi31 and peak leucocyte count has been shown to be strongly related to microbial infectionReference Bossink, Groeneveld, Hack and Thijs13. Finally, including more patients would have increased the statistical power. Our study sample size was able to detect a significant reduction in infection rate of 40 % and a difference in peak leucocyte count of 5 × 10⁹ cells/l with standard power of 0·8 and type I error probability of 0·05. In view of the present results, differences with clinical impact could have only been detected in a large trial.
In conclusion, the use of an olive oil-based emulsion in PN had no effect on infection, acute-phase proteins, major health outcomes, and presented higher leucocyte counts at the end of PN and a trend to higher peak leucocyte counts when compared with soyabean oil-based emulsion in ICU patients.
Acknowledgements
The authors have no conflict of interest concerning substances, drugs or procedures presented in this paper. No financial support has been received for the study.


