


Statement of Research Significance
Research Question(s) or Topic(s): This study aimed to develop the first meta-analytic pooled network of post-concussion symptoms and systematically assess between-study heterogeneity. Main Findings: Findings revealed strong clustering among cognitive, emotional, and somatic symptoms, with concentration difficulty and slowed thinking emerging as central symptoms. This study also found large differences between studies. Study Contributions: The findings suggest that a one-size-fits-all approach may not be effective. Future research incorporating personalized network methodologies, such as ecological momentary assessment-based time-series networks, might be a promising new future direction.
Introduction
Up to one third of people who sustain a mild traumatic brain injury (mTBI, or concussion) develop symptoms such as fatigue, headaches, and memory/concentration problems for months following mTBI (Cancelliere et al., Reference Cancelliere, Verville, Stubbs, Yu, Hincapié, Cassidy, Wong, Shearer, Connell, Southerst, Howitt, Guist and Silverberg2023). The etiology of post-concussion symptoms remains controversial (Polinder et al., Reference Polinder, Cnossen, Real, Covic, Gorbunova, Voormolen, Master, Haagsma, Diaz-Arrastia and von Steinbuechel2018). Instead of viewing post-concussion symptoms as caused by a single latent variable (i.e., mTBI), the network perspective assumes that symptoms are mutually reinforcing and amplifying (Iverson, Reference Iverson2019). This can lead to self-sustaining feedback loops, where new symptoms develop, and existing ones become entrenched (Borsboom, Reference Borsboom2017; Borsboom & Cramer, Reference Borsboom and Cramer2013; Epskamp et al., Reference Epskamp, Borsboom and Fried2018).
Current clinical practice guidelines for mTBI recommend symptom-based treatment (Collins et al., Reference Collins, Kontos, Okonkwo, Almquist, Bailes, Barisa, Bazarian, Bloom, Brody, Cantu, Cardenas, Clugston, Cohen, Echemendia, Elbin, Ellenbogen, Fonseca, Gioia and Guskiewicz2016; Marshall et al., Reference Marshall, Bayley, McCullagh, Velikonja, Berrigan, Ouchterlony and Weegar2015; Rytter et al., Reference Rytter, Graff, Henriksen, Aaen, Hartvigsen, Hoegh, Nisted, Næss-Schmidt, Pedersen, Schytz, Thastum, Zerlang and Callesen2021). However, in previous clinical studies, patients, on average, reported 6 to 9 symptoms at clinic intake, making it hard to identify core symptoms as treatment targets (Silverberg et al., Reference Silverberg, Panenka, Lizotte, Bayley, Dance and Li2020; Silverberg et al., Reference Silverberg, Cairncross, Brasher, Vranceanu, Snell, Yeates, Panenka, Iverson, Debert, Bayley, Hunt, Baker and Burke2022). The network approach may help to obviate this problem via the identification of single, paired, or cluster(s) of central symptom(s) within the symptoms network, which could be initial targets for treatment and rehabilitation (Collins et al., Reference Collins, Kontos, Okonkwo, Almquist, Bailes, Barisa, Bazarian, Bloom, Brody, Cantu, Cardenas, Clugston, Cohen, Echemendia, Elbin, Ellenbogen, Fonseca, Gioia and Guskiewicz2016). In theory, targeting one or two symptoms with a high centrality might reduce or interrupt the development of other symptoms following mTBI, potentially preventing entrenchment and persistence of post-concussion symptoms (Borsboom & Cramer, Reference Borsboom and Cramer2013; Contreras et al., Reference Contreras, Nieto, Valiente, Espinosa and Vazquez2019).
The term “network analysis” refers to a group of modeling approaches, with most of the studies on post-concussion symptom networks using cross-sectional group-level models. Network analysis of cross-sectional data typically involves the visualization of partial correlation matrices as nodes and edges. Each variable is represented by a node, and edges represent partial correlations between nodes (i.e., associations between variables that remain after accounting for shared relationships with all other variables in the network). Cross-sectional networks reflect between-subject effects. If the node for headache shares a strong edge with the node for difficulty concentrating, for example, then the network demonstrates that individuals who experience headaches are also likely to experience difficulty concentrating. Cross-sectional networks exclusively comprise bidirectional edges, as there is no temporal precedence or directionality to the model parameters. Once a network model has been estimated, centrality estimates are extracted as operational measures of network dynamics. For cross-sectional networks, centrality reflects average degrees of (partial) correlation among the variables included in the model.
Over the past 5 years, several studies have derived network models for post-concussion symptoms following mTBI using cross-sectional group-level data (Eagle et al., Reference Eagle, Jain, Sun, Preszler, McCrea, Giacino, Manley, Okonkwo and Nelson2023; Faulkner et al., Reference Faulkner, Theadom, Snell and Williams2023; Fonda et al., Reference Fonda, Crowe, Levin, Jagger-Rickels, Marx, Milberg, McGlinchey and Fortier2022; Goodwin et al., Reference Goodwin, Salva, Rodrigues, Maietta, Kuwabara, Ross, Kinsora and Allen2023; Preszler et al., Reference Preszler, Manderino, Fazio-Sumrok, Eagle, Holland, Collins and Kontos2023). Their results are variable, which might be explained by heterogeneous study methods and/or replication failure due to insufficient power. A meta-analysis could examine between-study heterogeneity in a systematic way and establish a single well-powered cross-sectional network model. The current study aimed to carry out a meta-analysis of existing studies that derived cross-sectional network models of post-concussion symptoms following mTBI using the Meta-Analytic Gaussian Network Aggregation (MAGNA) framework (Epskamp et al., Reference Epskamp, Isvoranu and Cheung2022). Specifically, this study aimed to estimate a pooled between-persons network structure of common symptoms, identify the most central symptoms in the aggregated (meta-analytic) network structure, and investigate the degree of between-study heterogeneity in cross-sectional networks in published studies to date.
Method
The current systematic review and meta-analysis adheres to the Preferred Reporting Items for Systematic Reviews and Meta-Analyses (PRISMA) guidelines (Moher et al., Reference Moher, Liberati, Tetzlaff, Altman and Group2009; Page et al., Reference Page, McKenzie, Bossuyt, Boutron, Hoffmann, Mulrow, Shamseer, Tetzlaff, Akl, Brennan, Chou, Glanville, Grimshaw, Hróbjartsson, Lalu, Li, Loder, Mayo-Wilson, McDonald and Moher2021). Refer to Supplementary Table 1 for the PRISMA checklist. The review protocol was registered to the International Prospective register of Systematic Reviews (PROPERO; registration # CRD42024542078). All data included in this manuscript was obtained in compliance with University of British Columbia’s ethical guidelines.
Data sources and search strategies
Four large databases (MEDLINE, PsycINFO, EMBASE, Web of Science) were searched for peer-reviewed, empirical articles written in English. The search terms include a combination of a keyword related to network modeling (i.e., network analys* OR network approach OR network model* OR network structure* OR network psychometric*), and a subject heading (i.e., Brain Concussion) or keyword related to mTBI (i.e post-concussi* symptom* OR post-concussi* syndrome OR postconcussi* symptom* OR postconcussi* syndrome OR concussi* OR mild traumatic brain injury OR head injur* OR mTBI OR mild TBI). Databases were accessed through University of British Columbia’s EBSCOhost Interface. For specific search terms used for each database, please see Supplementary Table 2. The search strategy was implemented on September 22nd, 2024.
Study selection
Studies were included if they (1) were written in English, (2) were peer-reviewed full articles, (3) estimated a Gaussian Graphical Model (GGM) of symptoms in people with mTBI,, and (4) used cross-sectional or panel data.
Two reviewers independently screened titles and abstracts for inclusion. Full-text reviews of included abstracts were conducted independently by each reviewer to further assess eligibility. In both the title and abstract screening and the full-text review stages, any disagreements between the two reviewers were resolved through discussion to reach a final decision. All screening and selection processes were documented using Covidence (2024).
Data extraction
From all eligible articles, we extracted first author’s last name, year of publication, email address of the corresponding author(s), sample size (following listwise deletion when missing data were present), measure used as well as number of variables included in the measure assessing post-concussion symptoms, sample characteristics (location, setting, size, composition), and when available, the raw data or Pearson correlation matrices.
The MAGNA framework uses correlation matrices of the datasets as input. When these correlation matrices or the original datasets were not publicly available, corresponding authors were contacted directly to request either the dataset used to estimate the network models or, if data sharing was not feasible, summary statistics needed for the meta-analysis. Specifically, we asked for Pearson correlation matrices (derived using listwise deletion methods), the sample size for developing each network, variable names, means, and standard deviations for each variable.
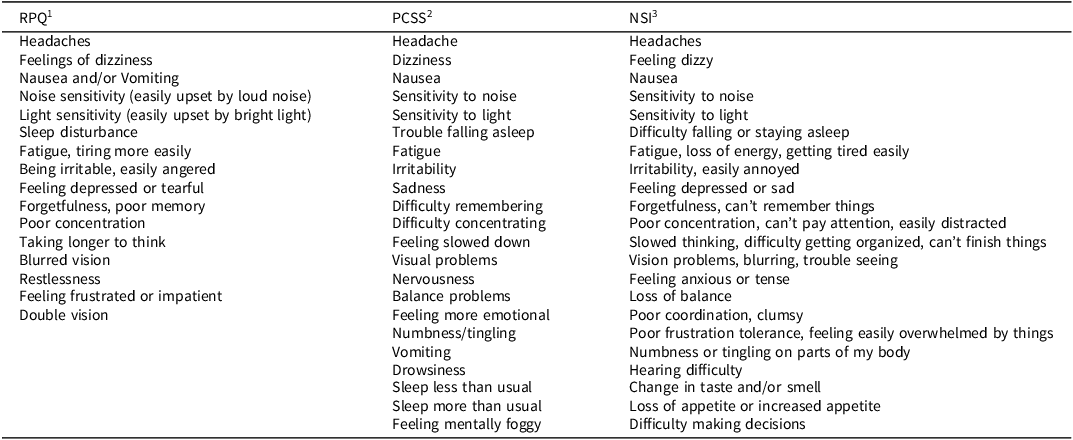
Given the variety of measures used across studies to assess for PCS symptoms, for every study included in the meta-analysis, we examined all variables and identified the overlapping symptoms that were assessed by all measures used (see Table 1). A total of 13 overlapping PCS symptoms assessed across measures were identified, encompassing the most common PCS symptoms (King et al., Reference King, Crawford, Wenden, Moss and Wade1995; Machamer et al., Reference Machamer, Temkin, Dikmen, Nelson, Barber, Hwang, Boase, Stein, Sun, Giacino, McCrea, Taylor, Jain, Manley, Bodien, Diaz-Arrastia, Duhaime, Feeser, Ferguson and Zafonte2022; Ryan & Warden, Reference Ryan and Warden2003). One reviewer extracted the data, and a second reviewer verified its accuracy. Any discrepancies were resolved through discussion between the two reviewers. In one study where multiple samples were available (e.g., different populations) (Faulkner et al., Reference Faulkner, Theadom, Snell and Williams2023), each sample was treated as an independent sample in the statistical analyses. Another study that assessed the same sample across four time points (2 weeks, 3 months, 6 months, and 12 months) (Eagle et al., Reference Eagle, Jain, Sun, Preszler, McCrea, Giacino, Manley, Okonkwo and Nelson2023), the 6-month time point was chosen for inclusion in the current analysis to minimize interdependency within the data.
Measures used across studies

Note:
1 RPQ-Rivermead Post-Concussion Symptoms Questionnaire (King et al., Reference King, Crawford, Wenden, Moss and Wade1995). Items are rated on a 0-4 scale, with higher score indicating more severe symptoms.
2 PCSS-Post-Concussion Symptoms Scale (Lovell et al., Reference Lovell, Iverson, Collins, Podell, Johnston, Pardini, Pardini, Norwig and Maroon2006). Items are rated on a 0–6 scale, with higher score indicating more severe symptoms.
3 NSI-Neurobehavioral Symptom Inventory (King et al., Reference King, Donnelly, Donnelly, Dunnam, Warner, Kittleson, Bradshaw, Alt and Meier2012). Items are rated on a 0–4 scale, with higher score indicating more severe symptoms. Note, the symptoms in shaded grey cells were included in the meta-analysis.
Statistical analysis
All statistical analyses were conducted in the R statistical software version 4.4.1, using the MAGNA framework in the R package psychonetrics (Epskamp et al., Reference Epskamp, Isvoranu and Cheung2022). When using fixed-effects MAGNA to estimate a pooled Gaussian Graphical Model (GGM), it assumes that the true correlational structure is identical across all datasets (Epskamp et al., Reference Epskamp, Isvoranu and Cheung2022). However, this assumption may not always be appropriate. Given the nature of the dataset included in this study, heterogeneity across the samples studying networks for post-concussion symptoms were anticipated. For instance, the datasets include diverse populations, such as service members and civilians, adults and adolescents, and varied injury settings (e.g., sport and military deployment-related injuries), and were assessed at different time points following injury. Previous research has also demonstrated that it is unlikely for different samples to share an identical network model (Forbes et al., Reference Forbes, Wright, Markon and Krueger2021).
Similar to a previous meta-analysis of Post-Traumatic Stress Disorder (PTSD) symptoms using the MAGNA framework (Isvoranu et al., Reference Isvoranu, Epskamp and Cheung2021), we used the random-effects MAGNA model to account for both the pooled network structure of symptoms and between-study heterogeneity. In this approach, the model addresses heterogeneity by modeling the marginal pairwise correlations between symptoms as a combination of three components: the correlation implied by pooled GGM structure, between-study random effects (heterogeneity), and sampling variation.
A Pearson correlation matrix with listwise deletion from each study was included as the data input for all the analyses of the current meta-analysis. The random-effects MAGNA analysis began by estimating the extent of sampling variation in the Pearson correlations across included samples. Accounting for this sampling variation, each correlation matrix was entered into the model as a variable. The model then estimated both the mean (fixed effect) and the variance-covariance structure (random effects) of these correlation matrices. As a multi-level model with random effects on correlations, random-effects MAGNA involves estimating a large number of parameters. In the current study, for a 13-node network, this included 78 network parameters, 78 variances, and 3,003 covariances.
Pooled MAGNA edge weights
The edge weights in the pooled MAGNA network were partial correlation coefficients between symptom nodes, which represent the strength of between-persons associations between nodes, while controlling for all other nodes in the dataset. The random-effects MAGNA model returned a set of edge weights that reflected the expected associations between symptoms across all included samples. Standard errors for these edge weights were derived from the parameter variance-covariance matrix, and p-values and confidence intervals for each edge weight were then calculated based on the standard errors (Epskamp et al., Reference Epskamp, Isvoranu and Cheung2022; Isvoranu et al., Reference Isvoranu, Epskamp and Cheung2021). To enhance clarity and reduce overfitting, weak partial correlations were pruned at an alpha level of 0.05, setting them to zero.
Pooled MAGNA centrality indices
Centrality indices are metrics used to indicate the importance of symptom nodes within a network (Borsboom, Reference Borsboom2017; Spiller et al., Reference Spiller, Levi, Neria, Suarez-Jimenez, Bar-Haim and Lazarov2020). In this study, two centrality indices were examined: strength (Epskamp et al., Reference Epskamp, Borsboom and Fried2018) and expected influence (Robinaugh et al., Reference Robinaugh, Millner and McNally2016). These metrics quantify direct connectivity between the nodes: strength is the sum of the absolute values of all edge weights connected to a node, whereas expected influence sums the edge weights without taking their absolute values (Borsboom, Reference Borsboom2017; Robinaugh et al., Reference Robinaugh, Millner and McNally2016). Conceptually, centrality strength reflects the overall magnitude of a node’s direct connections to other nodes, whereas expected influence incorporates both the magnitude and the direction (positive or negative) of the relationships between pairs of symptoms, providing a more nuanced influence within the network (Robinaugh et al., Reference Robinaugh, Millner and McNally2016). For a node with only positive edges, expected influence is equal to strength, whereas for a node with both positive and negative edges, a negative edge increases a node’s strength but decreases its expected influence. We chose not to include two other common centrality measures – betweenness and closeness – as they quantify indirect connectivity, which, in the context of group-level cross-sectional networks, would not yield interpretable or meaningful results (Bringmann et al., Reference Bringmann, Elmer, Epskamp, Krause, Schoch, Wichers, Wigman and Snippe2019).
To test for significance of the centrality differences across nodes, a parametric bootstrap routine – recently employed in a meta-analysis of PTSD symptom networks (Isvoranu et al., Reference Isvoranu, Epskamp and Cheung2021) – was employed in the current meta-analysis. The procedure was as follows: first, we simulated 1,000 network models using the estimated parameter variance-covariance matrix generated by the pooled MAGNA network. Next, we computed the differences between each pair of variables for each centrality index. The proportion of differences below zero and above zero for each pair of variables and for each centrality index across all bootstrapped network models were then calculated. To obtain the p-value and significance, we took the minimum of these proportions and multiplied by two, indicating a two-sided test of difference.
Heterogeneity across studies
Similar to simulation studies and prior work (Epskamp et al., Reference Epskamp, Isvoranu and Cheung2022; Isvoranu et al., Reference Isvoranu, Epskamp and Cheung2021), the random effects standard deviations were used in the current study to quantify between-study heterogeneity. These random effects standard deviations were calculated by taking the square root of the estimated variances from the estimated variance-covariance matrix on the variability around the correlation structure generated by the random-effects MAGNA model. They represent the extent to which the correlation coefficient between two variables differs across studies, while accounting for sampling variation. Based on the simulation study (Epskamp et al., Reference Epskamp, Isvoranu and Cheung2022), we considered a random effect standard deviation greater than 0.1 to reflect large heterogeneity on the correlational structure.
Comparison to single-study network models
We further examined how individual network models derived from single samples aligned with or deviated from the pooled MAGNA network. To do this, we estimated 6 individual networks for each sample correlation matrix using the psychonetrics package, with pruning at α = 0.05. This approach estimated unthresholded partial correlations, removed non-significant edges according to the pruning parameter, and re-fitted the remaining edges while setting the weights of the removed edges to zero. We then compared the parameter estimates from each individual study to those from the pooled MAGNA network by calculating the deviance of each parameter estimate in the individual samples from the corresponding parameter estimates in the pooled MAGNA network. Additionally, for each parameter estimate included in the pooled MAGNA network, we calculated the proportion of the same parameter estimates that remained across individual samples after pruning.
Risk of bias assessment
To date no established instruments yet exist to assess risk of bias specifically for network studies. We used a risk of bias assessment tool commonly used to critically appraise cross-sectional studies (Moola et al., Reference Moola, Munn, Tufanaru, Aromataris, Sears, Sfetcu, Currie, Lisy, Qureshi, Mattis, Mu, Aromataris and Munn2020), given that the current study aimed to examine network models developed based on cross-sectional/panel data.
Results
The study selection process is illustrated in a PRISMA flow diagram (Figure 1).
PRISMA flow diagram.

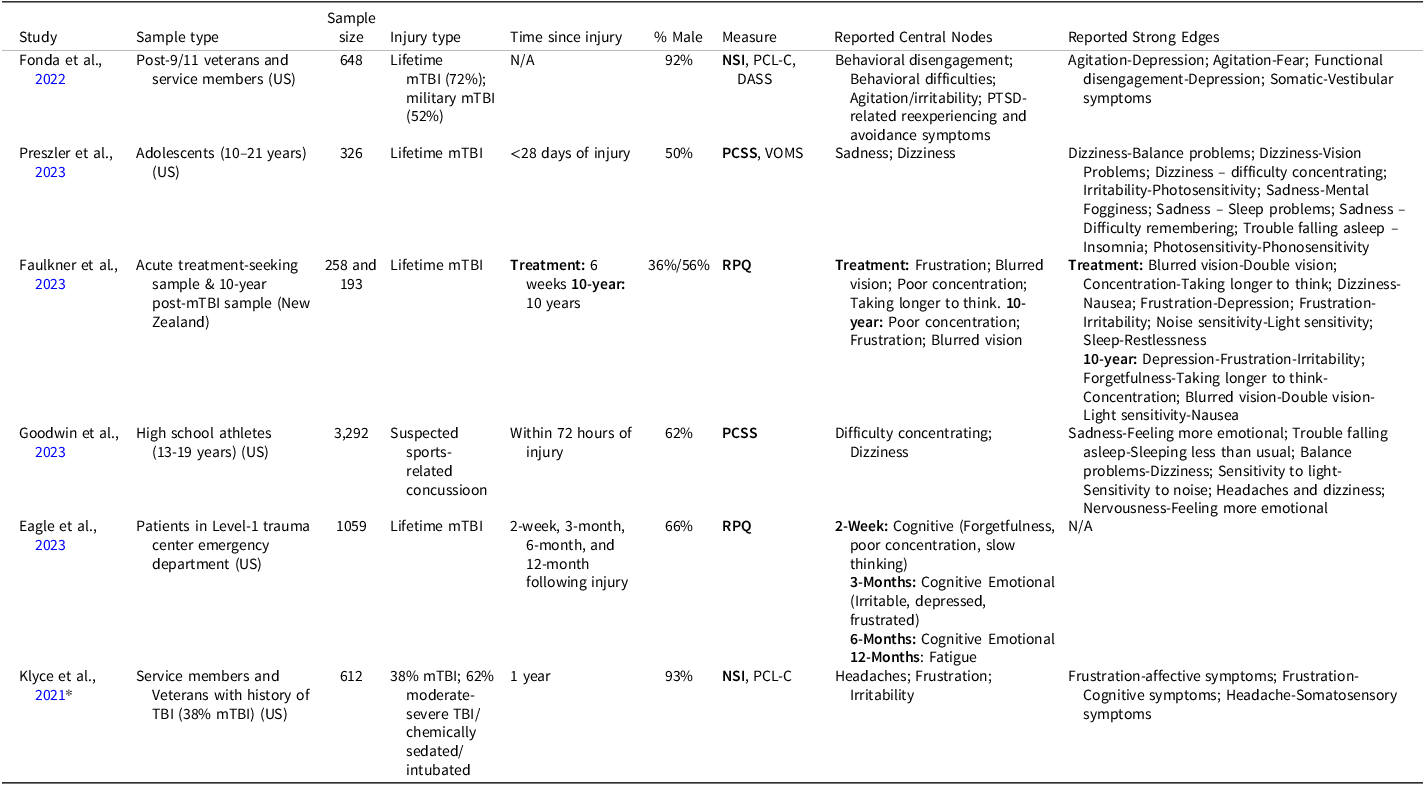
In total, the search returned 346 articles. After removing 174 duplicates, 172 records were screened by title and abstract for eligibility. For 14 articles where eligibility remained unclear, the full text was reviewed, leading to the exclusion of 8 articles. This resulted in 6 eligible studies being included in the systematic review. We could not obtain necessary data and/or statistics for the meta-analysis for one study, despite attempts to contact the corresponding author, resulting in a total of 5 studies and 9 samples included in the systematic review. Of these, a total of 6 independent samples were included in the meta-analysis (see METHOD for inclusion). Table 2 presents the study characteristics for each included study. Sample sizes ranged from 193 to 3,292, with a median of 648. The total pooled sample size was N = 5,776.
Study characteristics

* Note: this study was not included in the meta-analysis due to inability to obtain the correlation matrix of the mTBI subset of the sample.
Qualitative synthesis
There were variabilities across samples in terms of population (2 adolescent cohorts vs. 4 adult cohorts, 4 civilian cohorts vs 2 military cohorts), injury type (5 lifetime mTBI, 2 military mTBI, 1 sport-related mTBI), sex distribution (percentage male ranging from 36% to 93%), and the average time since injury (ranging from within 72 hours to 10 years post-injury).
Concentration problems were consistently identified as the most central symptom in the network, appearing as one of the most central symptoms in 6 of the 9 samples (3 out of 6 studies). Frustration/poor frustration tolerance was nearly as central, appearing as one of the most central symptoms in 5 of the 9 samples (3 out of 6 studies). Irritability was identified as central in 4 of the 9 samples (3 out of 6 studies), slowed thinking (taking longer to think) in 4 of the 9 samples (2 out of 6 studies), and dizziness in 2 of the 9 samples (2 out of 6 studies). Lastly, sadness emerged as central in 3 of the 9 samples (2 out of 6 studies). In general, the strongest edges within individual networks tend to occur between symptoms within the same cluster (i.e., emotional, cognitive, or physical symptoms).
Pooled MAGNA edge weights
Figure 2 shows the estimated pooled MAGNA network for post-concussion symptoms, with numeric results for the network parameter estimates in Supplementary Table 3. Figure 3 shows the estimated edge weights, including 95% confidence intervals and the significance of these connections. The three strongest edges were between “slowed thinking” and “concentration difficulty,” “light sensitivity” and “noise sensitivity,” and “slowed thinking” and “memory problems.” Additional strong edges included those connecting affective/emotional nodes: “low mood” and “irritability,” as well as several edges linked to specific symptoms: “headache” was connected to “sleep problems,” “light sensitivity,” and “noise sensitivity;” “noise sensitivity” was further linked to “irritability” and “concentration difficulty;” and “dizziness” was connected to “nausea” and “vision problems.” Another significant connection was observed between “fatigue” and “slowed thinking.” The network also demonstrated some clustering, particularly among the cognitive nodes “slowed thinking,” “concentration difficulty,” and “memory problems.”
Estimated pooled MAGNA network including 13 core post-concussion symptoms. Nodes represent each post-concussion symptoms, and edges represent partial correlation coefficients between the symptom pairs.

Estimated edge weights of the pooled MAGNA, 95% confidence regions, and p values based on the estimated standard errors.

Pooled MAGNA centrality indices
Figure 4 shows centrality indices of symptom nodes in the pooled MAGNA network, and Figure 5 shows the results of the parametric bootstrapped difference tests for these centralities. Overall, the indices were highly aligned, identifying cognitive symptoms – specifically “concentration difficulty” and “slowed thinking” – as the most central, with these nodes showing significantly higher expected influence. Difference testing revealed that “concentration difficulty” showed significantly higher expected influence than several other symptoms, and “slowed thinking” showed significantly higher expected influence than “nausea,” confirming the centrality of the cognitive symptoms across networks. No other single symptom or small group of symptoms consistently stood out as more central across all centrality indices. “Nausea” showed significantly lower expected influence compared to several other symptoms, emerging as a relatively less central symptom across the networks.
Estimated centrality indices for the symptoms/nodes of the pooled MAGNA network.

Centrality difference plots obtained through a parametric bootstrap. Each block indicates the significance of the difference between each centrality index of two nodes. These were obtained by sampling 1,000 network structures from the estimated parameter variance-covariance matrices.

Heterogeneity across studies
The estimated random effect standard deviations for the implied correlational structure of the pooled MAGNA network range from 0.03 to 0.12 (Supplementary Table 3). The standard deviations showed variable, but generally large, degree of heterogeneity across all possible correlations (see Figure 6).
Estimated random effect standard deviations on the model-implied marginal correlation structure among post-concussion symptoms. Higher values indicate larger differences between studies in correlational structure between that specific pair of symptoms.

Comparison to single-study network models
Figure 7 shows whether the single-study network models produced similar parameter weights (i.e., partial correlation estimates) to the edge weights derived from the pooled MAGNA network, focusing on edges included in the networks after pruning. Single studies with larger sample sizes showed less deviance from the pooled network structure, whereas edge weights from studies with smaller sample sizes exhibited greater deviations from the pooled MAGNA edge weights. By using a significance threshold of α = 0.05 to prune unsignificant edges, single-study networks were more likely to include the strongest edges identified in the pooled MAGNA network.
Edge weight estimates were derived from separate analyses of individual correlation matrices, treated as single studies, and compared to the pooled MAGNA network results. Each correlation matrix was analyzed using pruned partial correlation networks using the psychonetrics package. Each symbol in the figure represents one of the 78 potential edges in a 13-node PCS symptom network. Deviance was calculated as the difference between the parameter estimate from each single study and the corresponding edge weight estimated in the pooled MAGNA network.

Risk of bias assessment
Supplementary Table 4 shows the results of risk of bias assessment using the JBL Critical Appraisal Tool for Analytical Cross-Sectional Studies (Moola et al., Reference Moola, Munn, Tufanaru, Aromataris, Sears, Sfetcu, Currie, Lisy, Qureshi, Mattis, Mu, Aromataris and Munn2020). Overall, the studies demonstrated a very low risk of bias, with one exception. Goodwin et al. (Reference Goodwin, Salva, Rodrigues, Maietta, Kuwabara, Ross, Kinsora and Allen2023) showed a potential risk of bias in the exposure/measurement of condition domain due to the lack of a clear case definition for mTBI.
Discussion
This study introduced the first-ever systematic review and meta-analysis of cross-sectional group-level network models of post-concussion symptoms after mTBI. We developed and examined a singled pooled network structure of frequently assessed post-concussion symptoms and identified strong edges and central nodes within the network. A main finding of the current meta-analysis is that “concentration difficulty” and “slowed thinking” were among the most central in the group-level pooled network, whereas “nausea” was the least central. Higher expected influence of the cognitive nodes suggests that they are more strongly and positively interconnected with other symptoms, potentially making them more likely to co-occur with, or reinforce, other symptoms within the network (Robinaugh et al., Reference Robinaugh, Millner and McNally2016).
Random effect sizes in the implied correlational structure were generally large, indicating significant differences between studies. This finding is unsurprising given the heterogeneity in the sample characteristics of included studies. Comparisons between edge weights estimated in single-study networks and the pooled edge weights estimated in the MAGNA network also revealed notable deviations.
Most of the strong edges were within-cluster associations, reflecting symptom clusters identified in previous factor analyses of post-concussion symptoms: cognitive, affective/emotional, and somatic (Kontos et al., Reference Kontos, Elbin, Schatz, Covassin, Henry, Pardini and Collins2012; Polinder et al., Reference Polinder, Cnossen, Real, Covic, Gorbunova, Voormolen, Master, Haagsma, Diaz-Arrastia and von Steinbuechel2018; Potter et al., Reference Potter, Leigh, Wade and Fleminger2006). Cognitive symptoms, including “concentration difficulty,” “memory problems,” and “slowed thinking,” formed a tightly connected cluster. Similarly, affective/emotional symptoms “low mood” and “irritability” showed strong interconnections. Somatic symptoms, including “light sensitivity,” “noise sensitivity,” and “headache,” also exhibited some clustering, as did vestibular symptoms “dizziness,” “nausea,” and “vision problems,” though these clusters were less coherent. Some associations between clusters were observed. “Noise sensitivity” emerged as a bridge node, connecting with both cognitive and affective/emotional symptoms. “Fatigue” also acted as a bridge node, connecting somatic symptoms with cognitive symptoms. These symptoms co-varied with two relatively distinct symptom clusters – either influencing the expression of both clusters and/or arising as a result of their co-occurrence.
The relatively high centrality of cognitive symptoms indicate that they are commonly reported alongside a range of other symptoms (i.e., rarely occur in isolation). This may mean cognitive symptoms are largely driven by other symptoms, such as psychological distress (Abramovitch et al., Reference Abramovitch, Short and Schweiger2021; Shi et al., Reference Shi, Picon, Rioux, Panenka and Silverberg2024) or being distracted by physical symptoms (Teodoro et al., Reference Teodoro, Edwards and Isaacs2018), or conversely, that cognitive symptoms may contribute to the activation or reinforcement of other symptoms within the network. Due to the inherent limitation of cross-sectional network modeling, the current finding cannot provide information about the directionality of relationships between cognitive symptoms and other symptoms in the network (that is, whether the strength identified in the present study reflects regulated instrength or potentially causal, regulating outstrength). Future research is needed to clarify whether cognitive symptoms precede or follow other symptoms, potentially through the use of temporal networks with time-series data. If future research supports the latter causal direction, then targeting cognitive symptoms in treatment may support broader recovery. Emerging evidence suggests that interventions focused on cognitive symptoms following mTBI are associated with improvements in overall symptom reporting (Cooper et al., Reference Cooper, Bunner, Kennedy, Balldin, Tate, Eapen and Jaramillo2015; Rioux et al., Reference Rioux, Mamman, Byworth, Panenka, Howard, Perez, Schmidt, Courchesne, LeMoult, Heran and Silverberg2024; Storzbach et al., Reference Storzbach, Twamley, Roost, Golshan, Williams, ONeil, Jak, Turner, Kowalski, Pagulayan and Huckans2017).
Most symptoms were indistinguishable in their centrality, and there was high heterogeneity between studies. Symptom networks may be highly idiosyncratic and may vary from person to person (Rabinowitz & Fisher, Reference Rabinowitz and Fisher2020). This implies that group-level networks may not be the most effective method for studying the network structure of symptoms after mTBI, as they fail to capture the information needed for precision rehabilitation (Fisher et al., Reference Fisher, Medaglia and Jeronimus2018; Zuidersma et al., Reference Zuidersma, Riese, Snippe, Booij, Wichers and Bos2020). Personalized networks derived from intensive repeated measures within individuals over time (e.g., with ecological momentary assessment) could provide more nuanced insights. The temporal nature of repeated measures within-subject data also allows for the modeling of time-lagged relationships between symptoms (Balasundaram et al., Reference Balasundaram, Athens, Schneiders, McCrory and Sullivan2016; Epskamp et al., Reference Epskamp, Borsboom and Fried2018), which could offer valuable insights into symptom dynamics for each individual patient (Fann et al., Reference Fann, Uomoto and Katon2001).
To address these challenges, future studies aggregating multiple cross-sectional post-concussion symptom networks should use methodologies that explicitly account for between-study heterogeneity, such as the random-effects MAGNA framework employed in the current study. These findings further highlight the importance of the personalized approach, emphasizing precision over generalizability in understanding and addressing post-concussion symptoms.
Limitations
This study has limitations. First, the meta-analysis included only studies that constructed cross-sectional networks, which limits the ability to draw causal and mechanistic inferences from the findings. To our knowledge, only one within-person network study on symptoms following mTBI has been conducted (Rabinowitz & Fisher, Reference Rabinowitz and Fisher2020). The results of the current study highlight the need for idiosyncratic network approaches that can account for temporal dynamics and between-person heterogeneity to better inform treatment planning and support personalized care following mTBI.
Second, the limited sample size in the current study may have impacted the sensitivity and specificity of the random-effects MAGNA model. Simulations reported by Epskamp et al. (Reference Epskamp, Isvoranu and Cheung2022) showed that the random-effect MAGNA model performs well in estimating the pooled network and cross-study heterogeneity given sufficient sample sizes. For the current study’s sample size (n = 6), sensitivity and correlation were approximately 0.8, while specificity was slightly below the desired threshold of 0.95 (Epskamp et al., Reference Epskamp, Isvoranu and Cheung2022). Given the small number of available samples, the pooled network may be more sensitive to the characteristics of individual studies – especially those with larger samples (e.g., edge weights from larger studies showed considerably less deviation from the pooled MAGNA edge weights compared to those from smaller studies) – and therefore may not fully reflect the broader population-level structure. In an attempt to address this limitation, we conducted the same analyses using 9 samples by treating data from the Eagle et al. (Reference Eagle, Jain, Sun, Preszler, McCrea, Giacino, Manley, Okonkwo and Nelson2023) study, assessed at four time points, as four individual samples – a strategy also applied in Isvoranu et al. (Reference Isvoranu, Epskamp and Cheung2021). These analyses yielded almost identical results to those reported here (see Supplementary Figures 1–4). Nonetheless, the small sample size remains an important limitation, and the robustness and generalizability of the pooled network might be limited. Given the novelty of applying network methods to study symptoms following mTBI and the fact that all included studies were published from 2022 onward, we anticipate more studies will emerge. Repeating this meta-analysis with a larger, better-powered sample in the future would be worthwhile to enhance the robustness and reliability of the findings.
Third, the limited number of symptoms included in the MAGNA analyses may have led to the omission of some important symptoms. This limitation arose from having to exclude symptoms that do not overlap across the multitude of measures used across studies. This risk is unlikely, as current analysis captures the most prevalent and commonly reported symptoms following mTBI, ensuring coverage of the core symptomatology of post-concussion symptoms (King et al., Reference King, Crawford, Wenden, Moss and Wade1995; Machamer et al., Reference Machamer, Temkin, Dikmen, Nelson, Barber, Hwang, Boase, Stein, Sun, Giacino, McCrea, Taylor, Jain, Manley, Bodien, Diaz-Arrastia, Duhaime, Feeser, Ferguson and Zafonte2022; Ryan & Warden, Reference Ryan and Warden2003).
Lastly, there is currently no risk-of-bias tool specifically designed for evaluating the quality of network studies. While the adapted tool used in this analysis addressed several key aspects of study quality, it may have missed certain factors. For instance, it did not account for the potential biases associated with using Pearson correlations on ordinal data, which could influence the accuracy and reliability of the network estimates.
Conclusion
In summary, the network approach has gained popularity over the past decade as a promising tool for advancing our understanding of neuropsychiatric disorders. We observed that cognitive symptoms were most central in a common pooled network structure of symptoms following mTBI. The results also suggest that there may not be a single overall generalizable symptom network structure, highlighting the need for an idiographic approach. There is also potential value of future meta-analytic work that include a larger number of studies and samples as they emerge, to identify subgroup-specific patterns.
Supplementary material
The supplementary material for this article can be found at https://doi.org/10.1017/S1355617726101854.
Acknowledgements
None.
Funding statement
The authors received no funding for this research.
Competing interests
The authors have no conflict of interest to report.


 Open access