

School has been identified as an important setting for the provision and promotion of healthy food to young people( Reference Wechsler, Devereaux and Davis 1 – 3 ). Easy access to affordable, healthy foods at school is recommended in obesity management strategies( 2 – 4 ), and with 20–25 % of Irish adolescents currently overweight or obese( Reference Keane, Kearney and Perry 5 – Reference Barron, Comiskey and Saris 8 ), there is increasing pressure on the education sector to play a role in management and prevention. This situation is not unique to Ireland; the availability of low-nutrient, energy-dense foods in schools and the environments close to schools is well documented in international literature( Reference Callaghan, Molcho and Nic Gabhainn 9 – Reference Kubik, Lytle and Hannan 18 ). Low-nutrient, energy-dense food and beverage items including confectionery, biscuits and cakes, salty snacks and sugar-sweetened beverages are commonly sold alongside healthier options in Irish secondary schools( Reference Callaghan, Molcho and Nic Gabhainn 9 ). In the USA the availability of French fries or chips, sugar-sweetened beverages and other energy-dense foods at school is associated with higher energy intake among students( Reference Briefel, Crepinsek and Cabili 16 ). Fruit and vegetable consumption has also been shown to be lower in schools where low-nutrient, energy-dense foods are available( Reference Vereecken, Inchley and Subramanian 15 , Reference Briefel, Crepinsek and Cabili 16 , Reference Kubik, Lytle and Hannan 18 ). Favouring low-nutrient, energy-dense foods is associated with the displacement of nutrients as demonstrated by a study in which adolescents who purchased low-nutrient energy-dense foods in addition to obtaining a school lunch wasted more of the latter foods, had higher intakes of total energy and fat, and lower intakes of Ca, thiamin and vitamins C and A at lunchtime than students who did not purchase these foods with their lunch( Reference Templeton, Marlette and Panemangalore 19 ).
The literature indicates that food retailers in close proximity to secondary schools are an important influence on the dietary behaviours of young people because they are potentially easily accessible by students before, during lunchtime (if permitted) and after school( Reference Virtanen, Kivimäki and Ervasti 11 – Reference Davis and Carpenter 13 ). Studies show that students who attend schools within a 1 km radius of fast-food restaurants are more likely to purchase fast food, and report higher soft drink consumption and lower fruit and vegetable consumption, compared with students who do not have easy access to such environments( Reference Héroux, Iannotti and Currie 12 , Reference He, Tucker and Gilliland 20 ). Most studies involving local food environments have examined eating behaviours( Reference Virtanen, Kivimäki and Ervasti 11 – Reference Davis and Carpenter 13 ), diet quality scores( Reference Smith, Cummins and Clark 21 ) or purchasing behaviours( Reference He, Tucker and Gilliland 20 ); therefore nutrients associated with consumption are not well described in the literature. Approximately three-quarters of Irish secondary schools are located within 1 km of a fast-food restaurant( Reference Callaghan, Molcho and Nic Gabhainn 9 ); however, their influence on purchasing and consumption behaviours and nutrient intakes is not known.
Recent school food reform in the UK includes nutrient standards for school meals as well as restrictions on the availability, frequency and portion sizes of high-sugar and high-fat snack foods. Research indicates that the mandatory standards are improving the nutritional intake of students who avail of school lunches, compared with home-sourced lunches( Reference Adamson, Spence and Reed 22 – Reference Stevens, Nicholas and Wood 24 ). The absence of a school meal programme in the Republic of Ireland (ROI) limits the application of a similar approach here. Research from countries with no state school meal programme, such as Canada and the Netherlands, have demonstrated the importance of exploring national and regional practices in order to plan relevant interventions( Reference Fung, McIsaac and Kuhle 25 – Reference Mensink, Schwinghammer and Smeets 27 ). Recent evaluations of provincial school food policy activity in Canada have shown positive outcomes in terms of widespread provision of healthier beverages, improved food quality and reductions in students’ energy intake( Reference Fung, McIsaac and Kuhle 25 , Reference Watts, Mâsse and Naylor 26 ). In the ROI, food provision is decided at local level by school principals (head teachers) and local, independent school food operators( Reference Callaghan, Molcho and Nic Gabhainn 9 , Reference Browne, Barron and Susta 28 ). While national guidelines are available to schools to develop a healthy eating policy( 29 ), the adoption or implementation by schools is not widespread( Reference Callaghan, Molcho and Nic Gabhainn 9 , Reference Kelly, Clerkin and Nic Gabhainn 30 ). Secondary-school students have a number of options for food sourcing at lunchtime including: preparing their lunch at home and bringing it to school; purchasing lunch in cash-cafeteria or shop-style services at school; purchasing lunch on the way to school; going off campus at lunchtime (if permitted) to purchase their lunch ‘out’ in local food outlets; going home to eat lunch; or choosing not to eat at lunchtime.
While existing school food research demonstrates the impact different policies and practices have on food environments and student behaviours( Reference Adamson, Spence and Reed 22 – Reference Watts, Mâsse and Naylor 26 ), cultural differences relating to state and school policies, food environments, food sources and student behaviour norms can preclude the generalisation of findings between countries( Reference Héroux, Iannotti and Currie 12 ). To our knowledge, there is no published literature on the dietary choices Irish secondary-school students make in the school context or data to show where they source their school-day foods. In the present study, we examined school-day lunches of Irish secondary-school students and explored differences in energy, nutrient composition, nutrient density and food groups associated with three lunch sources, namely packed lunches from home, lunches purchased at school and lunches purchased ‘out’ in local food outlets.
Methods
Schools and participants
Food diary participants were involved in a larger, mixed-methods study examining the impact of the school setting on the quality of diet and physical activity of students. Schools that would represent the gender profiles of ROI secondary schools (male, female, mixed), geographical locations (urban/rural) and different socio-economic backgrounds were invited to participate. There was a poor response from some school types (large male-only schools and those in disadvantaged areas) and the study was unable to allocate further time and resources to recruiting additional schools. Participating schools, therefore, are a convenience sample of five Irish, public-system secondary schools. Participating schools included two single-sex schools, one male-only and one female-only, and one mixed-gender school in an urban area; and two single-sex schools, one male-only and one female-only, located in a regional town with a rural catchment area. Students from fourth year classes, aged 15–17 years, were eligible to participate in the study. Fourth year (or ‘transition year’) is an optional non-academic year offered by over 80 % of secondary schools in the ROI. The curriculum is focused on personal, social and community development and approximately 55 % of Irish students enroll in the programme( Reference Clerkin 31 ). Fourth year students were selected to participate as they are usually allowed to leave the school grounds, while more junior students may not be, and they have more time to become involved with research. Information sessions were held at school when students were provided with information letters, parental consent and student assent forms. Students, with their parents, agreed to participate on an opt-in basis by returning the form to the researcher or their form teacher. All students who participated were entered into a draw to win one of two tablet computers.
None of the participating schools were eligible for the state School Meals Scheme that provides funding to schools with children at risk of food poverty. Only schools that are designated ‘disadvantaged’ by the Department of Education and Skills can request such financial support for breakfast clubs and lunch schemes( 32 ). Participant socio-economic status was defined from home addresses using the Pobal HP deprivation index (a measure combining demographic profile, social class composition and labour market situation) from Irish census data 2011( Reference Haase and Pratschke 33 ). Only 4 % of participants lived in socially disadvantaged areas, with the remaining sample from very affluent (4 %), affluent (27 %), marginally above average (44 %) and marginally below average (21 %) socio-economic areas. It is estimated that 33·3 % of Irish children and adolescents currently experience socio-economic deprivation( 34 ), therefore there is a bias towards affluence in the study sample.
Dietary assessment
With permission, the ROOTS Adolescent Food Diary, previously used by Prynne and colleagues( Reference Prynne, Handford and Dunn 35 ), was used for data collection in the present study. The diary includes sections where, for each eating occasion, participants record the time of day, eating location, foods and beverages consumed, portions sizes of items consumed and food source. A dietetic researcher (S.B.) instructed participants on how to correctly complete food diaries. Participants were required to record all foods and drinks consumed over a 4 d period during the school term, including two weekdays and two weekend days. Students estimated portion sizes of foods and beverages consumed using household measures, manufacturers’ information and a food photographic atlas( Reference Nelson, Atkinson and Meyer 36 ). On completion, the dietetic researcher met with students to check diaries for potential inaccuracies. Accuracy of food records was assessed using the ratio of estimated energy intake (EEI) to estimated energy expenditure (EEE). Using a direct measure of participant body weight, BMR was calculated from Schofield’s equations( Reference Schofield 37 ) and total EEE was calculated as BMR×PAL (estimated physical activity level derived from self-reported activity diary)( Reference Black 38 ). Cut-offs from Black( Reference Black 38 ) were used to define under-reporters, accurate reporters and over-reporters: EEI:EEE<0·76, EEI:EEE=0·76–1·24 and EEI:EEE>1·24, respectively. One hundred and thirty-five (44 %) under-reporters were identified. Independent-samples t tests were undertaken to compare the mean energy, macronutrient and micronutrient contents of school-day lunches between under-reporters and accurate reporters. No significant differences (at significance level P<0·05) were observed with the exception of carbohydrate, which was significantly lower by 6 g in under-reporters (P<0·05). In light of non-significant differences for energy and the remaining nutrients, this was assumed to be spurious and under-reporters were included in the final analysis without adjustment. Four over-reporters were identified and included in the analysis.
Dietary information was coded and analysed using the nutritional software package NetWISP version 4.0 for Windows (Tinuviel Software, Warrington, UK), which is based on McCance and Widdowson’s The Composition of Foods. Three food source codes were used when coding lunch food items for data entry. The three food sources were: home, i.e. packed lunch prepared or obtained from home (=1); school, i.e. lunch purchased from the canteen, school shop or vending machine(s) during break or lunchtime (=2); and ‘out’, i.e. lunch purchased in outlets in the environment local to the school, such as shop, fast-food restaurant, café, deli or restaurant (=3). The energy, dietary fibre and selected nutrient contents of school-day lunches only were analysed, and comparisons made between home prepared, school purchased and ‘out’ purchased lunches. Sixty-nine students sourced their lunch from the same source on both school days. The remaining students obtained their lunch from more than one source on different school days and some consumed a packed lunch from home or a school purchased lunch at mid-morning break time, followed by a school or ‘out’ purchased lunch at midday break. All lunches were included in analysis; therefore, for the remaining participants, two (n students 181), three (n students 47) or four (n students 8) lunches were included in different categories. The decision to include meals defined by students as lunches but eaten at earlier break times was made as a means of representing available data fully in order to investigate the nutritional content of lunches by their source in line with the aim of the study. Eighteen lunches were excluded from analysis because they were consumed on a day when students were absent from school.
Statistical analysis
The statistical package ‘R’ was used for data analysis (R Foundation for Statistical Computing, Vienna, Austria, 2015). Analysis objectives were to: (i) compare mean nutrient intakes from home, school and ‘out’ lunches; (ii) compare the nutrient density, as a measure of the nutritional quality, of lunches sourced at home, school and ‘out’; and (iii) examine food group consumption by lunch source. Nutrient density for meal types is defined as the nutrient content of the meal (grams, milligrams or micrograms) per megajoule of energy in that meal. Differences between lunch sources for selected nutrients, nutrient densities and food groups were investigated using ANCOVA adjusted for gender, survey day and school. In order to examine where differences occurred between lunch sources (home, school and ‘out’), post hoc analyses were conducted using Tukey’s Honest Significant Difference test. P values (at 0·05 significance level) for both tests and 95 % confidence intervals for post hoc analyses are reported in the results.
Results
A response rate of 63 % (317/504 students) across five schools was obtained, with a mean age of 16·0 years (15·2–17·3 years); and 18·6 % of boys and 19·5 % of girls were categorised as overweight or obese according the International Obesity Task Force cut-offs( Reference Cole, Bellizzi and Flegal 39 ). Twelve diaries were returned incomplete, therefore school-day lunches from a total of 305 participants (ninety-two male, 213 female) were included in the study. Six hundred and fifteen lunches over two school days were analysed, with 61 % being packed lunches brought from home, 19 % purchased at school and 20 % purchased ‘out’ in local food outlets.
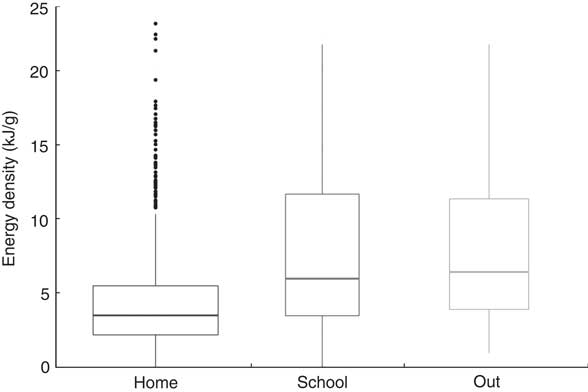
Figure 1 illustrates the significantly lower energy density, expressed as kilojoules per gram, of foods sourced from home compared with school and ‘out’. Table 1 shows the mean energy and nutrient values for each lunch source and results from ANCOVA and post hoc analyses. Honest Significant Difference tests showed that both school and ‘out’ lunches were significantly higher than home lunches in mean energy (home 1671 kJ (399 kcal), school 2047 kJ (489 kcal), ‘out’ 2664 kJ (627 kcal)), mean total fat (home 16·6 g, school 23·5 g, ‘out’ 30·1 g) and mean free (or added) sugars (home 7·4 g, school 12·6 g, ‘out’ 19·3 g). ‘Out’ lunches weighed significantly more than home lunches (327 g v. 224 g, respectively) and were higher than home and school lunches in mean carbohydrate (‘out’ 72·6 g, home 48·4 g, school 53·6 g), and higher than home lunches, but not school lunches, in mean starch (‘out’ 47·8 g, home 33·1 g), mean total sugars (‘out’ 23·1 g, home 15·0 g) and mean saturated fat content (‘out’ 10·3 g, home 6·2 g). School lunches were lower in dietary fibre (school 2·8 g, home 3·8 g, ‘out’ 3·8 g) and folate (school 22·9 g, home 34·4 g, ‘out’ 34·5 g) than home or ‘out’ lunches.
Box-and-whisker plots of energy density of lunch foods sourced from home (i.e. foods brought to school from home; n lunches 376), school (i.e. foods purchased in school and consumed at lunchtime; n lunches 115) and ‘out’ (i.e. foods purchased in shops, fast-food restaurants, cafés, delis and other outlets and consumed at lunchtime on school days; n lunches 124) on two school days among male and female 15–17-year-old secondary-school students in the Republic of Ireland, October 2012–March 2013. The width of the box is proportional to the number of observations (lunches from each source); the horizontal line within the box represents the median value; the bottom and top edge of the box represent the 25th and 75th centiles, respectively; the ends of the bottom and top whiskers represent the minimum and maximum values, respectively; and black bolded points are outliers. P value from ANCOVA: <0·0001. P values from Tukey’s Honest Significant Difference post hoc analysis show that the energy density of lunch foods from both school (P<0·0001) and ‘out’ (P<0·0001) was significantly greater than that of lunch foods from home
Mean and sd food weight, energy and nutrient intakes of lunches on school days for home, school and ‘out’ food and beverage sources among male and female 15–17-year-old secondary-school students in the Republic of Ireland, October 2012–March 2013
Free sugars=monosaccharides and disaccharides added to foods and beverages by the manufacturer, cook or consumer, and sugars naturally present in honey, syrups, fruit juices and fruit juice concentrates( 46 ).
* UK Nutrient-based standards for co-educational school lunches( 47 ).
† ANCOVA comparing mean intakes of energy, nutrients and macronutrients expressed as a percentage of lunch energy, adjusted for sex, survey day and school.
‡ Tukey’s Honest Significant Difference post hoc analysis.
Mean nutrient density results for each lunch source are detailed in Table 2. In comparison with the average home lunch, both school and ‘out’ lunches had a significantly higher density of total fat and free sugars, and a lower density of dietary fibre, Na, Fe and folate. The average school lunch had higher densities of saturated fat and carbohydrate and a lower density of vitamin C per megajoule than home lunches, which were not significantly different for ‘out’ (Table 2).
Mean and sd energy intake and nutrient density of lunches on school days by home, school and ‘out’ sources for male and female 15–17-year-old secondary-school students in the Republic of Ireland, October 2012–March 2013
* ANCOVA comparing mean intake of energy and nutrient density (g, mg or µg per MJ) adjusted for sex, survey day and school.
† Tukey’s Honest Significant Difference post hoc analysis: multiple comparison of means.
Table 3 describes the food groups consumed by students from each source of lunch and compares mean food weights by source. There were more consumers of meat products, chips and high-calorie beverages, and fewer consumers of fruit, wholemeal breads, cheese and red meat from school and ‘out’ sources compared with home, while more biscuits, cakes and savoury snacks were sourced from home than from school or ‘out’. Confectionery items as part of lunch were sourced equally from home, school and ‘out’; however, the portion sizes were significantly higher in ‘out’-sourced lunches compared with school and home (‘out’ 58 g v. home 36 (95 % CI 11, 35) g and school 42 (95 % CI 2, 32) g). White bread and rolls were equally popular from all sources with a mean portion size from ‘out’ significantly greater than from home, but not school (‘out’ 85 g v. home 70 (95 % CI 5, 23) g). Portion sizes of meat products sourced from school and ‘out’ were significantly larger than from home (‘out’ 106 g v. home 67 (95 % CI 20, 57) g; school 96 g, v. home 67 (95 % CI 8, 50) g). A similar finding was observed for butter, spreads and fats (‘out’ 20 g v. home 13 (95 % CI 3·7, 8·8) g; school 18 g v. home 13 (95 % CI 1·6, 6·8) g).
Mean and sd weight (grams) of food groups contributing to lunch from home, school and ‘out’ sources, with frequency and percentage of consumers for each food group, by lunch source, for male and female 15–17-year-old secondary-school students in the Republic of Ireland, October 2012–March 2013
NP, analysis not performed (when n consumers <5 in any group).
Lunch sources: home, mean and sd of food groups brought to school from home; school, mean and sd of food groups purchased at school and consumed at lunchtime; ‘out’, mean and sd of food groups purchased in shops, fast-food restaurants, cafés, delis and other outlets and consumed at lunchtime on school days.
* ANCOVA comparing mean food weight between sources adjusted for sex, survey and school.
† Tukey’s Honest Significant Difference post hoc analysis: multiple comparison of means.
Discussion
The present study found that while the majority of lunches consumed were packed lunches from home, Irish secondary-school students also commonly sourced lunches from school or local food outlets over two school days. School- and ‘out’-sourced lunches, therefore, were relevant to the majority of students at least one day of the week. Given the focus of public health messages on reducing foods high in energy, fat and free sugars( 2 – 4 ), findings here raise concerns about non-home sourced foods on school days. Local food outlets were associated with larger portions of white breads and rolls, meat products and confectionery compared with home- and school-sourced lunches, while school and ‘out’ lunches were both significantly more sugar- and fat-dense than home lunches. In contrast, home was a more common source of fibre, wholemeal breads and rolls, red meat and fruit. The absence of these more nutrient-dense foods from school and ‘out’ lunches raises questions about food choice, the nature of students’ purchasing behaviours in these environments and unhealthy food exposure during the school day. While the availability of less healthy options may be expected from local food outlets, the provision of these foods in the school environment is not considered acceptable( 2 – 4 ). The study also highlights that the nutritional quality of school lunches from all sources could improve as, regardless of source, school-day lunches were low in fibre and micronutrients and high in Na.
It is interesting to compare the current study’s results with school lunch research in the UK because our findings comparing school and home lunches are, for most nutrients, in contrast to comparisons there. In the first instance school lunches are more commonly consumed in the UK than in the ROI, and in some studies more commonly than packed lunches from home( Reference Pearce, Wood and Nelson 23 , Reference Stevens, Nicholas and Wood 24 ). Since the introduction of new School Food Standards from 2007 across the UK, school-sourced lunches are healthier than packed lunches from home( Reference Pearce, Wood and Nelson 23 , Reference Stevens, Nicholas and Wood 24 ). Among 11–16-year-olds, school lunches had better macronutrient compositions, and were higher in dietary fibre and micronutrients including vitamin C, folate, Fe and Zn, than packed lunches from home( Reference Pearce, Wood and Nelson 23 , Reference Stevens, Nicholas and Wood 24 ). An earlier study by Prynne and colleagues reported similar findings for the quality of school and home lunches, with the exception of higher saturated fat and Na in school lunches( Reference Prynne, Handford and Dunn 35 ). A similarity between the current study and others is that school lunches were higher than home lunches in total energy, although the extent of the differences in UK studies cited varied( Reference Pearce, Wood and Nelson 23 , Reference Stevens, Nicholas and Wood 24 , Reference Prynne, Handford and Dunn 35 ). For the UK it may be expected that school lunches would be higher in energy because a school dinner, which allows for 2700 kJ (645 kcal) per lunch, is provided. In contrast, in the ROI hot dinners are not typically provided at school and lunch foods are based more on snacks and finger foods (e.g. filled sandwiches or rolls). Restrictions on the sale of foods outside the school meal programme, including confectionery, soft drinks and savoury snacks, have also been introduced in UK schools, and the impact of this is that home lunches are now the major source of these foods( Reference Adamson, Spence and Reed 22 ). The energy contribution made by school lunch foods is now more nutrient-dense as foods high in fat, sugar and/or salt are limited. Although home was a source of confectionery and savoury snacks in the current study, the impact on mean intakes of free sugars and fat was lower, which was explained by higher free-sugar density associated with school and ‘out’ lunches compared with home, lower numbers of high-calorie beverage consumers from home and smaller portion sizes of home-sourced confectionery compared with school and ‘out’. It has been suggested that when low-nutrient, energy-dense foods are restricted at school, students will source them from other places, including home( Reference Prynne, Handford and Dunn 35 , Reference Gilmore, Gossrau-Breen and MacDonald 40 ). The relevance of food from home and, to a lesser extent, the local environment is evident in the current study. These sources dilute the potential impact of school food policies because restricting foods from home and local food outlets is challenging. Local food outlets are particularly relevant and potentially influential for older adolescents because they have greater freedom of movement during lunchtime on school days than younger children( Reference Gilmore, Gossrau-Breen and MacDonald 40 ).
Despite this, making the healthy choice the easy choice remains the responsibility of the school setting and the health promotion, education and behaviour change opportunities of healthy school food environments are well documented( Reference Wechsler, Devereaux and Davis 1 , 2 , Reference Adamson, Spence and Reed 22 , Reference Nelson and Breda 41 ). The implementation of school food policy is relevant even in the absence of a state school meal programme. Provincial school food and beverage policies in Canada, for example, have had an impact in terms of reducing the availability of sugar-sweetened beverages, French fries and confectionery available within schools( Reference Fung, McIsaac and Kuhle 25 , Reference Watts, Mâsse and Naylor 26 ); and a ‘Healthy School Canteen’ initiative in Dutch schools has improved the food environment, healthy eating curriculum and school food policy in the majority of participating schools( Reference Mensink, Schwinghammer and Smeets 27 ).
For our participants, food from the local environment was as influential as the school setting food because students were accessing both sources equally. There is a growing body of evidence globally showing easy access to fast food in the retail environments close to schools( Reference Callaghan, Molcho and Nic Gabhainn 9 , Reference Virtanen, Kivimäki and Ervasti 11 – Reference Davis and Carpenter 13 ). Close proximity to school (within 1 km) increases the likelihood of fast-food purchases( Reference Templeton, Marlette and Panemangalore 19 ) and can have a negative impact on overall diet quality in terms of low fruit and vegetable and high fat and sugar consumption( Reference Smith, Cummins and Clark 21 ). A Scottish survey has highlighted that supermarkets, sandwich shops, bakeries and newsagents, rather than fast-food outlets, were the most popular source of foods for secondary-school students outside school at lunchtime( Reference Macdiarmid, Wills and Masson 42 ). This may be relevant for the Irish context in the light of recent research showing an average of 6·71 local shops within 1 km of schools compared with 4·03 fast-food restaurants( Reference Callaghan, Molcho and Nic Gabhainn 9 ). Qualitative interviews with students, teachers and principals, and observations by students as part of wider research with schools in the current study found that local or chain convenience shops were the most common destinations for students at lunchtime (S Browne, C Barron, MR Sweeney et al.,unpublished results). Future research that examines participant characteristics in the context of food outlet types would be of use given the dominance of literature focusing on fast food, rather than other outlets such as convenience shops. Like food from home, food from local outlets poses a major barrier to the success of school policies to improve the dietary behaviours of secondary-school students( Reference Gilmore, Gossrau-Breen and MacDonald 40 ). The current study highlights that while home was the dominant source of school lunches, school and local food outlets were common sources for participants. School food policies and practices that are limited to foods sold at school, therefore, will also have limited potential in terms of influencing the dietary behaviours of students.
A number of limitations are acknowledged when interpreting findings in the present study. Participants were recruited from a convenience sample of schools and do not represent the socio-economic, geographic and gender spread of Irish adolescents. The sample was relatively affluent and this may have influenced the content of packed lunches from home, as well as the financial means to purchase lunch in school or locally. Lack of information about non-responders is a source of bias and the over-representation of girls compared with boys may have influenced the results in terms of food sourcing and nutrient and food consumption. Boys’ schools had a smaller student body than girls’ schools and there was a poorer response rate among boys compared with girls. It should also be acknowledged that students were enrolled in an optional non-academic programme that approximately 45 % of secondary school students opt not to enrol in( Reference Clerkin 31 ) and this may give rise to unknown sociodemographic bias in the sample. The proportion of under-reporters is consistent with other dietary surveys with adolescents( Reference O’Connor, Walton and Flynn 43 , Reference Brandini, Must and Cyr 44 ), and Brandini and colleagues( Reference Brandini, Must and Cyr 44 ) have demonstrated longitudinally that accuracy of reported energy intake among girls, in particular, declines from childhood into adolescence. With high levels of under-reporting for the 4 d diary we would have expected significant differences in energy and nutrient composition of school-day lunches between under-reporters and accurate reporters( Reference Macdiarmid and Blundell 45 ), which were not found. This may indicate inaccuracies at other periods of the food diary, for example in the evenings or on weekend days when routine is less structured. Busy or irregular lifestyles can explain some of the intentional (e.g. altering eating habits) and unintentional under-reporting (e.g. forgetting to record items) in food surveys( Reference Macdiarmid and Blundell 45 ). The structure associated with meals on school days may have improved recording, and is a possible explanation for agreement between the energy and nutrient intakes of accurate reporters and under-reporters. The current study was unable to determine how participant characteristics and school food practices influenced lunch sources and food choice. Although the aim of the study was to understand the nutritional quality associated with lunch sources, the inclusion of some participants in two or three lunch source categories should also be acknowledged when interpreting these results.
To our knowledge, the present study is the first to investigate the sources and nutritional content of school lunches in secondary schools in the ROI. Packed lunches brought from home were the most common and had the healthiest nutritional profile in terms of energy and macronutrients. However, all sources of school-day lunches were below dietary fibre and micronutrient recommendations for a healthy lunch. The study provides evidence for initiatives that support packed lunches from home and the need to introduce policy and regulation for school food and lunchtime activities. Education and awareness among schools, students and parents about the benefits of home lunches and the potential for improvement may be relevant to a large proportion of Irish students. The literature demonstrates that the school food environment is a modifiable factor that can be addressed through state and local policies. The impact of foods from outlets close to schools on the nutritional content of students’ lunches is under-researched in all jurisdictions and findings here provide evidence of a significant negative impact. Policies that minimise student exposure to unhealthy food environments should be considered for secondary schools in light of these results.
Acknowledgements
Acknowledgements: The authors wish to thank the schools and students for their participation. Financial support: This work was supported by a PhD scholarship bursary from the School Nursing and Human Sciences, Dublin City University. This research received no specific grant from any funding agency in the public, commercial or not-for-profit sectors. Conflict of interest: None. Authorship: S.B. is a dietitian and PhD researcher and this research is part of her postgraduate studies; she was involved in study design, fieldwork, data analysis and writing the article. A.S. is an epidemiologist and the co-supervisor to S.B.’s PhD project; and was involved in study design, data analysis and writing the article. C.B. is a child health research advisor to the project and was involved in study design, fieldwork and reviewing the article. D.S. is a research team member and was involved in study design, fieldwork and reviewing the article. V.L. is a child health research advisor to the project and was involved in study design, fieldwork and reviewing the article. M.R.S. is the principal investigator and supervisor to S.B.’s PhD project; and was involved in study design, fieldwork, data analysis and writing the article. Ethics of human subject participation: This study was conducted according to the guidelines laid down in the Declaration of Helsinki and all procedures involving human subjects/patients were approved by the Dublin City University Research Ethics Committee. Written informed consent was obtained from all participants and their parent(s)/guardian(s).


