Diabetes, a major public health problem, is affecting 422 million people based on reports of the WHO(1). Global Burden of Disease 2050 identified that total diabetes prevalence (diagnosed and undiagnosed cases) is projected to increase from 14 % in 2010 to 21 % of the US adult(Reference Boyle, Thompson and Gregg2). The greatest increase in rates will be seen in low- and middle-income countries, where more than 80 % of diabetic deaths occur(Reference Fuster, Kelly and Vedanthan3). Diabetes is associated with significant disability, increased dependency, reduced quality of life and increased economic burden to healthcare system(Reference Dall, Yang and Halder4,Reference Deshpande, Harris-Hayes and Schootman5) .
Weight loss, regular physical activity and several dietary strategies have been described for better management of diabetes(Reference Asif6,Reference Colberg, Sigal and Fernhall7) . Walnut is a nutrient-dense low glycaemic index food, rich in nutrients, minerals, antioxidants and vitamins. They contain relatively large amounts of monounsaturated fatty acid (MUFA) and PUFA, particularly α-linolenic acid and linoleic acid(Reference de Souza, Schincaglia and Pimentel8,Reference Ros9) . Diets rich in MUFA and PUFA have favourable effects on cardiometabolic health(Reference Schwab, Lauritzen and Tholstrup10). Earlier studies have shown that consumption of these fatty acids resulted in weight loss, reduced belly fat, reduced cholesterol levels and reduced risk of heart disease and stroke(Reference Katz, Davidhi and Ma11–Reference Tapsell, Gillen and Patch15). Previous meta-analyses were designed for different purposes, health status, cardiometabolic parameters and even different kind of nuts(Reference Katz, Davidhi and Ma11–Reference Tapsell, Gillen and Patch15). In addition, walnut is a satiating food with the potential to reduce energetic intake and weight control, through which they might help controlling diabetes(Reference Brennan, Sweeney and Liu16). Although some studies have reported the beneficial effects of walnut consumption on cardiometabolic profiles in diabetes, the findings in this regard are conflicting. Katz et al. reported no improvement in glycaemic control of forty-six pre-diabetic people following daily intake of 56 g walnut for 2 months(Reference Katz, Davidhi and Ma11). In a randomised crossover controlled trial, Ma et al. did not find any significant effects of daily walnut consumption for 2 months on cardiometabolic profiles of diabetic subjects(Reference Ma, Njike and Millet17). Despite these contradictions, we are not aware of any earlier study that summarised findings from previous publications in patient with abnormal glucose homoeostasis. This study was, therefore, performed to comprehensively review previous clinical trials about the effects of walnut consumption on cardiometabolic profiles of individuals with abnormal glucose homoeostasis to summarise earlier findings through a meta-analysis.
Materials and methods
This systematic review and meta-analysis was performed based on the Preferred Reporting Items for Systematic Reviews and Meta-analysis guideline and submitted in PROSPERO (CRD42019121890).
Search strategy
Previous studies on the effect of walnut consumption on cardiometabolic profiles in individuals with abnormal glucose homoeostasis were selected through searching in Medline/PubMed, ISI web of Science, EMBASE, SCOPUS and Google Scholar prior to October 2020. We used the following keywords in our search: (walnut OR nut OR juglans OR pecan OR carya) AND (‘diabetes mellitus’ OR diabetes OR pre-diabetes OR diabetic OR ‘abnormal glucose homeostasis’ OR ‘abnormal glucose tolerance’ OR ‘glucose tolerance’ OR ‘glucose homeostasis’ OR ‘glucose intolerance’ OR hyperglycemia OR ‘glycemic control’ OR ‘insulin resistance’ OR ‘blood glucose’ OR ‘blood sugar’ OR ‘fasting blood glucose’ OR ‘fasting plasma glucose’ OR ‘body weight’ OR overweight OR obesity OR ‘body mass index’ OR BMI OR ‘abdominal obesity’ OR ‘morbid obesity’ OR ‘Waist Circumference’ OR ‘Waist-Hip Ratio’ OR ‘Body Fat Distribution’ OR ‘LDL cholesterol’ OR LDL OR ‘HDL cholesterol’ OR HDL OR ‘VLDL cholesterol’ OR VLDL OR triglyceride OR TG OR ‘total cholesterol’ OR cholesterol OR hyperlipidemia OR ‘abnormal lipid profile’ OR ‘lipid profile’ OR ‘blood pressure’ OR hypertension OR ‘abnormal blood pressure’ OR ‘high blood pressure’ OR ‘endothelial function’ OR endothelium OR ‘abnormal endothelial function’ OR ‘endothelial dysfunction’). In PubMed, keywords were searched through (tiab) and (MeSH) tags. No limitation was applied during the search. The reference lists of retrieved papers were also examined to avoid missing any published data.
Inclusion criteria
Two investigators independently selected the articles through the mentioned search strategy. Publications that fulfilled the following criteria were eligible for inclusion: (1) randomised trials that enrolled individuals with abnormal glucose homoeostasis; (2) studies in which the main intervention was consumption of walnuts and (3) trials that reported the required effect sizes for performing meta-analysis. Abnormal glucose homoeostasis was defined as a spectrum of impaired glucose tolerance or pre-diabetic status (individuals with the metabolic syndrome or polycystic ovary syndrome or obesity with fasting glucose level between 110 and 125 mg/dl) that is associated with insulin resistance as well as diagnosed type II diabetes mellitus (fasting glucose higher than 126 mg/dl or the use of orally administered antihyperglycaemic agents); (4) cardiometabolic indices such as weight, BMI, waist circumference (WC), TAG, total cholesterol, LDL-cholesterol, HDL-cholesterol, fasting blood glucose, HbA1C, systolic blood pressure, diastolic blood pressure, flow-mediated dilation (FMD) and stimulus-adjusted response measure (SARM) were considered.
Exclusion criteria
We excluded letters, comments, reviews, meta-analyses, ecological and animal studies. In total, 5207 articles were found in our initial search. After screening, 5055 studies were excluded on the basis of title and abstract. We further excluded 140 papers because of the following reasons: (1) those that examined the effect of walnut consumption in healthy or hyperlipidaemic subjects (n 35); (2) publications in which no effect sizes were reported (n 5); (3) those that examined the effect of total dietary patterns or Mediterranean dietary pattern rather than walnut consumption alone (n 15); (4) studies that examined intakes of mixed nuts rather than walnuts (n 19); (5) documents that assessed the effects of walnut oil or walnut leaf extract consumption (n 18) and (6) those that had observational design (cohort, case–control or cross-sectional design) (n 48). After these exclusions, fourteen papers remained for the current systematic review.
However, as publications by Schutte et al. (2006) and Mukuddem-petersen (2007) had reported findings of the same study, we only included the latter study in our analysis. This was the case for most variables of interest, but for BMI and WC, Mukuddem-petersen (2007) did not report any findings, while Schutte et al. (2006) had reported. Therefore, we extracted data for BMI and WC from the study of Schutte et al. (2006). In addition, the study of Tapsell et al. (2004) and Tapsell et al. (2009) had been done on the same participants. Therefore, we excluded the document published in 2004 and included the one published in 2009. Again, BMI was only reported in Tapsell et al. (2004) and not in Tapsell et al. (2009). Therefore, with regard to BMI, we used data from Tapsell et al. (2004). The study of Kalgoanker et al. (2011) had no control group and we excluded this publication from the meta-analysis. The duration of intervention in the study of Brennan et al. (2010) was only 4 d. Therefore, we excluded this study from the meta-analysis due to its very short intervention as well as very different design from other publications. After these exclusions, eight papers remained for the current meta-analysis (Fig. 1).
The flow diagram of study selection.

Data extraction
For each eligible study, the following information was extracted: first author, year of publication, study design, country, age range, sex, sample size (number of participants in each group), participants’ health status, type of intervention, duration of intervention, the dose of walnut intake in intervention group, assessment of compliance, outcome variables and their assessment method, mean change and standard deviation of the cardiometabolic factors in intervention and control groups and covariates adjusted for.
Quality assessment
The Cochrane Collaboration Risk of Bias tool was used to assess the quality of all relevant randomised controlled trials based on the following domains: random sequence generation, allocation concealment, blinding of participants and outcome assessment, incomplete outcome data, selective outcome reporting and other sources of bias.
Statistical methods
Mean differences and sd of anthropometric measures as well as cardiometabolic parameters, comparing walnut consumption with control diets, were used to calculate the overall effect sizes. When mean differences and sd were not reported, we calculated them by considering changes in each parameter throughout the study. Some studies reported mean differences and 95 % CI. We converted 95 % CI to sd using relevant formulas. In addition, weight, fasting blood glucose concentrations and levels of lipid profiles were reported in different units across the studies. We converted them to the same units. The overall effect size was calculated using a random effects model, which takes between-study variation into account. Cochran’s Q test and I 2 statistic were used to assess between-study heterogeneity. In addition, we used subgroup analysis to detect probable sources of heterogeneity with the use of a fixed effects model. Subgroup analysis was performed based on participants’ conditions (the metabolic syndrome v. type II diabetes), type of dietary intervention (restricted diets v. ad libitum diet), duration of intervention (more than 6 months v. less than 6 months), location (USA v. others) and dosage of intervention (more than 56 g v. less than 56 g). Restricted diet was defined as a diet limited in energy or fat. Sensitivity analysis was used to explore the extent to which inferences might depend on a particular study or group of studies. Publication bias was examined by visual inspection of funnel plots and the application of Egger’s and Begg’s tests. All statistical analyses were conducted using Stata, version 14·2 (StataCorp). P values < 0·05 were considered significant.
Results
Findings of systematic review
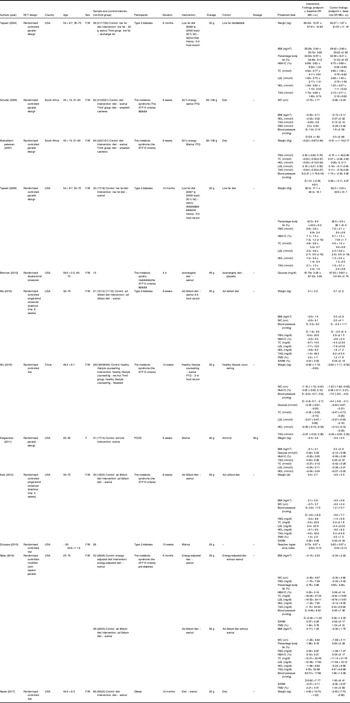
Characteristics of twelve studies on the effect of walnut consumption on cardiometabolic profiles in individuals with abnormal glucose homoeostasis are presented in Table 1. These studies were published between 2004 and 2017. Nine publications were reported from American countries(Reference Katz, Davidhi and Ma11,Reference Neale, Tapsell and Guan12,Reference Tapsell, Batterham and Tan14–Reference Djousse, Petrone and Gaziano20) , two from South Africa(Reference Mukuddem-Petersen, Stonehouse Oosthuizen and Jerling21,Reference Schutte, Van Rooyen and Huisman22) and the other one from China(Reference Wu, Pan and Yu23). Age of participants was between 20 and 75 years. All studies were done on both sexes, except for one study that considered only women(Reference Kalgaonkar, Almario and Gurusinghe18). Sample sizes varied from eleven to ninety-four in the intervention group and twelve to ninety-five in the control group. In six studies, participants had the metabolic syndrome(Reference Katz, Davidhi and Ma11,Reference Brennan, Sweeney and Liu16,Reference Njike, Yarandi and Petraro19,Reference Mukuddem-Petersen, Stonehouse Oosthuizen and Jerling21–Reference Wu, Pan and Yu23) , four were done on type II diabetics(Reference Tapsell, Batterham and Tan14,Reference Tapsell, Gillen and Patch15,Reference Ma, Njike and Millet17,Reference Djousse, Petrone and Gaziano20) , one on women with polycystic ovary syndrome(Reference Kalgaonkar, Almario and Gurusinghe18) and the other one on obese people(Reference Neale, Tapsell and Guan12). Duration of intervention was varied from 4 d to 12 months. Two studies had only recommended daily walnut consumption without any dietary recommendations(Reference Kalgaonkar, Almario and Gurusinghe18,Reference Djousse, Petrone and Gaziano20) , while other studies had dietary recommendation with amount of walnut intervention. The amount of walnut varied from 26 to 108 g/d across studies. Nine of previous publications reported data of HDL-cholesterol and TAG, eight about weight, fasting blood glucose, LDL-cholesterol and total cholesterol, six about BMI, HbA1C and blood pressure, five about WC, four about SARM and three about percentage of body fat and FMD. Findings of nine of previous articles in different parameters were significant. Almost all included studies had high quality levels based on used the Cochrane Collaboration Risk of Bias tool. Details of publications’ findings are reported in Table 1.
Characteristics of studies included in the systematic review

PCOS, polycystic ovary syndrome; TC, total cholesterol; WC, waist circumference; FBG, fasting blood glucose; FMD, flow-mediated dilation; SARM, stimulus-adjusted response measure.
Findings in red colour were significant P value < 0.05.
Findings of meta-analysis
Anthropometric measurements
Combining effect sizes from six studies, we found no significant effect of walnut consumption on weight (weighted mean difference (WMD): –0·13 kg; 95 % CI –0·64, 0·39 kg, P = 0·628, I 2 = 42·3 %) and BMI (WMD: –0·08 kg/m2; 95 % CI –0·47, 0·32 kg/m2, P = 0·704, I 2 = 95·7 %). In addition, walnut intake did not influence WC, pooling six effect sizes from five studies (WMD: 0·01 cm; 95 % CI –0·50, 0·52 cm, P = 0·966, I 2 = 0·0 %) (Fig. 2). In an analysis to find the source of heterogeneity, we observed that participants’ conditions and type of dietary intervention explained the source of heterogeneity; such that walnut consumption reduced BMI in type II diabetic patients (WMD: –0·66 kg/m2; 95 % CI –0·74, –0·57 kg/m2, P < 0·0001) and restricted dietary approach (WMD: –0·31 kg/m2; 95 % CI –0·82, –0·20 kg/m2, P < 0·0001) (Table 2).
Forest plots for the effect of walnut consumption on (a) weight, (b) BMI and (c) waist circumference, expressed as mean differences between intervention and the control diets.

Results of subgroup analysis for the effect of walnut consumption on BMI
(Mean differences and 95 % confidence intervals)

Lipid profiles
Combining effect sizes from six studies, we did not find any significant effect of walnut intake on lipid profiles; including TAG (WMD: 0·02 mmol/l; 95 % CI –0·14, 0·18 mmol/l, P = 0·79, I 2 = 46·9 %), total cholesterol (WMD: 0·05 mmol/l; 95 % CI –0·10, 0·19 mmol/l, P = 0·52, I 2 = 38·6 %), HDL-cholesterol levels (WMD: –0·03 mmol/l; 95 % CI –0·07, 0·02 mmol/l, P = 0·21, I 2 = 0·0 %); however, a trend towards significant effect on LDL-cholesterol was observed (WMD: –0·10 mmol/l; 95 % CI –0·20, 0·01 mmol/l, P = 0·06; I 2 = 23·9 %) (Fig. 3). We performed subgroup analysis to investigate the source of heterogeneity. Location, duration of intervention, participants’ conditions and type of dietary intervention explained between-study heterogeneity; such that walnut consumption reduced LDL-cholesterol in studies from the USA (WMD: –0·15 mmol/l; 95 % CI –0·24, –0·07 mmol/l, P < 0·0001, I 2 = 0·0 %), those with a more than 6 months of intervention (WMD: –0·18 mmol/l; 95 % CI –0·25, –0·11 mmol/l, P < 0·0001, I 2 = 1·9 %), studies performed on diabetic patients (WMD: –0·18 mmol/l; 95 % CI –0·30, –0·05 mmol/l, P = 0·008, I 2 = 19·0 %) and studies that used a restricted dietary approach (WMD: –0·19 mmol/l; 95 % CI –0·26, –0·12 mmol/l, P < 0·0001, I 2 = 0·0 %) (Table 3).
Forest plots for the effect of walnut consumption on (a) TAG, (b) total cholesterol, (c) LDL-cholesterol and (d) HDL-cholesterol, expressed as mean differences between intervention and the control diets.

Results of subgroup analysis for the effect of walnut consumption on lipid profile
(Mean differences and 95 % confidence intervals)

Other cardiometabolic factors
Combining seven effect sizes, we found that walnut consumption did not significantly influence on fasting plasma glucose (WMD: −0·04 mmol/l; 95 % CI −0·30, 0·21 mmol/l, P = 0·73, I 2 = 74·6 %) and HbA1C levels (WMD: 0·02 %; 95 % CI −0·04, 0·07 %, P = 0·59, I 2 = 0·0 %) (Fig. 4). To investigate the source of heterogeneity, we performed subgroup analysis. Despite lack of a significant effect on glycaemic indices in any subgroup, participants’ conditions and type of dietary intervention explained between-study heterogeneity (Table 4).
Forest plots for the effect of walnut consumption on (a) fasting blood glucose concentrations and (b) HbA1C, expressed as mean differences between intervention and the control diets.

Results of subgroup analysis for the effect of walnut consumption on fasting blood glucose
(Mean differences and 95 % confidence intervals)

In terms of blood pressure, walnut intake did not affect systolic (WMD: −0·66 mmHg; 95 % CI −3·28, 1·96 mmHg, P = 0·62, I 2 = 19·7 %) and diastolic blood pressure (WMD: 0·44 mmHg; 95 % CI −1·27, 2·14 mmHg, P = 0·62, I 2 = 0·0 %) when we pooled six effect sizes from five studies (Fig. 5). However, walnut intake significantly increased FMD (WMD: 0·94 %; 95 % CI 0·16, 1·71 %, P = 0·019, I 2 = 0·0 %,). Combining four effect sizes from three studies, we failed to find any significant effect of walnut consumption on SARM (WMD: 0·01 %; 95 % CI −0·01, 0·04 %, P = 0·24, I 2 = 0·0 %) (Fig. 6). Endothelial function was measured as flow dilation (FMD), the percentage change in the diameter of the brachial artery from before the cuff swelling to 60 s after the cuff release. In addition to the arm diameter at 60 s after cuff release, the current after the cuff inflated for the first 15 s was used as an indicator of stimulus strength, the overflow current was the stimulus for endothelial reactivity. To account for potential variability in stimulus strength, FMD was divided by flow at 15 s after cuff deflation to create a SARM(Reference Ma, Njike and Millet17).
Forest plots for the effect of walnut consumption on (a) systolic blood pressure and (b) diastolic blood pressure, expressed as mean differences between intervention and the control diets.

Forest plots for the effect of walnut consumption on (a) flow-mediated dilation and (b) stimulus-adjusted response measure, expressed as mean differences between intervention and the control diets.

Sensitivity analysis
To investigate the influence of each individual study on the overall findings, we excluded studies from the analysis, stage by stage and found no significant impact of any individual study on the overall effect sizes.
Publication bias
The funnel plots indicated moderate asymmetry, suggesting that publication bias cannot be completely excluded as a factor of influence on the present meta-analysis (data not shown). However, the Begg’s and Egger’s regression tests provided no evidence of substantial publication bias.
Discussion
In the current meta-analysis, we failed to find any significant effect of walnut intake on cardiometabolic profiles, including anthropometric measures, lipid profile, glycaemic status, blood pressure and SARM in individuals with abnormal glucose homoeostasis. However, walnut consumption resulted in increased FMD in these individuals.
Walnut is a low glycaemic index nutrient-dense food with a relatively high content of MUFA and PUFA(Reference Nelson24), Mg and dietary fibre. Diets rich in such nutrients have been reported to influence cardiometabolic health(Reference Schwab, Lauritzen and Tholstrup10,Reference Siri-Tarino, Chiu and Bergeron25) . Due to effects of walnut consumption on appetite and specialist effects of MUFA and PUFA consumption, walnut intake might be useful to reduce body weight in diabetic patients. In other diseases such as the metabolic syndrome or polycystic ovary syndrome, complicated hormonal status and inflammatory condition might be a reason for having none effects. Summarising earlier findings, we reached no significant effect of walnut intake on anthropometric measures in individuals with abnormal glucose homoeostasis. However, when we limited the analysis to studies done on type II diabetes patients or individuals who consumed walnut-rich energy-restricted diets, we found a significant reducing effect of walnut consumption on weight and BMI. Such findings were also reported from observational studies as well as some clinical trials done on healthy subjects(Reference Li, Li and Yuan26–Reference Bes-Rastrollo, Wedick and Martinez-Gonzalez29). This finding suggests that walnut can be included in the dietary plans of diabetic patients in an effort to control body weight.
In terms of lipid profiles, we found no significant effect of walnut consumption; however, individuals in the intervention group tended to have lower levels of LDL-cholesterol after walnut consumption. The effect of walnut consumption on serum LDL levels was evident in studies conducted in the USA, those with a more than 6 months of intervention, investigations performed on diabetics or individuals who consumed walnut within the context of a restricted diet. Earlier clinical trials that have been done on healthy or hyperlipidaemic subjects revealed a significant effect of walnut intake on cholesterol levels(Reference Zibaeenezhad, Shamsnia and Khorasani30–Reference Zambon, Campero and Perez-Heras33). It seems that duration of intervention and dosage of walnut intake are two important factors that determine the effect of walnut intake on lipid profiles. In addition, consumption of walnuts in the context of unhealthy diets, like the Western diet with high contents of SFA and low contents of PUFA and MUFA, might also influence on the lipid-lowering properties of this beneficial food.
In this meta-analysis, indicators of glycaemic control and blood pressure were not affected by walnut consumption. Although these findings were in agreement with some publications in diabetic patients(Reference Rabiei, Ebrahimzadeh and Saeedi13,Reference Zibaeenezhad, Aghasadeghi and Hakimi34) , the studies in healthy or hyperlipidaemic patients have reported significant beneficial effects of walnut consumption on these variables(Reference Sabate, Fraser and Burke35). Diabetic patients mostly follow a healthy dietary pattern in an effort to control their glycaemic status. In addition, they might use glucose-lowering medications that result in decreasing blood pressure. Therefore, in these patients the effect of walnut consumption on glycaemic status and blood pressure might be difficult to be detected.
Endothelial function is important in predicting the risk of cardiovascular events. Flow-mediated dilatation is the most common method for assessment of endothelial function. In this meta-analysis, FMD was significantly increased by walnut consumption. This finding was in line with a recent meta-analysis that indicated nut consumption significantly affected FMD(Reference Xiao, Huang and Peng36). This might be attributed to the micronutrient content of walnuts, as well as n-3 fatty acids, l-arginine and polyphenols. Dietary n-3 fatty acid intake was inversely associated with the incidence of CVD. n-3 fatty acids, with their anti-inflammatory effects, prevent the formation of pathological blood clots and reduce oxidative stress(Reference Zehr and Walker37). l-Arginine content of walnuts is known to improve vascular function through conversion to nitric oxide, a potent vasodilator agent(Reference Preli, Klein and Herrington38–Reference Lorin, Zeller and Guilland40). In addition, polyphenols in walnut bind to lipoproteins, through which they inhibit oxidative stress and lead to better function of vessels endothelium(Reference Vinson and Cai41,Reference Cheng, Sheen and Hu42) .
This study had some strengths and limitations. Based on our knowledge, this is the first comprehensive systematic review and meta-analysis that examined the effects of walnut consumption on cardiometabolic profiles in individuals with abnormal glucose homoeostasis. We also did subgroup analysis based on several available variables to find the source of heterogeneity. However, some points need to be considered. Administration of walnuts in the framework of different types of dietary interventions should be taken into account. The amount of walnut consumption across different studies varied. Although we confined this study to individuals with abnormal glucose homoeostasis, participants had different health status from the metabolic syndrome or obesity to verified type II diabetes.
In conclusion, we found that walnut consumption might influence FMD and LDL-cholesterol levels in individuals with abnormal glucose homoeostasis. It did not affect other cardiometabolic profiles in these individuals.
Acknowledgements
The authors are grateful to the participants of Endocrinology and Metabolism Molecular-Cellular Sciences Institute and School of Nutritional Sciences and Dietetics, Tehran University of Medical Sciences. This work was supported by a grant from Iran National Sciences Foundation (INSF). The funder had no role in the design, analysis or writing of this article.
This study was financially supported by a joint collaboration of Endocrinology and Metabolism Molecular-Cellular Sciences Institute, Tehran University of Medical Sciences, and School of Nutritional Sciences and Dietetics, Tehran University of Medical Sciences, Tehran, Iran. Dr. Ahmad Esmaillzadeh was supported by a grant from Iran National Science Foundation (INSF).
H. M., B. L. and A. E. contributed to conception, design, statistical analyses, data interpretation and manuscript drafting. All authors approved the final manuscript for submission.
The authors declared no personal or financial conflicts of interest.