



Non-alcoholic fatty liver disease (NAFLD) is one of the most important causes of liver disease worldwide(Reference Younossi, Anstee and Marietti1) and can be histologically classified as simple steatosis and non-alcoholic steatohepatitis. NAFLD is strongly associated with metabolic comorbidities and is thus considered the hepatic component of metabolic syndrome(Reference Yki-Järvinen2), with insulin resistance (IR) playing a key role in its pathophysiology(Reference Watt, Miotto and De Nardo3). It has been estimated that over 64 million people have NAFLD in the USA, with a per capita direct medical cost of $1613 annually(Reference Younossi, Blissett and Blissett4).
The relationship between diet and NAFLD has been extensively investigated in recent decades. Dietary patterns have an independent effect on NAFLD apart from energy density(Reference Riazi, Raman and Taylor5). Unhealthy dietary patterns, such as the Western diet (high in saturated fat, refined sugars and grains but low in fibre and phytochemicals), are associated with an increased risk of NAFLD(Reference Oddy, Herbison and Jacoby6). In contrast, NAFLD patients may benefit from the Mediterranean diet, as recommended by the recent EASL–EASD–EASO Clinical Practice Guidelines(7).
Ultra-processed foods (UPF) are characterised as energy-dense, high in unhealthy types of fat, refined starches, free sugars and salt and low in protein, dietary fibre and micronutrients(Reference Monteiro, Cannon and Moubarac8). UPF contribute up to more than 50 % of energy intake in high-income countries and up to 30 % in middle-income countries(Reference Elizabeth, Machado and Zinocker9), with the relative annual growth rate of retail amounting to approximately 2 % globally and nearly three times higher in lower middle-income countries(Reference Monteiro, Moubarac and Cannon10). The NOVA (a name not an acronym) is a novel and predominant food classification system that categorises foods, according to the extent and purpose of food processing, into four distinct groups (unprocessed or minimally processed foods, processed culinary ingredients, processed foods and UPF)(Reference Monteiro, Cannon and Levy11).
Recently, several studies have evaluated the association between UPF consumption and health outcomes, including metabolic disorders. It has been reported that adults with a higher intake of UPF had a greater risk of excess weight or abdominal obesity(Reference Moradi, Entezari and Mohammadi12). There are also several cohort studies that reported a positive association of UPF intake with the risk of developing type 2 diabetes mellitus(Reference Srour, Fezeu and Kesse-Guyot13), hypertension(Reference Mendonça, Lopes and Pimenta14), CVD(Reference Srour, Fezeu and Kesse-Guyot15) and all-cause mortality(Reference Chen, Chu and Hu16,Reference Pagliai, Dinu and Madarena17) . Even in children and adolescents, metabolic parameters such as increased serum total cholesterol, TAG(Reference Leffa, Hoffman and Rauber18) and waist circumference(Reference Costa, Rauber and Leffa19) were significantly associated with the contribution of UPF. Although UPF consumption was associated with a significantly greater fatty liver index among older participants with overweight/obesity and metabolic syndrome(Reference Konieczna, Fiol and Colom20), there is still a lack of evidence-based data to explain this association in NAFLD.
In view of the research mentioned above, we expected to examine the cross-sectional association between UPF consumption and NAFLD from a nationally representative sample of US adults, who were enrolled in the National Health and Nutrition Examination Survey (NHANES) 2011–2018.
Methods
Study design and population
NHANES uses a complex, multistage, probability sampling design to make a representative sample under the Centers for Disease Control and Prevention. It is conducted every 2 years, and adult participants aged ≥ 20 years who fasted (≥ 8 h since last meal) and had complete information on all variables of interest in the latest four cycles (2011–2018) were enrolled in our study (n = 8353). Of these, participants with significant alcohol consumption (> 21 drinks/week in men or > 14 drinks/week in women) or infected with hepatitis B virus or hepatitis C virus were excluded (n = 1808). Thus, the final study sample consisted of 6545 adults with complete data. The NHANES protocols were approved by the research ethics review board at the National Center for Health Statistics, and written informed consent was obtained from all participants.
Dietary assessment
Dietary data in NHANES were collected using up to two 24-hour dietary recalls administered by trained interviewers and coded according to the USDA’s Food and Nutrient Database for Dietary Studies. The first dietary recall interview was collected in person, and the second interview was collected through telephone 3–10 d later(Reference Ahluwalia, Dwyer and Terry21). In this study, 5873 (89·73 % of total) participants provided two dietary recalls.
The NOVA system classifies foods into four groups (unprocessed or minimally processed foods, processed culinary ingredients, processed foods and UPF) according to the nature, extent and purpose of industrial food processing used in their production. Food processing involves physical, biological and chemical processes used after foods are separated from nature. The detailed classification approach of NOVA is available online(Reference Monteiro, Cannon and Moubarac8). In our study, we mainly focussed on the fourth group, UPF. We consulted previous studies to execute procedures for NOVA food classification in NHANES(Reference Juul, Martinez-Steele and Parekh22,Reference Martinez Steele, Baraldi and Louzada23) . In detail, we took into account the following three files from the Food and Nutrient Database for Dietary Studies databases: ‘Main Food Description’, ‘Additional Food Description’ and ‘SR Code Description’ (underlying ingredients, if foods were judged to be a hand-made recipe). We also considered two NHANES variables: ‘Combination Food Type’ and ‘Source of food’. Therefore, most foods classified as ‘Frozen meals’ or ‘Lunchables’ or food items consumed in ‘Restaurant fast food/pizza’ or acquired at a ‘Vending machine’ were also classified as UPF. Consequently, the following foods are considered UPF: milk desserts; ice cream; chocolate and candies; sausages and luncheon meats; mass-produced packaged breads, buns, cookies (biscuits), pastries, cakes and cake mixes; margarines and spreads; carbonated or sugared drinks; ready-to-heat products and reconstituted meat products(Reference Monteiro, Cannon and Moubarac8). Then, for each participant, we calculated the proportion (%) of UPF in the total weight of food and beverages consumed (g/d).
To reflect and assess the characteristics of UPF, we also merged with the Food Patterns Equivalents Database to calculate the Healthy Eating Index-2015 (HEI-2015) by the publicly available SAS macro(24). The HEI-2015 score ranged from 0 to 100, with higher scores reflecting better diet quality. In addition, Spearmen correlation coefficients (r) were used to assess the correlations between UPF and HEI-2015 total score as well as its components to better explain it in detail.
For people who participated in both dietary interviews, HEI-2015 scores and dietary contributions of UPF were averaged. For participants who only had the first interview available, data were used directly.
Definition of non-alcoholic fatty liver disease and insulin resistance
To define NAFLD, we first calculated the US fatty liver index, which was established based on NHANES 1988–1994 by ultrasonography and validated to detect NAFLD with an area under receiver operating characteristic curve of 0·80(Reference Ruhl and Everhart25). Those with US fatty liver index ≥ 30 were considered to have liver steatosis. Then, participants with significant alcohol consumption (> 21 drinks/week in men or > 14 drinks/week in women) or infected with hepatitis B virus or hepatitis C virus were excluded.
Given the lack of a standardised cut-off, IR was defined as the homeostasis model assessment score (fasting glucose (mmol/l) × fasting insulin (μU/ml)/22·5) exceeding the 75th percentile of the homeostasis model assessment scores of all studied samples (> 4·37 in this study).
Covariates
Socio-demographic covariates included age (years), gender (men/women), race/ethnicity (non-Hispanic white, non-Hispanic black, Mexican American, non-Hispanic Asian and others), marital status (married/others), education levels (under high school, high school and above high school) and family income to poverty ratio (below 1·30, 1·30–3·50 and above 3·50). BMI was calculated as weight divided by height squared (kg/m2). Covariates of blood samples were examined by professional operators according to laboratory procedure manuals. Individuals with serum cotinine levels > 10 ng/ml were considered smokers, while others were assumed to be non-smokers.
Statistical analysis
Considering that the NHANES are weighted sampled, we created 8-year fasting subsample MEC weights (WTSAF2YR × 1/4) for combined survey cycles (2011–2018). In the current analysis, the dietary contribution of UPF (% of total weight intake) was evaluated and categorised according to quartiles, and the lowest one was set as the reference. The test of tendency was performed by treating the quartile of UPF as an ordinal variable. In addition, UPF (for a 10 % increase) was also treated as a continuous variable to test linearity. Complex logistic regression (SAS SURVEYLOGISTIC procedure) was used to calculate the OR with 95 % CI for the prevalence of NAFLD or IR. Due to the non-normality of the data, laboratory variables including alanine aminotransferase, TAG, total cholesterol and uric acid were natural logarithm transformed. Then, two separate models were incrementally adjusted to account for known or potential risk factors and confounding factors. Model 1 was adjusted for demographic and socio-economic covariates, and model 2 was adjusted for covariates in model 1 and BMI, smoking status and the laboratory variables mentioned above.
Models 3a–3d were considered mediation models, which were further adjusted with different dietary factors based on HEI-2015 components to determine whether the effects of UPF could be influenced by other dietary covariates or explained by the underlying dietary patterns. Specifically, we took into account the HEI-2015 total score (model 3a), added sugar (from HEI-2015, model 3b), saturated fat intake (from HEI-2015, model 3c) and refined grains (from HEI-2015, model 3d). We conducted mediation analyses to estimate the mediation proportion with 95 % CI based on these covariates by using the SAS macro %mediate (26).
Subgroup analyses were performed to explore the associations between UPF and NAFLD or IR. Then, stratified models were established to see whether the associations of exposure as well as their significance levels varied by the potential factors, such as age, gender and socio-economic conditions. To test the robustness of the associations, sensitivity analyses were performed by excluding participants with extreme values, such as extreme values of alanine aminotransferase (ALT, > 100 U/L), BMI (< 18·5 kg/m2 or > 40 kg/m2) and total energy intake (< 2510 kJ or > 18828 kJ for men or < 2092 kJ or > 14644 kJ for women).
SAS version 9·4 (SAS Institute Inc.) was used for all statistical analyses and the NHANES complex sample design. All associations are statistically significant at the P < 0·05 level.
Results
Baseline characteristics of the study population
The study population consisted of 3045 men and 3500 women, with a mean age of 49·33 years. The characteristics of the study population by NAFLD are summarised in Table 1. Compared with healthy controls, participants with NAFLD tended to be older and have a lower education level. Besides, NAFLD patients had a higher BMI and higher serum levels of alanine aminotransferase, γ-glutamyl transferase, TAG, uric acid, fasting glucose and insulin. Interestingly, patients with NAFLD consumed significantly (P < 0·001) more UPF (925·92 ± 18·08 g/d) than healthy controls (812·70 ± 14·32 g/d). These amounts coincided with a higher proportion of UPF (both in terms of % weight and % of daily energy intake from UPF) in patients with NAFLD (29·17 ± 0·53 % and 56·39 ± 0·57 %, respectively) than in controls (26·69 ± 0·35 % and 54·13 ± 0·40 %, respectively). These findings suggested that participants with NAFLD were correlated with metabolic abnormalities and a higher intake of UPF.
Baseline characteristics of participants by NAFLD status
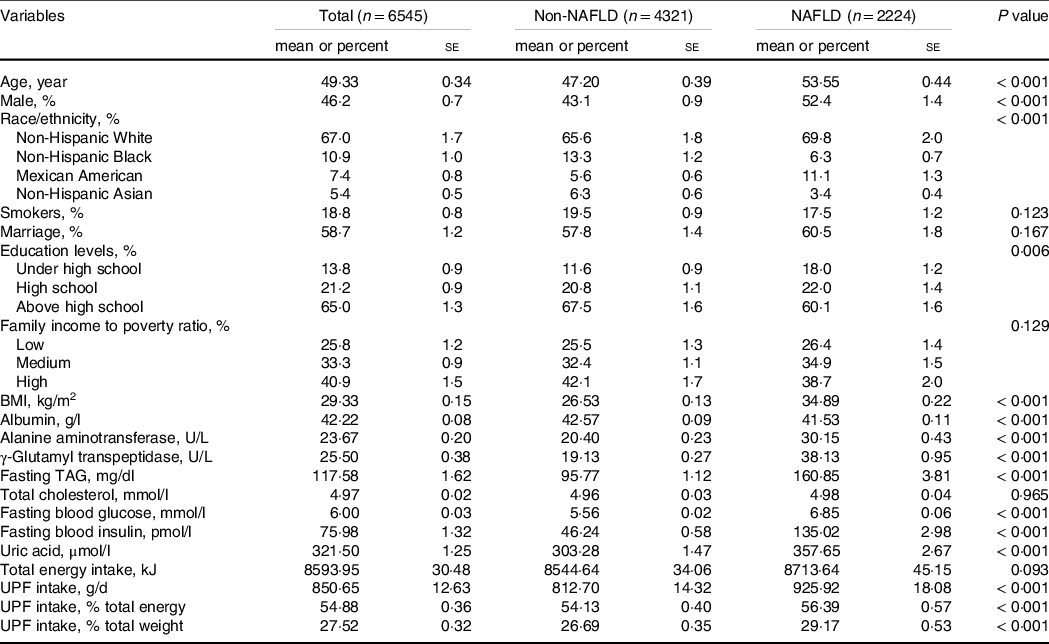
Continuous variables are presented as the weighted mean and are compared by survey regression models. Categorical variables were presented as weighted percent and compared by the Rao–Scott χ2 test. P values for multi-categorical variables demonstrated whether there was any difference in NAFLD prevalence in the subgroups. UPF, ultra-processed foods; NAFLD, non-alcoholic fatty liver disease.
Characteristics of ultra-processed foods assessed by Healthy Eating Index-2015
The HEI-2015 can be used to examine diet quality relative to the 2015–2020 Dietary Guidelines for Americans(Reference Reedy, Lerman and Krebs-Smith27), so we first calculated HEI-2015 and evaluated the characteristics of UPF. As demonstrated in Fig. 1(a), dietary intake of UPF was negatively related to the HEI-2015 score (Spearman r = –0·32, P < 0·001). Specifically, as shown in Fig. 1(b), among thirteen HEI-2015 components, except Na, the other twelve components all demonstrated significantly negative relations with UPF (spearman r ranged from –0·28 (added sugar) to –0·04 (dairy), all with P < 0·001). These results indicated that UPF was unhealthy and higher UPF consumption was associated with a lower adherence to the Dietary Guidelines for Americans.
Correlation of UPF and HEI-2015 and its components. (a) Scatter plot for dietary UPF intake (weight ratio) and total HEI-2015 score, fitting with a regression line. (b) HEI-2015 component scores (% maximum score) according to UPF quartiles. UPF ultra-processed foods; HEI, Healthy Eating Index.

Associations between ultra-processed food consumption and risk of non-alcoholic fatty liver disease
In model 1 with demographic and socio-economic adjustments (Table 2), we found that higher UPF intake was positively associated with the risk of NAFLD, with an OR (95 % CI) of 1·49 (1·22, 1·83) in quartile 4 compared with the lowest quartile. Our multivariable dose-response analysis showed a direct linear dose–response relationship between a 10 % increase in the proportion of UPF (ORcontinuous (95 % CI): 1·15 (1·09, 1·22)) and NAFLD in model 2. In mediation analyses (models 3a–3d), 47·1 % (95 % CI: 12·2 %, 85·1 %), 8·5 % (95 % CI: 2·5 %, 24·7 %) and 17·0 % (95 % CI: 5·5 %, 42·1 %) of the increased OR associated with UPF consumption were influenced by poor diet quality (HEI-2015), saturated fat and refined grains, respectively. Added sugar was not identified as a mediator here. These results showed that consumption of UPF was significantly associated with NAFLD after being adjusted for socio-economic and potential confounders. In addition, an unhealthy dietary pattern, such as high saturated fat and refined grain consumption, may mediate the association between UPF consumption and NAFLD.
UPF consumption and risk of NAFLD

Model 1 was adjusted for demographic factors: age, gender, race/ethnicity, education level, family income to poverty ratio and marital status. Model 2 was adjusted for model 1 plus lifestyle factors: smoking status, BMI and biochemistry factors (log-transformed): serum ALT, fasting TAG, total cholesterol and uric acid. Models 3a–3d were further adjusted for model 2 plus dietary factors: 3a) dietary pattern (total HEI score); 3b) added sugar (HEI2015C13); 3c) saturated fat (HEI2015C12) and 3d) refined grains (HEI2015C11). Correspondingly, these factors were set as mediators in mediation analysis.
UPF, ultra-processed foods; NAFLD, non-alcoholic fatty liver disease; HEI, Healthy Eating Index.
* OR for a 10 % increase in the dietary contribution of UPF.
Associations between ultra-processed food consumption and risk of insulin resistance
Since IR is a key factor in the pathophysiology of NAFLD, we also conducted analyses to discover the potential associations between UPF and IR (Table 3). Similarly, the multivariable analyses showed significant inverse associations between UPF and IR. The highest quartile of UPF consumption showed a 52 % (95 % CI: 1·12–2·07) higher OR than the lowest quartile (model 2). Dose-response analysis also demonstrated a linear relationship (ORcontinuous (95 % CI): 1·11 (1·05, 1·18)). In mediation analyses, the mediators discovered in NAFLD (HEI-2015, saturated fat, and refined grains) remained significant (mediation effect (95 % CI): 30·9 % (13·3 %, 56·6 %), 4·6 % (1·5 %, 13·2 %) and 7·0 % (2·3 %, 16·4 %), respectively). Notably, added sugar was also a variable that mediated 12·4 % (95 % CI: 3·3 %, 39·2 %) of the total effects between UPF consumption and IR. These findings suggested that UPF consumption was positively associated with the risk of IR, and unhealthy dietary patterns may also mediate the association between UPF consumption and IR.
UPF consumption and risk of IR

Model 1 was adjusted for demographic factors: age, gender, race/ethnicity, education level, family income to poverty ratio and marital status. Model 2 was adjusted for model 1 plus lifestyle factors: smoking status, BMI and biochemistry factors (log-transformed): serum ALT, fasting TAG, total cholesterol and uric acid. Models 3a–3d were further adjusted for model 2 plus dietary factors: 3a) dietary pattern (total HEI score); 3b) added sugar (HEI2015C13); 3c) saturated fat (HEI2015C12) and 3d) refined grains (HEI2015C11). Correspondingly, these factors were set as mediators in mediation analysis.
UPF, ultra-processed foods; IR, insulin resistance; HEI, Healthy Eating Index.
* OR for a 10 % increase in the dietary contribution of UPF.
Subgroup analyses and sensitivity analyses
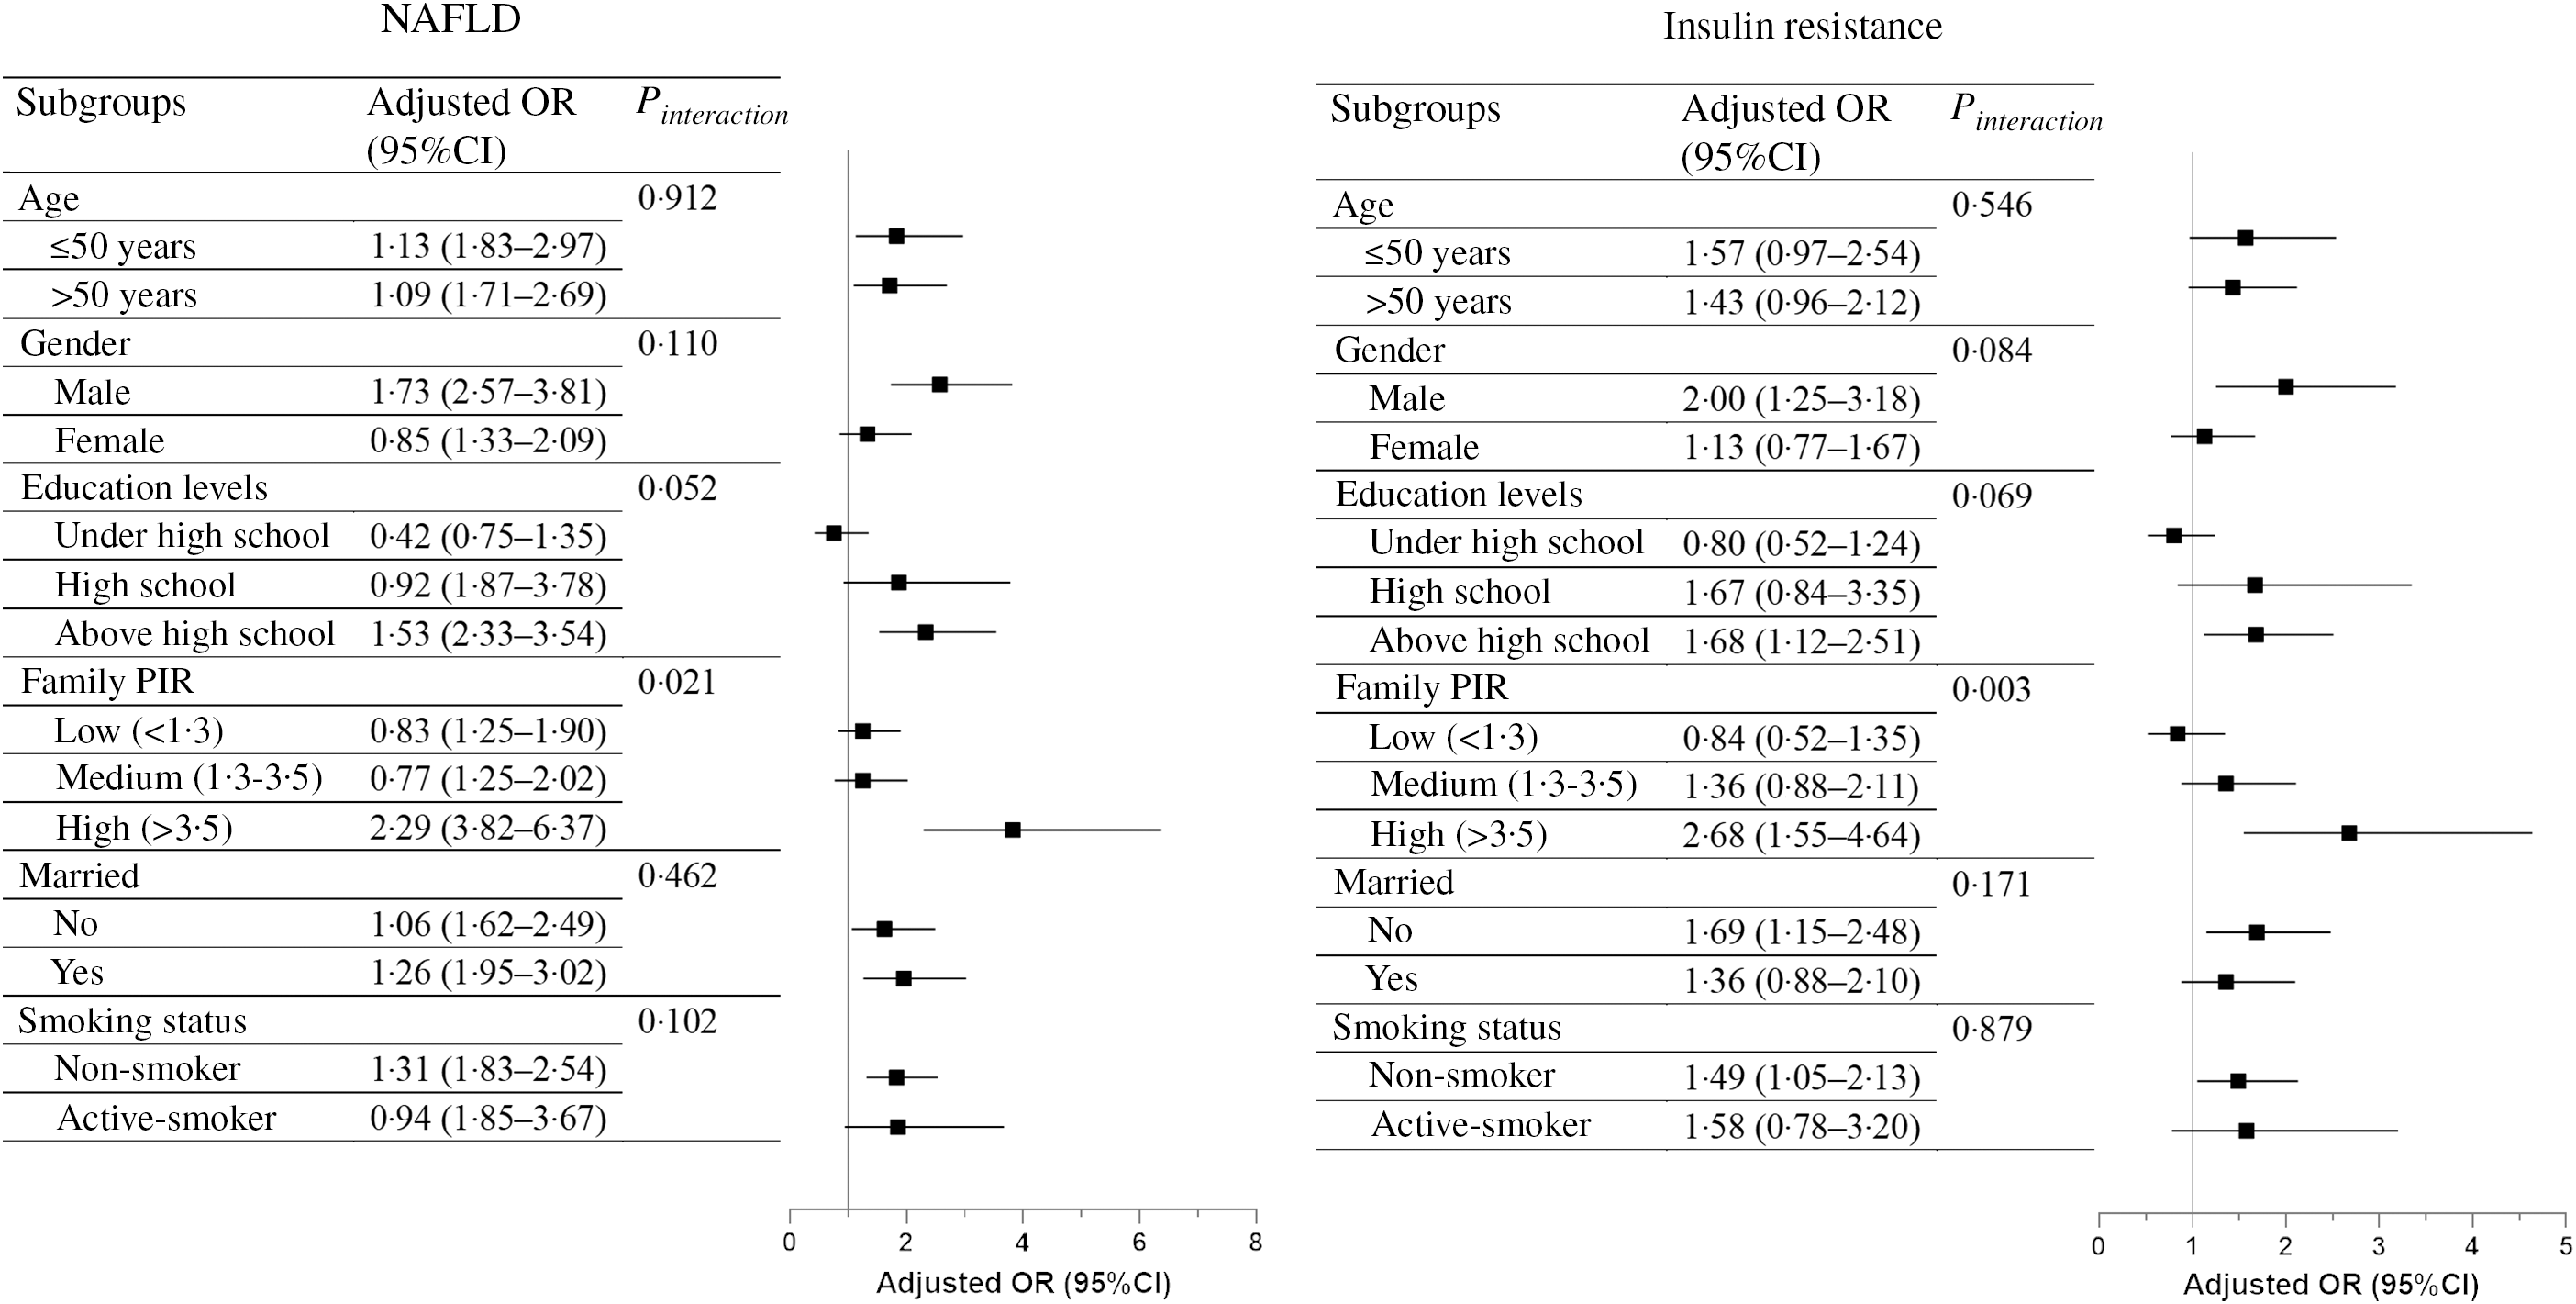
In subgroup analyses (Fig. 2), people who had higher family income to poverty ratio were inclined to have NAFLD or IR with increased UPF consumption (P for interaction <0·001). Stronger positive associations were found in those with the highest family income to poverty ratio. In addition, the associations between UPF and NAFLD or IR remained consistent across other subgroups (P for interaction was not significant).
Multivariable-adjusted OR (Q4 v . Q1, 95 % CI) of UPF with NAFLD and IR, stratified by preselected factors. Multivariable-adjusted OR (indicated by squares) and 95 % CI (indicated by black horizonal lines) were presented separately in NAFLD and IR. The models were adjusted for age, gender, race/ethnicity, education levels, family income to poverty ratio, marital status, smoking status, BMI and biochemistry factors (log-transformed), including serum ALT, fasting TAG, total cholesterol and uric acid, with the exception of not adjusting for a categorical covariate when it was used as strata. The P values for interactions across subgroups are presented on the right. UPF ultra-processed foods; NAFLD, non-alcoholic fatty liver disease; IR, insulin resistance.
In sensitivity analyses (Table 4), after the exclusion of people with extreme ALT, BMI or energy intake values, the results did not substantially differ from those observed in our aforementioned analyses.
Sensitivity analyses of the OR for the associations of UPF with NAFLD and IR

UPF, ultra-processed foods; NAFLD, non-alcoholic fatty liver disease; IR, insulin resistance.
* ALT > 100 U/L.
† BMI < 18·5 kg/m2 or BMI > 40 kg/m2.
‡ Dietary energy intake < 2510 kJ or > 18828 kJ for men or dietary energy intake < 2092 kJ or > 14644 kJ for women.
Discussion
This study analysed the association between UPF intake and NAFLD. We found that UPF was in disobedience of the Dietary Guidelines for Americans. Correspondingly, higher consumption of UPF was also associated with an increased risk of NAFLD and IR even with many covariates controlled in US adults.
Several reasons have been proposed for the observed association between UPF and metabolic disorders. It has been reported that the more food processed, the higher its glycaemic response and the lower its satiety potential(Reference Fardet28). Moreover, foods high in fat and carbohydrate were associated with a potentiated reward signal in brain areas critical for reward valuation(Reference DiFeliceantonio, Coppin and Rigoux29). Accordingly, a randomised controlled trial in twenty weight-stable adults revealed that people consumed more calories when exposed to an ultra-processed diet compared with an unprocessed diet(Reference Hall, Ayuketah and Brychta30). Another study based on NHANES also reported that consumption of UPF was directly associated with excess weight and abdominal obesity(Reference Juul, Martinez-Steele and Parekh22). These studies indicate that UPF is liable to induce a state of positive energy balance, which consequently increases body mass, with 60–80 % of body fat(Reference Hill, Wyatt and Peters31).
Added sugars refer to those added to foods artificially, such as sucrose, fructose, glucose and high fructose syrup(Reference Azaïs-Braesco, Sluik and Maillot32), with an estimated 21·1 % contribution of energy in UPF(Reference Martinez Steele, Baraldi and Louzada23). Among them, fructose is a key macronutrient for the development of NAFLD and IR(Reference Jensen, Abdelmalek and Sullivan33,Reference Softic, Stanhope and Boucher34) , which not only disrupts de novo lipogenesis and fat oxidation(Reference Softic, Cohen and Kahn35) but also causes intestinal barrier deterioration(Reference Cho, Kim and Seo36). Besides, fat quality is another factor responsible for the increase in the incidence of metabolic disorders. A clinical trial enrolling 38 overweight subjects concluded that saturated fat is more metabolically harmful to the liver, which induces the greatest increase in intrahepatic TAG, IR and harmful ceramides(Reference Luukkonen, Sädevirta and Zhou37). In contrast, it has been shown that long-chain n-3 fatty acids are beneficial in decreasing liver lipids(Reference Scorletti and Byrne38) and improving insulin sensitivity(Reference Vessby, Uusitupa and Hermansen39). These effects may be attributable to their roles in regulating bioactive metabolites and altering transcription factor activities involved in inflammation and liver lipid metabolism(Reference Scorletti and Byrne40). Correspondingly, in this study, saturated fat, added sugars and refined grains partly mediated the harmful effects of UPF, suggesting that foods rich in these nutrients should be limited in daily diet.
Besides macronutrients, harmful substances generated during food processing may also partly explain the risk of UPF. A randomised intervention trial with sixty-two volunteers demonstrated that high-heat-treated foods impaired insulin sensitivity and increased serum TAG levels in healthy people(Reference Birlouez-Aragon, Saavedra and Tessier41). Maillard reaction products, generated upon heat-induced reactions between amino groups and reduced sugars, are common in processed foods, especially in the Western diet(Reference ALjahdali and Carbonero42). Advanced glycation end-products are advanced stages of Maillard reaction products that have been linked to deleterious health effects via interaction with the receptor for advanced glycation end-products and promotion of the genes that control inflammation(Reference Kellow and Coughlan43). Previous studies revealed that serum and hepatic advanced glycation end-products were significantly elevated in non-alcoholic steatohepatitis patients(Reference Hyogo, Yamagishi and Iwamoto44), and the circulating level of advanced glycation end-products was associated with IR even in non-obese, non-diabetic subjects(Reference Tan, Shiu and Wong45). In addition, acrylamide (one of the Maillard reaction products) was also associated with NAFLD in the NHANES(Reference Liu, Wang and Chen46). Another interpretation concerns the wide range of food additives in UPF. For example, emulsifiers are common ingredients of UPF, and two common emulsifiers, carboxymethylcellulose and polysorbate-80, were likely to induce obesity and metabolic syndrome in mice(Reference Chassaing, Koren and Goodrich47). Furthermore, UPF may also be contaminated by contact materials, such as bisphenol-A, which was positively associated with NAFLD in US adults(Reference Kim, Yoo and Li48).
Lifestyle intervention can be beneficial to NAFLD patients and should be the keystone of NAFLD management(Reference Romero-Gomez, Zelber-Sagi and Trenell49). Modifying dietary composition to a high-quality healthy pattern without restricting energy intake may also be a feasible approach to NAFLD treatment(Reference Eslamparast, Tandon and Raman50). For example, the Mediterranean dietary pattern, summarised as a high intake of fruits and nuts, vegetables, legumes, cereals, fish and seafood and a low intake of dairy products, meat and meat products(Reference Naska and Trichopoulou51), has proved beneficial in the treatment of liver steatosis and metabolic dysfunction(Reference Zelber-Sagi, Salomone and Mlynarsky52,Reference Kontogianni, Tileli and Margariti53) . On the contrary, Steele et al. used principal component analysis and identified that UPF were poorer in fibre, potassium, magnesium and vitamin C and had more saturated fat and added sugars(Reference Martinez Steele, Popkin and Swinburn54). Similarly, according to HEI-2015, we found that UPF was characterised by high levels of refined grains, saturated fat and added sugars but low levels of total vegetables and fruits. As a result, it is plausible to limit UPF consumption for NAFLD prevention and treatment.
In this study, we concretely evaluated the dietary quality of UPF according to HEI-2015 and assessed the association of UPF intake with the risk of NAFLD and IR in a nationwide population. Based on this, we also utilised mediation analysis to reveal the possible factors that may function. Nevertheless, our study has several limitations. First, NHANES is a well quality-controlled nationwide database, yet its cross-sectional nature cannot be ignored. Although we adjusted for a wide range of covariates in our multivariable models, we cannot exclude the potentially residual or unmeasured confounding factors. Second, no causal associations can be established from the study, and reverse causality, that is, people who suffered from metabolic disorders might have adapted their diet for healthy dietary guidelines, could underestimate the association between UPF consumption and NAFLD and IR. Third, dietary data obtained by 24-h recalls were based on self-reported information. A recall bias may exist even though most of the participants provided two recalls to minimise the bias. Fourth, the interviews were not specifically designed for the NOVA classification, and information indicative of food processing was not systematically collected. Although we conducted classification carefully by referring to previously published studies, misclassification bias of food items cannot be excluded, which could lead to overestimation or underestimation of UPF consumption. Fifth, the NOVA system considers physical, biological and chemical methods used during the food manufacturing process and provides a brand new method to classify all foods by processing type; nevertheless, it also remains somewhat controversial. NOVA dismisses the proven benefits of diets chosen with the right mix of foods at all levels of processing, as if all processed foods were nutrient-poor, which is somehow imprecise(Reference Petrus, do Amaral Sobral and Tadini55). Sixth, US fatty liver index and homeostasis model assessment-IR are suboptimal standards for liver steatosis and IR compared with liver biopsy and the glucose clamp technique. Due to their non-invasiveness, they have been employed by quantities of studies, yet misclassification bias was an inevitable consideration. Furthermore, the histopathology of NAFLD (simple steatosis or steatohepatitis) cannot be specified by US fatty liver index.
Conclusion
In conclusion, we found that higher consumption of UPF was associated with an increased risk of NAFLD in a large sample of the adult US population. Further larger prospective cohort studies and randomised controlled trials are warranted to confirm this finding and to establish the causal relationship.
Acknowledgements
We thank members of the National Center for Health Statistics of the Centers for Disease Control and Prevention and the participants who enrolled in the National Health and Nutrition Examination Survey.
This work was supported by the National Key Research and Development Program of China (2018YFA0109800), National Natural Science Foundation of China (82070585) and Key Research and Development Program of Zhejiang Province (2020C03033).
Z. L.: conceptualisation, formal analysis, software, writing—original draft. H. H.: writing—original draft. Y. Z.: software. Y. C.: data curation. C. X.: project administration, funding acquisition, conceptualisation, supervision.
The authors declare no conflicts of interest.



