


The changing face of disease aetiology over the past century has brought to the forefront the need to examine the environmental or modifiable risk factors that have influenced the epidemic of chronic disease afflicting a majority of the Western world. Nutritional status is a readily modifiable risk factor linked to numerous chronic conditions, including CHD, cancer, obesity, diabetes and osteoporosis(Reference El-Sohemy1, Reference Desiere2). Nonetheless, despite the prevalence of research linking poor dietary choices to chronic disease status, the nutritional patterns presently dominating most Western nations continue to be high in saturated fats, Na and refined carbohydrates from sugars, cereals and dairy products, and low in fruits, vegetables and lean protein(Reference Eaton3).
Considerable effort has focused on discovering the underlying nutritional factors that predispose an individual to osteopenia or osteoporosis and subsequent fracture(Reference Salem, Zernicke and Barnard4). Much research has concentrated on the role of Ca and vitamin D metabolites influencing bone morphology and mechanics; however, macronutrients such as fat, protein and carbohydrate also play a vital role in bone health(Reference Wohl, Loehrke and Watkins5). Considered independently, consumption of diets composed of large amounts of saturated fat has been documented to cause the formation of insoluble soap complexes with ingested Ca in the gut, thus preventing Ca absorption(Reference French6–Reference Atteh and Leeson8). Additionally, ingestion of sucrose alone encourages Ca excretion in the urine or hypercalciuria(Reference Holl and Allen9–Reference Lemann, Lennon and Piering12). While earlier reports(Reference Salem, Zernicke and Barnard4, Reference Grimditch, Barnard and Hendricks13–Reference Grimditch, Barnard and Sternlicht17) suggest that diets that include both high-saturated fat/sucrose (HFS) have a profound effect on skeletal structural integrity, the underlying mechanisms remain incompletely understood.
HFS diets fed to young, rapidly growing rats produced deleterious effects on normal bone morphology and structural properties of tibia and metatarsus(Reference Li, Zernicke and Barnard14), femoral neck(Reference Hou, Zernicke and Barnard16) and lumbar vertebrae(Reference Salem, Zernicke and Barnard4, Reference LaMothe and Zernicke18). Those effects were exacerbated in the femoral neck and lumbar vertebrae of rats fed an HFS diet long term, suggesting that the skeleton did not positively adapt to this nutritional diet regimen to mitigate osteopenia over the lifespan(Reference Zernicke, Salem and Barnard15).
To date, however, reports examining the effects of an HFS diet on bone mechanical properties and morphology have not investigated the concurrent effect on expression of regulators of osteoclast function associated with chronic consumption. Therefore, the objective of the present study was to investigate the effects of consuming an HFS diet on bone mechanical and morphological properties, in conjunction with molecular and biochemical markers of bone turnover and homoeostasis in a skeletally immature murine model.
Experimental methods
Animal model
Sixty inbred female C57BL/6 mice (6 weeks) were obtained from Charles River Canada (LaSalle, QC, Canada). All mice were allowed free cage activity for 13 weeks (3 weeks for acclimatisation and 10 weeks for diet consumption), housed in a pathogen-free environment located within the Single Mouse Barrier Unit at the Heritage Medical Research Building (Calgary, AB, Canada) until euthanisation at the age of 19 weeks. Each cage (44 × 25 × 16 cm3) housed five mice. The light–dark cycle was 12:12 from 07.00 to 19.00 hours; ambient temperature varied between 21 and 25°C, and relative humidity was 60 %. All experimental procedures involving animals were approved by the University of Calgary Animal Care Committee and conformed to the Guide for the Care and Use of Laboratory Animals.
Dietary regimen
After 3 weeks of a baseline period, mice (approximately 20 g) were randomly assigned to one of two dietary groupings: a HFS diet group (n 30) or a low-fat, complex carbohydrate (LFCC) diet group (n 30). Both diets were custom-prepared (Teklad Corporation, Madison, WI, USA; TD.85 080: LFCC diet, TD.83 402: HFS diet; Table 1) and were selected based on prior research(Reference Levin, Dunn-Meynell and Balkan19, Reference West, Boozer and Moody20, Reference Kern, Saghizadeh and Ong21). Diets were designed to differ in energy density in order to address differences in bone mechanical properties between a high-energy-dense diet (HFS) and a low-energy-dense diet (LFCC). Ca (17·5 g/kg diet) and vitamin D (19 824 units/kg diet) contents were similar between diets. Lard was used in the present study to increase saturated fat content and had the following fatty acid composition: oleic acid, 46 %; palmitic acid, 26·5 %; stearic acid, 12·5 %; linoleic acid, 12 %; linolenic acid, 1·5 %; myristic acid, 1·5 %. Maize oil was composed of: oleic acid, 30·7 %; palmitic acid, 12·1 %; stearic acid, 2·2 %; linoleic acid, 54 %; linolenic acid, 1 %. Food and water were provided ad libitum. Mice remained on their respective diets for 10 weeks as per previous study protocols(Reference Salem, Zernicke and Barnard4, Reference Grimditch, Barnard and Hendricks13, Reference Li, Zernicke and Barnard14, Reference Grimditch, Barnard and Sternlicht17).
Diet composition
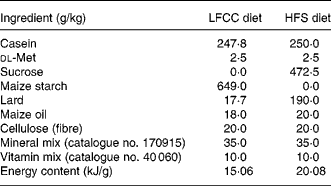
LFCC, low-fat, complex carbohydrate; HFS, high-fat/sucrose.
Diets were custom prepared by Teklad Corporation (Madison, WI, USA). Energy composition of the LFCC v. HFS diets, respectively, were: complex carbohydrate (68·0 v. 0 %), sucrose (0 v. 39·5 %), fat (6 v. 39·5 %) and protein (26 v. 21 %).
Blood collection
On the day of euthanisation, mice were anaesthetised with isoflurane, and blood sampled via cardiac puncture. Blood was collected in standard serum vacutainers (Becton Dickinson Vacutainer systems, Franklin Lakes, NJ, USA) and centrifuged for 10 min at 1500 g. Serum was stored at − 80°C for subsequent analysis. Mice were euthanised via cervical dislocation.
Biochemical analysis
As a measure of bone formation, serum concentrations of osteocalcin were determined by a sandwich ELISA (Biomedical Technologies Inc., Stoughton, MA, USA) with a sensitivity of 1 ng/ml. The intra-assay CV was 8·0 %. Serum tartrate-resistant acid phosphatase (TRAP) activity was measured by ELISA (Mouse TRAP Assay, SBA Sciences, Turku, Finland) as a measure of bone resorption. The sensitivity of this measurement was 0·1 U/l, and the intra-assay CV was 4·8 %. As a control outcome variable and to ensure healthy kidney function, intact parathyroid hormone concentration in serum was measured by an ELISA (Immutopics, San Clemente, CA, USA). The sensitivity of the measurement was 3 pg/ml. The intra-assay CV was 2·8 %. Due to the small volume of serum available per mouse, 1, 25-dihydroxyvitamin D3 was difficult to measure. As such, reflection of total body vitamin D status among the mice was tested via measurement of serum 25-hydroxyvitamin D3 (25-OH vitamin D3)(Reference Holick22). The 25-OH vitamin D3 was measured by an RIA (Diasorin, Still Water, MN, USA). Sensitivity of the assay was 1·5 ng/ml, and the intra-assay CV was 3·5 %.
Tissue collection and storage
Upon euthanisation, half of the mice from each dietary cohort (LFCC and HFS) were randomly assigned to have their tibiae used for real-time PCR analysis (LFCC = 15; HFS = 15) or for biomechanical and morphological indices of bone adaptation (LFCC = 15; HFS = 15). The right and left tibiae of all mice were disarticulated at the knee and ankle joints, and cleaned of all non-osseous tissue. For mice allocated to real-time PCR analysis, cleaned tibiae were immediately placed in labelled 1·5 ml tubes (Fischer Scientific Ltd, Nepean, ON, Canada), snap frozen in liquid nitrogen and stored at − 80°C until further analysis. For mice allocated to biomechanical and morphological testing, tibiae were cleaned and wrapped in gauze soaked in saline (50 mm potassium phosphate buffer solution, pH 7·4; PBS), hermetically sealed and stored at − 20°C until further analysis.
Microstructural imaging
Tibiae allocated to the biomechanical and morphological grouping were analysed by micro-computed tomography. Frozen tibiae were thawed at room temperature for at least an hour before scanning. Proximal right tibiae were immobilised in a micro-computed tomography jig hand constructed from foam. The jig was formed in the shape of a revolver bullet chamber to hold five tibiae for analysis at one time. Bones were aligned at the level of the tibial plateau, using the scout view, within the jig to ensure similar scanning regions. Scans were performed (vivaCT 40, Scanco Medical AG, Bruettisellen, Switzerland) with an effective energy of 55 kVp and 109 mA, integration time of 200 ms, and a nominal isotropic resolution of 10·5 μm.
Four-hundred and twenty-two slices were captured, equivalent to approximately 4·4 mm of the tibial mid-shaft length, measured proximal to the tibia–fibular junction. Bone tissue was identified within the image using semi-automated contouring. Before evaluation, bone images were Gaussian filtered (support of 2 and standard deviation of 1·2) and mineralised tissue was extracted using a global threshold (22·4 % of the maximal image value). All image processing was performed by the Image Processing Library Software (Scanco Medical AG). Tibial images were evaluated for cortical thickness (Ct.Th), cortical cross-sectional area and cortical bone mineral density. Upon completion of each scan, tibiae were saturated in PBS, hermetically sealed and returned to − 20°C for storage until mechanical testing.
Mechanical testing: three-point bending
Tibial geometry permits more stable and repeatable placement of the diaphyseal shaft on the loading span than the femoral diaphysis, which is more circular in cross section(Reference LaMothe, Hepple and Zernicke23). On the day of mechanical testing, tibiae were thawed in 22°C PBS for at least 1 h. Tibial length was measured ( ± 0·01 mm) using digital callipers (Model 14-648-17, Fisher Scientific, Ottawa, ON, Canada). When each specimen was thawed, the round-surfaced cross head probe of a servo-controlled electromechanical testing system (Model 1122, Instron Corp., Canton, MA, USA) contacted the medial tibial surface at its longitudinal midpoint, between a 6 mm loading span(Reference Desiere2, Reference Lambert, Lamothe and Zernicke24, Reference Jurimae, Jurimae and Leppik25). Testing order was stratified based on dietary cohort, and load was applied at 0·17 mm/s(Reference El-Sohemy1, Reference Jurimae, Jurimae and Leppik25) with a 50 kg compression load cell (Instron 2511-203; Instron Corp., Canton, MA, USA) until failure. Load–deformation curves were digitised (200 Hz; Dataq Instruments, DI-730 Series, Akron, OH, USA), and structural properties such as tibial maximal load, load at proportional limit and energy to failure were determined. Material properties such as stress at proportional limit, stress at maximal load and flexural rigidity were calculated(Reference Akhter, Iwaniec and Covey26, Reference Zernicke, Vailas and Grindeland27).
Real-time PCR
Tibiae designated for real-time PCR were removed from − 80°C and reduced to powder form using a liquid nitrogen-cooled Braun Mikro-Dismembrator Vessel (B. Braun Biotech International, Allentown, PA, USA). Total RNA was extracted from samples using TRIzol Reagent (Invitrogen, Carlsbad, CA, USA). RNA was quantified using Ribogreen, and reverse transcription was performed using the Omniscript RT Kit (Qiagen, Mississauga, ON, Canada)(Reference Reno, Marchuk and Sciore28). The same number of samples for each cDNA was analysed to prevent bias in the results. Each sample was analysed in triplicate in a total reaction volume of 25 μl consisting of 5 μl dilute cDNA (1:10) and 20 μl Master Mix. The Master Mix contained 2·5 μl of 10 × PCR buffer, 1·5 μl of 50 mmol/l MgCl2, 0·05 μl of 100 mmol/l dNTPs, 2·5 μl sybergreen (1:5000), 1·0 μl fluoroscein (1:10 000), 0·2 μl Taq DNA polymerase (Invitrogen) and the required amount of forward and reverse primers. The primer sequences for genes of interest such as receptor activator of nuclear factor κβ ligand (RANKL), osteoprotegerin (OPG), cyclo-oxygenase-2 (COX-2), cathepsin K and PPAR-γ are available upon request from the investigators. Reactions were run on an iCycler thermal cycler (Bio-Rad, CA, USA) using the following cycling conditions: 95°C for 1:30 min and 40 cycles at 95°C for 25 s, 60°C for 20 s and 72°C for 20 s. For each experiment, a non-template reaction was included as negative control. Glyceraldehyde-3-phosphate dehydrogenase primers were included in the reaction as internal controls for all genes. The specificity of the PCR was confirmed by melting curves analysis of the products. The threshold cycle values (C t) were determined at the same fluorescence threshold line for each gene. C t values were transformed into fold change. The mRNA expression, measured in arbitrary units, of the target gene relative to the control was determined using the 2− C t method(Reference Maurer, Chen and McPherson29).
Body composition
Percentage body fat was determined for all mice, and the analysis included the entire carcass (less the lower limbs that had been removed for the aforementioned analyses). Scans of the bodies were performed using micro-CT (XtremeCT, Scanco Medical AG) with settings of 100 ms integration time and beam energy of 60 kVp and 1 mA providing a nominal isotropic resolution of 82 μm. The data were resampled by a factor of 2 due to hardware constraints, and Gaussian filtered (sigma 1·2 and support of 2) to reduce noise. The resulting images were segmented using a custom algorithm that utilised global thresholds to capture the lean and mineralised tissue (61/1000) separately from the entire body mass (24/1000). Subtracting the volume represented by the former output from the latter resulted in the total volumetric body fat from which percentage body fat was determined.
Statistics
For morphological, mechanical and histological data, differences between LFCC and HFS dietary cohorts were assessed using independent t tests. Statistical significance was corrected for multiple t tests by dividing the experiment-wise α-level (0·05) by the number of t tests per variable set. Molecular analysis was completed using a one-way ANOVA. Data are presented as means and standard deviations. Data analysis was performed using SPSS 15.0 for Windows (SPSS Inc., Chicago, IL, USA).
Results
Body mass
Baseline body mass was not significantly different between LFCC and HFS cohorts; however, at the end of the 10-week diet intervention, the average body mass of the HFS cohort was greater than the LFCC cohort by approximately 40 % (35·7 (sd 4·0) v. 25·3 (sd 2·4) g, respectively; P < 0·001). Percentage body fat was also 14·9 (sd 2·0) % greater in the HFS v. LFCC cohort (P < 0·001). As bone mineral density and bone size are influenced by total body mass(Reference Blain, Vuillemin and Guillemin30), and as bone mineral density influences bone strength(Reference Gatti, Sartori and Braga31), structural properties presented below were adjusted (divided by grams of body mass) as has been done previously in studies where body weight differs substantially between groups(Reference Zernicke, Salem and Barnard15, Reference Lambert, Lamothe and Zernicke24, Reference Jurimae, Jurimae and Leppik25, Reference Melton, Riggs and Leibson32–Reference Petit, Beck and Shults35).
Biochemical markers of bone turnover
No significant differences were found between HFS and LFCC groups for serum levels of intact PTH, 25-hydroxyvitamin D3 or osteocalcin. TRAP activity, however, was elevated 30 % in the HFS v. the LFCC cohort (P = 0·01; Table 2).
(Mean values and standard deviations, n 30)
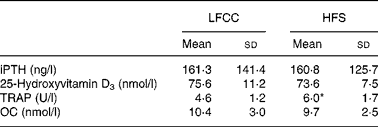
LFCC, low-fat, complex carbohydrate; HFS, high-fat/sucrose; iPTH, intact parathyroid hormone; TRAP, tartrate-resistant acid phosphatase; OC, osteocalcin.
* Mean value was significantly different (P < 0·05).
Tibial geometrics and mechanics
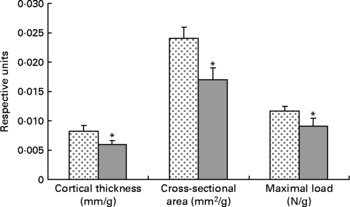
Tibial geometrical parameters included tibial mass, length, mid-shaft cross-sectional area and Ct.Th(Reference Turner and Burr36). There were no significant differences in geometric, structural or material properties between HFS and LFCC cohorts using data unadjusted for body mass differences (Table 3). There were significant differences in total body mass between the two groups, and data were, therefore, normalised to total body mass. This normalisation has been performed by others with interventions that caused marked differences in body mass between groups (i.e. energy restriction, conjugated linoleic acid and genetically lean v. obese rodents(Reference Lambert, Lamothe and Zernicke24, Reference Burr, Taylor and Weiler37)). When adjusted for total body mass, relative tibial mid-diaphyseal cortical bone morphology was significantly impaired in the HFS cohort. Consumption of an HFS diet led to a 28 % reduction in Ct.Th compared to mice fed a LFCC diet (P < 0·001l; Fig. 1) as well as a 25 % reduction in mid-shaft cross-sectional area (P < 0·001; Fig. 1). Relative load at maximum was 23 % lower in the HFS cohort relative to their LFCC counterparts (P < 0·001; Fig. 1). As well, adjusted energy to failure and flexural rigidity were significantly compromised in HFS mice (Table 4).
(Mean values and standard deviations, n 15)
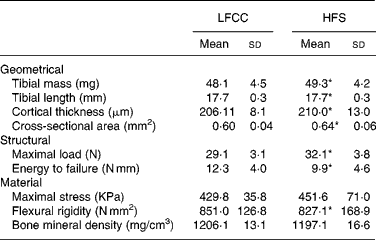
LFCC, low-fat, complex carbohydrate; HFS, high-fat/sucrose.
* Mean values are significantly different when adjusted for body mass (P < 0·001), values presented in Table 4.
Low-fat, complex carbohydrate (LFCC) v. high-fat/sucrose (HFS) tibital mid-shaft cortical thickness, mid-shaft cross-sectional area and maximal load. Results are expressed as means and standard deviations (n 15). Maximal load was reduced by a factor of 100 to fit on the graph. * Mean value was significantly different (P < 0·05).  , LFCC;
  , HFS.
(Mean values and standard deviations, n 15)
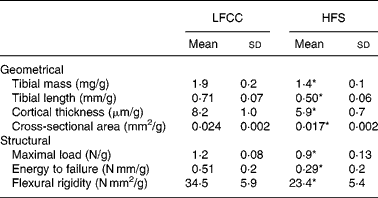
LFCC, low-fat, complex carbohydrate; HFS, high-fat/sucrose.
* Mean values are significantly different when adjusted for body mass (P < 0·001).
mRNA expression
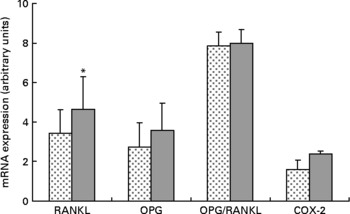
Expression of RANKL mRNA was significantly upregulated approximately 36 % in the HFS mice when compared to the LFCC mice (P < 0·05), while the slightly elevated expression of OPG mRNA in HFS mice was NS (P = 0·10; Fig. 2). When considered together, the OPG/RANKL mRNA ratio was not affected by consumption of an HFS diet (P = 0·89; Fig. 2). COX-2 mRNA expression, although 52 % higher in HFS mice relative to their LFCC counterparts, was NS (P = 0·07; Fig. 2). In addition, mRNA expression of cathepsin K and PPAR-γ was not significantly different between dietary cohorts.
Low-fat, complex carbohydrate (LFCC) v. high-fat/sucrose (HFS) mRNA expression of receptor activator of nuclear factor κβ ligand (RANKL), osteoprotegerin (OPG), OPG/RANKL and cyclo-oxygenase-2 (COX-2). Results are expressed as means and standard deviations (n 15). * Mean value was significantly different (P < 0·05). , LFCC; , HFS.
Discussion
The HFS diet selected for the present study was based on a plethora of data regarding the ability of this diet to induce obesity in rodents(Reference Levin, Dunn-Meynell and Balkan19, Reference West, Boozer and Moody20, Reference Levin, Triscari and Hogan38, Reference Levin, Triscari and Sullivan39), and adversely affect skeletal structural integrity(Reference Salem, Zernicke and Barnard4, Reference Wohl, Loehrke and Watkins5, Reference Li, Zernicke and Barnard14–Reference Hou, Zernicke and Barnard16). According to the most recent Canadian Community Health Survey, the average Canadian consumes 17 % of energy from protein, 51 % from carbohydrate and 32 % from fat, of which 10 % is saturated fat. However, there is a considerable segment of the population (a substantial subset of whom are adolescent) that habitually consumes fast food, for which the macronutrient composition is much closer to that consumed by our HFS mice (39·5 % of energy from sucrose and 39·5 % from saturated fat). Fast food comprises a growing portion of food eaten outside the home. Over one-third of North Americans report having eaten fast food on any given day, while 7 % eat fast food daily(Reference US Department of Agriculture, ERS40). Nutritional analysis shows fast food to be high in fat, saturated fat, energy density, fructose and glycaemic index, yet poor in fibre, vitamins A and C and Ca(Reference Guthrie, Lin and Frazao41). Over the past 20 years, sugared beverage intake has increased 70 % in children aged 2–18 and 83 % in young adults aged 19–36(Reference Nielsen, Siega-Riz and Popkin42). Based on these data, the experimental diets examined in skeletally immature female mice in the present study are relevant to a sub-portion of the population – the one considered at greatest risk.
Morphological findings in female rodents fed a HFS diet v. those fed a LFCC diet have been previously reported for either shorter (10 weeks in rats) or longer term (2 years) relative duration. Salem et al. (Reference Salem, Zernicke and Barnard4) reported a decrease of 11 % in cross-sectional area of L6 vertebrae of rats fed an HFS diet for 10 weeks. Moreover, vertebral heights and volumes were substantially diminished in that group(Reference Salem, Zernicke and Barnard4, Reference Zernicke, Salem and Barnard15). Conversely, Li et al. (Reference Li, Zernicke and Barnard14) found no significant change in the cross-sectional area of the tibiae of female rats fed an HFS diet for 10 weeks. Our data showing a 25 % reduction in relative tibial cross-sectional area in HFS mice may be related to the animal model and comparative duration of the experiment with respect to the animals' typical lifespan; as previous reports found exacerbation of adverse skeletal effects with prolonged ingestion of HFS diet(Reference Zernicke, Salem and Barnard15).
In agreement with the observations of a reduced cross-sectional cortical area in the HFS mice, we also observed reduced tibial Ct.Th with HFS. Previous reports noted reduced cortical/trabecular bone ratios in the femoral neck of rats fed an HFS diet(Reference Holl and Allen9, Reference Zernicke, Salem and Barnard15), similar to the substantial decrease (28 %) in the relative tibial diaphyseal Ct.Th observed in the present study. However, as no direct measurements of tibial Ct.Th were examined previously, a direct comparison to those data is not possible.
The 23 % decrease in relative tibial maximal load measured in HFS mice in the present study was likely linked to the observed compromised morphological properties of this cohort(Reference Li, Zernicke and Barnard14). Previously, Zernicke et al. (Reference Zernicke, Salem and Barnard15) reported substantial decreases in relative load at maximum in L6 vertebrae and in the femoral neck of HFS rats. The large deficits in maximal load reported in the Zernicke study were likely accounted for by anatomic location, bone type and length of study (2 years v. 10 weeks in the present study).
The high-saturated fat content of the current diet also likely contributed to the skeletal decrements observed in HFS mice. Early studies showed that increased levels of saturated fat in the diet impair Ca absorption in the gut via formation of insoluble soaps(Reference French6, Reference Tadayyon and Lutwak7, Reference Bengner, Johnell and Redlund-Johnell43). As the diet in the present study was high in both sucrose and in SFA such as stearic and palmitic acids, the reductions in the morphological and structural properties observed in the bones of our mice were likely associated with intestinal soap formation as well as altered mineral metabolism, ultimately adversely affecting both Ca absorption and Ca retention.
Serum TRAP (a marker of bone resorption(Reference Halleen, Alatalo and Suominen44)) levels were significantly elevated in HFS mice relative to controls. Given that serum osteocalcin (a marker of bone formation(Reference Calvo, Eyre and Gundberg45)) levels were not different between cohorts, it appears that ingesting an HFS diet may have disrupted the balance between bone formation and resorption, favouring resorption. Although definitive conclusions cannot be made with the current data alone, greater bone resorption (i.e. osteoclast activity) in the HFS mice supports the present findings of reduced cross-sectional area and Ct.Th, leading to structurally compromised skeletal tissue, with potentially elevated resorption at the endosteum and/or the periosteum.
Upregulation of RANKL mRNA in the HFS fed mice may be indicative of increased bone turnover and subsequent loss in this cohort. Whether this is a response to ingesting an HFS diet directly remains to be determined. Elevated OPG mRNA in the HFS cohort, although NS (P = 0·10), may be due to the increases in leptin circulation associated with inducing obesity in rodents fed an HFS diet. As such, we found no significant differences in the OPG/RANKL mRNA ratio in the HFS v. the LFCC mice. These data may suggest that the elevation in osteoclast activity measured in the serum of the HFS mice was not due to perturbations in the OPG/RANKL axis, but rather to an alternate molecular/biochemical pathway, perhaps associated with the chronic inflammatory state incurred by inducing obesity in the HFS mice.
The role of pro-inflammatory cytokines such as TNF-α and their function in bone resorption may provide an alternate explanation for the increase in TRAP activity measured in the HFS mice in the present study. Increases in TNF-α are associated with negative changes in bone metabolism. It has recently been documented that ingestion of diets high in saturated fat can increase the release of TNF-α from adipose tissue(Reference Kern, Saghizadeh and Ong21, Reference Morin, Eckel and Marcel46) and that expression increases with level of obesity(Reference Hotamisligil, Arner and Caro47). As the HFS mice in the present study were largely overweight and ingesting substantial amounts of saturated fat, this cohort likely experienced an elevated level of pro-inflammatory cytokines, partially accounting for the large elevations in bone resorptive activity, as measured by serum TRAP, but not OPG/RANKL mRNA ratios.
COX-2 mRNA expression was approximately 52 % greater in mice fed an HFS diet. These data agree with a theory of pathologic inflammatory bone resorption created by inducing obesity in the HFS mice as inflammatory mediators, including TNF-α are known stimulators of COX-2 expression(Reference Coon, Gulati and Cowan48). During chronic inflammatory states, PG (mainly PGE2) can stimulate bone resorption by increasing the amount and functional activity of osteoclasts(Reference Raisz49–Reference Okada, Pilbeam and Raisz51). As such, it is possible that an induced inflammatory state in the HFS mice may be associated with the noted elevations in RANKL and COX-2 mRNA. Moreover, this would agree with the findings of compromised morphological and structural indices of strength, in addition to elevated levels of osteoclast activity noted in the serum of the HFS animals.
A notable limitation of the present study was the lack of an ‘absolute’ control (i.e. a group fed only standard chow or AIN-93 in addition to LFCC and HFS groups). The current diet formulations used a combination of maize oil and lard and more closely resembled the SFA and PUFA profiles of the AIN-76 diet. The most recent rodent dietary recommendations (based on AIN-93 diet) endorse the use of soyabean oil to improve the linolenic acid content. Given that essential fatty acids affect bone metabolism, it cannot be ruled out that there were adverse effects of low n-3 fatty acid content in the present study. Another limitation was the lack of food intake data. While it has been established that rodents fed a HFS diet will consume more energy than those fed a diet of normal energy density (similar to our LFCC), we did not have a group of animals consuming a standard chow diet to make direct comparison for the bone parameters measured in the present study.
In summary, the present findings indicated that in the skeletally immature female mouse, ingestion of an HFS diet for 10 weeks markedly reduced tibial structural integrity. Despite the significantly greater body mass of the HFS mice, tibiae were morphologically and structurally inferior to the bones of the LFCC group. Blood data suggested that attenuated bone accretion was likely due to elevated bone resorptive activity in the HFS mice, without affecting the process of bone formation. It appeared that ingestion of a HFS diet did not adversely affect the OPG/RANKL mRNA ratio of young mice, as RANKL and OPG mRNA were elevated to similar extents. However, COX-2 mRNA expression was also elevated, suggesting that the inflammatory state of obesity induced by chronic consumption of a HFS diet may have contributed to resorptive bone loss. Nonetheless, the importance of diet-related changes on skeletal integrity and the significance of consuming a diet rich in saturated fats and refined sugar with respect to bone development and maintenance have potential clinical implications, and, therefore, need to be further investigated to identify key elements associated with diet-related bone loss and to promote non-pharmacological methods of preserving bone mass across a lifespan.
Acknowledgements
We thank Marjolein Blaauboer, Josh Klinck, Paul Sciore and Kristine Lee for their technical assistance. The authors declare no conflict of interest. C. L. executed all experimental techniques, animal handling, analysis of structural, geometrical and haematological data, and drafted the manuscript. R. A. R. analysed molecular data and edited the manuscript. S. K. B. analysed scanning/image data and edited the manuscript. R. F. Z. obtained funding for the study, interpreted data and edited the manuscript. The present study was supported by the Natural Science and Engineering Research Council of Canada, the Canadian Institutes for Health Research, the Alberta Heritage Foundation for Medical Research and the Wood Professorship for Joint Injury Research.



