

1. Introduction
Many models have been proposed to describe dry-snow avalanches (see, e.g., Reference SalmSalm, 1966; Reference Perla, Cheng and McClungPerla and others, 1980; Reference Dent and LangDent and Lang, 1983; Reference HutterHutter, 1996), but very few data are available to calibrate the parameters of these models. It is consequently a great challenge to obtain these parameters by means of measurements on dry-snow flows.
The question of velocity profiles in snow flows has already been investigated by Reference Nishimura and MaenoNishimura and Maeno (1989) and Reference Tiefenbacher and KernTiefenbacher and Kern (2004) in a mini-avalanche system and Reference Dent, Burrell, Schmidt, Louge, Adams and JazbutisDent and others (1998) in a real avalanche. They all observed a thin, highly sheared layer at the bottom, with a large upper layer whose velocity gradient was much smaller (even rigid in the case of Nishimura and Maeno’s measurements). To our knowledge, no systematic studies of velocity profiles for different slopes and height have been performed. For this reason, we built a system to produce snow flows at various slopes and rates. Our purpose was to produce steady-state flows, so the region in which the flow occurs had to be long enough. This enables us to measure velocity profiles of “dry snow flow” for slopes in the range 31–39° which are presented in this paper.
Typical values of height and velocities for the flows we observed are h ≈ 80 mmand υ ≈ 4 ms- 1. The approximate Froude number is thus Fr ≈ 4.5. Such flows are more than one order of magnitude smaller than real avalanches, and the extrapolation to a larger scale is hypothetic.
2. Set-Up
2.1. The device
The experimental set-up we built, its performance and the experimental procedure are fully described in Reference Bouchet, Naaim, Ousset, Bellot and CauvardBouchet and others (2003). The set-up is shown in Figure 1. It consists of an inclined channel with an adjustable slope. The snow is fed by a motorized hopper. The channel is clamped to a beam whose inclination is adjustable between 27° and 41° in increments of 2°. As section 3 will establish, steady-state flows were observed in part of this range. The channel is 10m long, 0.2 m wide and 0.2 m high. The feeding system consists of a storage hopper with an Archimedean screw underneath to drag the snow from the hopper into the channel at a constant rate. The screw has a slightly increasing thread lead to prevent compaction of the snow during the experiment. It is set in motion by a diesel engine linked to the screw by a hydraulic engine. This enables us to set a constant rate at any value <220m3 h-1. Since the storage capacity of the hopper is around 5 m3, the flow can last from one to several minutes. However, to prevent too much compaction of the snow, the hopper is filled only to one-third of its capacity, leading to flows of about 20–30 s. Since the channel is narrower than the screw, a funnel-shaped slide links the end of the screw to the beginning of the channel. The bottom of the channel has been covered with sandpaper to create a rough bottom and hence a shear layer of significant depth. Underneath, it has a double bottom where the electronic systems required for the sensors are installed. The flow is released by starting the screw and reaches steady state after approximately 1s.
The experimental set-up at the “Col du Lac Blanc”, Alpe d’Huez, French Alps (2800 m a.s.l.).

2.2. The instrumentation
The sensors installed in the channel (sketched in Fig. 2) provide measurements of:
Sketches of the sensor positions along the channel. The left one is a view from the side, and the right one is a viewfrom the top.
the normal (σ) and shear (τ) stresses at the bottom of the channel, 6 m downstream from the top of the channel, using piezoelectric sensors;
the flow height at three different locations―H1, 4.5 m downstream from the top of the channel, H2, 6 m down-stream (above the stress measurements) and H3, 6.5 m downstream−using optical distance sensors above the flow;
the velocity profiles at three different locations: 6m downstream from the top of the channel, on the side-wall (profile P3, below the measure of H2), and 6.5 m downstream, both on the side-wall (profile P1) and in the middle of the channel (profile P2).
For the velocity measurement, we used the method developed by Reference Dent, Burrell, Schmidt, Louge, Adams and JazbutisDent and others (1998). This is based on the correlation of two signals obtained by two identical sensors which are displaced from each other in the flow direction. Each velocity sensor is made of two identical reflectivity sensors which consist of an infrared light-emitting diode (LED) and a phototransistor as represented in Figure 3. These devices are very sensitive to the amount of light collected by the phototransistor. Since this amount of light depends on the granularity state of the reflecting surface, the signal obtained is characteristic of the snowpack which reflected the light from the LED to the phototransistor.
Schematic drawing of the optical devices used in the velocity sensors.
When the velocity direction is known, two such devices displaced at a distance d in the velocity direction from one another, will give identical signals with a time shift δt = d/v, where υ is the velocity. To improve the performance of this method, we used three devices instead of two. The first and second devices are separated by a distance in the flow direction d1 = 30 mm, and the second and third by a distance d2 = 20 mm. Each velocity measurement is thus performed three times with distances between the two devices of 20, 30 and 50 mm.The velocity profile is then determined by using nine of these sensors placed in a flow-normal line from the bottom with a spacing of 10mm. They are separated from the flow by a 3 mmthick glass window.
All the results presented below were obtained with flows of small rounded snow grains. The densities varied from 220 to 360 kgm-3.
3. Flow-Height Measurements
Typical variations of the heights h2 and h3 during the flow are presented in Figure 4a and b. From these graphs, two observations can be made.
Variations of the height during the flow. (a) The variations of the height h2 during the whole flow; (b) the variations of h2 and h3 during 5 s.
1. The height has periodic variations during the flow (Fig. 4a). We observed that the maxima of these variations travelled with the flow. Our interpretation is that these variations are not waves intrinsic to the flow but are due to the feeding system.
2. The variations of h2 follow those of h3 (Fig. 4b). In a first approximation, it can be written that: h2(t) ≈ h3(t − δt), where δt is a delay approximately equal to 0.5 s.
Considering the first point, one cannot rigorously say that steady-state conditions are achieved. Still, if T is the period of the height temporal variations, then the average of the flow height over time T at the instant t, written 〈h2〉T (t), has almost no dependence on t:

Such a flow can be described as steady. No regular increase or decrease of the height can be observed during the flow.
From the second point, we can say that when averaged over the period T, the heights 〈h2〉T (t) and 〈h3〉T (t) are equal. This implies that the flow has reached its terminal velocity and is fully developed:
Thus, when averaged over the flow duration, the measured quantities will be the same as if the flow had reached steady state.
4. Velocity Profiles
In this section, only the measurements obtained from velocity profile P3 (the upstream one; see Fig. 2) are presented. The principle of the sensors and the amount of signal processing required to go from the raw signals to the velocity makes it very rare to obtain an instantaneous velocity profile containing all the sensors (i.e having all the sensors giving a“reasonable” result). Therefore, based on the fact mentioned above that height variations are periodic, it is more accurate to present the velocity profiles obtained when averaging the measurements over the flow duration.
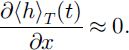
Two examples of the profiles obtained are presented in Figure 5a and b. Figure 5a corresponds to flow No. 31 in Table 1. It was obtained with a slope angle of 31°, a snow density of 220 kgm-3 and a temperature around −25°C (for both snow and air). Figure 5b corresponds to flow No. 73 inTable 1. It was obtained with a slope angle of 39°, a snow density of 270 kgm-3 and a temperature around −20°C (for both snow and air). On these profiles, the horizontal error bars are the standard deviation of the velocity distribution for each sensor during the flow, and the vertical ones are the flow-normal dimension of the sensors. On both profiles, one can notice that the velocity of the lower sensor is non-zero. This means either that there is a highly sheared thin layer at the bottom (the sensor is 1cm high and is placed at the bottom of the channel, so the shear rate would at least be greater than or that the snow is slipping on the bottom. Since we have no way of observing a layer thinner than 10 mm with our sensors, we chose to describe this layer by a slip condition. Above this slip layer, the velocity increases slightly but regularly, with an almost uniform velocity gradient. Since both these characteristics were observed for every flow, we performed a linear fit for each profile with the function:
Two examples for different slopes and heights of the time-averaged velocity profiles. The hatched box on top represents the minimum and maximum height measurements during the flow duration. The slope angles for these profiles were 31° for (a) and 39° for (b).
Characteristics of the flows
Each profile is thus described by two parameters:
1. A slip velocity Vs
2. A uniform shear rate r
The characteristics (slope, height and density) of the flows and the results obtained are presented in Table 1.
The shear rates obtained are very similar to each other. Besides, as seen in Figure 6a and b, no specific dependences upon the slope, height or density can be observed in the range investigated. The slip velocity Vs, however, increases with the slope as represented in Figure 7.
Variations of the shear rate ![]() with density (a), height (b) and slope (c).
with density (a), height (b) and slope (c).
Dependence of the slip velocity on the slope.
5. Comparison with Other Results
In this section, the two characteristics of our velocity profiles (a uniform velocity gradient and a slip velocity at the bottom) are compared to previous measurements of snow properties.
5.1. Velocity profiles in snow flows or avalanches
Velocity profiles have been measured in snow flows by Reference Nishimura and MaenoNishimura and Maeno (1989) and Reference Tiefenbacher and KernTiefenbacher and Kern (2004) and in real avalanches by Reference Dent, Burrell, Schmidt, Louge, Adams and JazbutisDent and others (1998). The dimensions of their experiments and the conditions in which they were performed are fairly different. It is thus not surprising that they lead to different results.
A device similar to ours was used by Reference Nishimura and MaenoNishimura and Maeno (1989). It consists of a 0.1 m wide, 6 m long channel. The snow was fluidized by air injection before its release, and the flow lasted approximately 3 s. The velocity profiles obtained were interpreted as those of a threshold fluid: an upper layer in which particles move as a rigid body, and a sheared layer underneath with a parabolic profile. The sheared layer is 20–30mm thick.
Reference Dent, Burrell, Schmidt, Louge, Adams and JazbutisDent and others (1998) performed their measurements in a real avalanche. The profiles had a layer thinner than 10 mm at their bottom, where the velocities increase to 3–4ms-1. On top of this layer, the shear rate drops to a value at least an order of magnitude smaller. The thin layer at the bottom is interpreted as being mainly responsible for the speed of the avalanche.
The“Weissfluhjoch chute”was used by Reference Tiefenbacher and KernTiefenbacher and Kern (2004). It consists of a 34 m long, 2.5 m wide channel. The velocity profiles obtained are similar in shape to those obtained by Reference Nishimura and MaenoNishimura and Maeno (1989), with a high sheared layer at the bottom, approximately 50 mm thick, and a quasi-uniform “plug-flow” layer above. The sheared part of the flow was approximated by a parabolic profile.
Our profiles differ from those obtained by Reference Nishimura and MaenoNishimura and Maeno (1989) and Reference Tiefenbacher and KernTiefenbacher and Kern (2004), but the flow regime they observed also differs from ours: we study a quasi-steady-state flow, while theirs are in a transitory state. The profiles we measured are similar to those observed in a real avalanche: a thin (<10mm thick), highly sheared layer at the bottom, surmounted by an upper layer with an approximately uniform shear rate. This constant shear rate in the upper layer disproves the existence of a simple relationship between the shear rate r and the shear stress τ.
5.2. Snow–snow friction
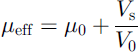
As explained in section 3, flows can be considered as fully developed and steady so that quantities may be averaged over the flow duration. Therefore, the effective friction coefficient, defined as μeff = τ/σ where τ and σ are respectively the shear and normal stresses at the bottom of the flow, balances the gravity: μeff = tan θ. Now, as represented in Figure 8, Vs increases linearly with tan θ in the range investigated: Vs = -Voffset + V0 tan θ. Thus, the friction coefficient increases linearly with the slip velocity in the range investigated:
Linear fit of the dependence of the slip velocity on the slope: Vs = −Voffset + V0 tan θ. Parameters are: Voffset= 2.53m s-1 and V0 = 9.08m s-1.
with μ0 = 0.28 and V0 = 9.1 m s- 1.
Similar results were reported by Reference Casassa, Narita and MaenoCasassa and others (1991) for friction measurements between two rigid snow layers. They obtained similar values of μ0, depending on the temperature, but V0 in our case is five times smaller than theirs. Thus, in our experiments, the friction coefficient increases five times faster with the slip velocity than in Casassa and others’ experiments. This is certainly due to the difference in roughness state between the sandpaper we use and the snow.
6. Flow-Rate–Flow-Height Relationship
Taking into account Equations (1) and (2), the velocity within the flow can finally be written:
with tan θ0 = μ0. Averaging this equation over the flow height h leads to the relationship between the average velocity u of the flow and the flow height in the range of slopes and height investigated:
with V0 ≈ 9.1ms1, tan 0 = 0.28 (θ0 ≈ 15.5°) and γ̇ ≈ 15 s1.
7. Conclusion
The experimental set-up installed at the “Col du Lac Blanc” enabled us to generate fully developed flows with snow with small rounded grains. Slope angles of 31–39° were investigated. The observed flows were steady and fully developed. Consequently, the velocity profiles were averaged over the flow duration and analyzed as those of a steady-state flow. The profiles found are similar to those observed in a real avalanche by Reference Dent, Burrell, Schmidt, Louge, Adams and JazbutisDent and others (1998): a uniform shear rate within the flow and an active thin layer at the bottom, interpreted as a slip velocity. The dependence of the slip velocity on the slope angle can be interpreted in terms of a friction coefficient, and leads to results similar to snow–snow frictionmeasurements done by Reference Casassa, Narita and MaenoCasassa and others (1991). Finally, from the shape of the profile, a flow law was derived for the range of slopes and heights investigated.
Acknowledgements
Many people have participated in the installation of the experimental set-up at the “Col du Lac Blanc” and to the huge amount of work necessary to establish a satisfactory experimental procedure. Mentioning all of them would add a couple of pages to this paper, so we would like to thank every person who helped us dig metres-deep trenches in packed snow or make reinforced concrete foundations for the set-up at the bottom of the trench. Among them, special thanks to R. Ducret, who put amazing enthusiasm into all these activities, and to D. Cauvard who did much of the dirty job of signal processing.


